There are limited data regarding the role of coronary computed tomographic angiography (CCTA) in asymptomatic patients with type 2 diabetes mellitus. We analyzed 557 asymptomatic type 2 diabetic patients who underwent CCTA. Cardiac event was defined as a composite of cardiac death, nonfatal myocardial infarction, acute coronary syndrome requiring hospitalization, or late revascularization. Atherosclerotic plaques were observed in 395 patients (70.9%), and 170 patients (30.5%) showed significant coronary artery disease (CAD) on CCTA. Ninety-two patients (16.5%) were associated with a significant stenosis in the left main or proximal left anterior descending artery. During the follow-up period (33.7 ± 7.8 months), although an excellent prognosis was observed in patients without significant CAD on CCTA, those with significant CAD showed more cardiac events (7.1% vs 0.5%) and lower 3-year event-free survival rates (99.2 ± 0.6% vs 90.9 ± 2.6%, p <0.001). Furthermore, in group with significant CAD, patients with significant CAD in the left main or proximal left anterior descending artery had more cardiac events (10.9% vs 2.6%) and lower 3-year event-free survival rates (97.4 ± 1.8% vs 86.1 ± 4.2%, p = 0.049). On multivariate analysis, family history of premature CAD, previous history of stroke, higher UK Prospective Diabetes Study 10-year risk scores, neuropathy, and retinopathy were independent clinical predictors of having significant CAD and left main or proximal left anterior descending artery significant CAD on CCTA. In conclusion, about 1/3 of asymptomatic type 2 diabetic patients had significant CAD on CCTA with a subsequent high risk for cardiac events. These findings suggest that CCTA may have a potential role in identifying patients with high cardiovascular risks in asymptomatic type 2 diabetes.
Coronary artery disease (CAD) is the leading cause of death in individuals with diabetes mellitus. Diabetes is associated with a greater prevalence of atherosclerosis and CAD in these patients is often asymptomatic until the onset of myocardial infarction or sudden cardiac death. Diabetes is also recognized as a CAD risk equivalent. Recently, with the advent of multidetector-row computed tomography, coronary computed tomographic angiography (CCTA) has the potential to provide comprehensive information regarding CAD lesion location, severity, and characteristics of atherosclerotic plaque. Although the impact of CCTA in diabetic patients has been already known from previous observational studies, there are limited data regarding the role of CCTA in asymptomatic type 2 diabetic patients. Previous studies using CCTA in this selected population included a relatively small number of patients and were lacking in clinical outcomes. Moreover, there is still uncertain regarding the use of CCTA in asymptomatic type 2 diabetic patients. Therefore, through a more rigorous analysis with a large cohort consisted of asymptomatic type 2 diabetic patients, we investigated the role of CCTA and sought to identify high-risk subgroups.
Methods
From February 2008 to February 2011, 557 asymptomatic patients with type 2 diabetes aged 30 to 80 years, who had undergone CCTA evaluation in diabetes center at Asan Medical Center, were prospectively enroled. Diabetic mellitus was defined as a fasting plasma glucose concentration ≥126 mg/dl or self-reported history of diabetes and/or treatment with dietary modification, oral hypoglycemic agents, or insulin. Exclusion criteria were (1) abnormal rest electrocardiographic results, that is, pathological Q waves, ischemic ST segment or T wave changes, or left bundle-branch block; (2) exertional dyspnea, angina pectoris, or chest discomfort evaluated with a positive Rose questionnaire ; (3) renal insufficiency (creatinine ≥1.5 mg/dl); (4) history of open heart surgery; (5) history of myocardial infarction, coronary revascularization, or heart failure; (6) uncontrolled arrhythmia; (7) history of allergy to contrast dye; and (8) pregnancy or women of childbearing age who were not using contraceptives. This study was approved by the local Institutional Review Board at the Asan Medical Center, Seoul, Korea. All patients provided written informed consent.
Basic demographic data were obtained by a review of patients’ medical records. Any medical history of hypertension, stroke, or peripheral artery disease; family history of premature CAD; duration of type 2 diabetes; current medication profiles; and smoking status were documented. Body weight, height, body mass index, and blood pressure were also measured. Total cholesterol, triglyceride, high-density lipoprotein cholesterol, low-density lipoprotein cholesterol, fasting plasma glucose, glycated hemoglobin, serum creatinine, and C-peptide value were measured after at least a 12-hour fasting period during their visit. Hypertension was defined as a self-reported history of hypertension and/or use of antihypertensive medication or a blood pressure of ≥140/90 mm Hg. Hyperlipidemia was defined as total cholesterol of >200 mg/dl or receiving antihyperlipidemic treatment. Neuropathy was defined as a just noticeable difference of >15 in the hands or >20 in the feet according to a vibration-sensory threshold test. Retinopathy was evaluated by a fundoscopic examination. Nephropathy was defined as >20 µg/min of albuminuria. A CAD risk was calculated from nonfatal and fatal CAD 10-year risk scores by the UK Prospective Diabetes Study (UKPDS) risk engine.
Multidetector computed tomographic angiography was performed using a dual-source scanner (Somatom Definition, Siemens, Germany), with the following acquisition parameters: tube voltage, 80 to 120 kVp based on the body habitus of the patient; tube current, 240 to 400 mA per rotation depending on the body habitus of the patient; detector collimation, 0.6 mm; adaptive pitch value of 0.2 to 0.5 based on the patient’s heart rate; retrospective electrocardiographic gating and pulsing. We used contrast media of 400 mg/ml iodine concentration (Iomeron 400, Bracco, Italy) in the amount of 55 to 80 ml at a rate of 4 ml/s followed by a saline chaser. The CT scan range was from the carina to the diaphragm. We used 0.3 mg of nitroglycerin sublingually or 2 minutes of oral spray before CT. Beta blocker (bisoprolol 2.5 mg) was administered orally for lowering heart rate when the patient’s heart rate exceeded 90 beats/min. Optimal phase reconstruction was selected manually or using automated software (Bestphase, Siemens, Germany). Image sets of the volume-rendered images, whole coronary tree maximum intensity projection, and maximum intensity projection and multiplanar reformatted images of short-axis, 2-chamber, 4-chamber, and transaxial images were reconstructed for the evaluation of the coronary arteries. Additional reconstructions were performed if motion artifacts were present. The mean radiation exposure of CCTA was 7.0 ± 3.6 mSv. The mean heart rate during CCTA was 68.5 ± 10.9 beats/min.
All CCTA scans were analyzed by 2 experienced cardiovascular radiologists (THL >10 years; JWK 7 years) blinded to the clinical information. Final decisions regarding the findings were reached by consensus. Based on the Society of Cardiovascular Computed Tomography guidelines, a 16-segment coronary artery tree model was used. A coronary artery calcium score (CACS) was measured with the scoring system described, categorized by scores of 0, 1 to 10, 11 to 100, 101 to 400, and >400. Plaques were defined as structures of >1 mm 2 within and/or adjacent to the vessel lumen, which could be clearly distinguished from the lumen and surrounding pericardial tissue. Plaques containing calcified tissue involving >50% of the plaque area (density >130 H) were classified as calcified, plaques with <50% calcium were classified as mixed, and plaques without calcium were classified as noncalcified lesions. The contrast-enhanced portion of the coronary lumen was semiautomatically traced at the site of maximal stenosis and compared with the mean value of the proximal and distal reference sites. Stenosis of ≥50% was defined as significant. In addition, overall plaque burden was determined from coronary artery plaque scores, calculated from modified Duke prognostic scores, segment stenosis scores, and segment involvement scores, as described.
Follow-up data were obtained by a review of medical records or telephone interviews using trained personnel through the end of January 2012. The primary end point of the study was cardiac events, including cardiac death, nonfatal myocardial infarction, acute coronary syndrome requiring hospitalization, or late revascularization. Death was considered to be cardiac in etiology unless an unequivocal noncardiac cause was established. The diagnosis of myocardial infarction was based on the presence of new Q waves in at least 2 contiguous leads or an elevation of creatine kinase or its MB isoenzyme to at least 3× the upper limit of the normal range at follow-up. Revascularization was performed if there was a stenosis of at least 50% of the diameter with a positive stress test or if there was a stenosis of at least 70%. Six months after the index CCTA was used as a cutoff between early and late coronary revascularization.
Categorical data are displayed as frequencies and compared with chi-square statistics or Fisher’s exact test. Continuous variables are presented as mean ± SD and analyzed by the unpaired Student t test. The relation between plaque or CAD and CACS was analyzed with chi-square test for trend. Multiple logistic regression analysis was performed to identify independent clinical predictors of having significant CAD on CCTA, and a backward elimination process was used. Survival curves were constructed using the Kaplan-Meier method and compared using the log-rank test. A p value of <0.05 was considered statistically significant. All statistical analyses were performed using SPSS software (version 18.0; SPSS Inc., Chicago, Illinois).
Results
The mean age of the overall population was 62.4 ± 8.2 years, 59.4% were men. The mean duration of diabetes was 12.5 ± 7.8 years, and the mean hemoglobin A1C was 7.5 ± 1.2%. Seven (1.3%) of the patients were treated for diabetes with lifestyle modification, 480 (86.2%) with oral hypoglycemic agents, and 70 (12.5%) with insulin. The average UKPDS risk scores were 20.3 ± 12.7%. The baseline characteristics according to the significant CAD are listed in Table 1 .
| Characteristics | Significant CAD | p Value | |
|---|---|---|---|
| No (n = 387) | Yes (n = 170) | ||
| Age (yrs) | 61.3 ± 8.2 | 64.7 ± 7.6 | <0.001 |
| Men | 216 (55.8%) | 115 (67.6%) | 0.009 |
| Diabetic duration (yrs) | 11.3 ± 7.2 | 15.1 ± 8.4 | <0.001 |
| Body mass index (kg/m 2 ) | 24.9 ± 3.1 | 24.7 ± 3.0 | 0.351 |
| Systolic blood pressure (mm Hg) | 131.9 ± 14.5 | 134.5 ± 15.8 | 0.059 |
| Diastolic blood pressure (mm Hg) | 73.9 ± 8.2 | 73.1 ± 9.3 | 0.380 |
| Hypertension | 212 (54.8%) | 115 (67.6%) | 0.005 |
| Current smoker | 60 (16.3%) | 41 (24.3%) | 0.030 |
| Family history of CAD | 5 (1.3%) | 9 (5.3%) | 0.014 |
| Hyperlipidemia | 200 (51.7%) | 78 (45.9%) | 0.208 |
| Previous stroke | 14 (3.6%) | 22 (12.9%) | <0.001 |
| Previous peripheral artery disease | 3 (0.8%) | 5 (2.9%) | 0.061 |
| UKPDS 10-year risk score (%) | 17.8 ± 11.1 | 26.1 ± 14.2 | <0.001 |
| Fasting blood glucose (mg/dl) | 140.7 ± 38.7 | 144.8 ± 40.7 | 0.259 |
| Glycated hemoglobin (%) | 7.4 ± 1.3 | 7.7 ± 1.1 | 0.052 |
| C-peptide (ng/ml) | 1.9 ± 1.0 | 1.8 ± 1.3 | 0.373 |
| Creatinine (mg/dl) | 0.9 ± 0.2 | 0.9 ± 0.2 | 0.007 |
| Total cholesterol (mg/dl) | 177.2 ± 33.5 | 176.3 ± 34.5 | 0.783 |
| LDL cholesterol (mg/dl) | 109.7 ± 29.3 | 109.5 ± 30.4 | 0.932 |
| HDL cholesterol (mg/dl) | 50.8 ± 11.7 | 47.8 ± 11.5 | 0.007 |
| Triglyceride (mg/dl) | 135.6 ± 73.4 | 138.8 ± 80.7 | 0.650 |
| Diabetic treatment | 0.020 | ||
| Diet only | 6 (1.6%) | 1 (0.6%) | |
| Oral hypoglycemic agent | 342 (88.4%) | 138 (81.2%) | |
| Insulin | 39 (10.1%) | 31 (18.2%) | |
| Neuropathy | 87 (22.5%) | 70 (41.2%) | <0.001 |
| Retinopathy | 91 (23.5%) | 72 (42.4%) | <0.001 |
| Nephropathy | 64 (16.8%) | 47 (27.6%) | 0.004 |
| Medical treatment | |||
| Antiplatelet agent | 109 (28.2%) | 69 (40.6%) | 0.004 |
| Lipid-lowering agent | 125 (32.3%) | 49 (28.8%) | 0.415 |
| ACEI or ARB | 105 (27.1%) | 69 (40.6%) | 0.002 |
| Beta-blocker | 26 (6.7%) | 26 (15.3%) | 0.001 |
| Calcium channel blocker | 86 (22.2%) | 47 (27.6%) | 0.167 |
A total of 48 (0.6%) of 8,355 coronary segments were not interpretable due to artifacts. The mean CACS was 189.6 ± 480.3. A CACS of 0 was observed in 212 patients (38.1%), 1 to 10 in 64 patients (11.5%), 11 to 100 in 111 patients (19.9%), 101 to 400 in 99 patients (17.8%), and 71 patients (12.7%) had a calcium score of >400. Of the 557 asymptomatic patients with type 2 diabetes, 395 (70.9%) had atherosclerotic plaques (3.6 ± 2.5 segments). Calcified plaques emerged as the most frequent type of atherosclerotic plaque in 295 (53.0%). Noncalcified plaques and mixed plaques were also found in 188 (33.8%) and 119 (21.4%). Plaque burden scores including modified Duke prognostic score, segment stenosis score, and segment involvement score were higher in patients with significant CAD (p <0.001 for all) ( Table 2 ). The incidence of any plaque increased with CACS category (p <0.001) ( Figure 1 ).
| CCTA Characteristics | Significant CAD | p Value | |
|---|---|---|---|
| No (n = 387) | Yes (n = 170) | ||
| Mean CACS | 55.0 ± 153.5 | 496.2 ± 754.4 | <0.001 |
| CACS classification | <0.001 | ||
| 0 | 195 (50.4%) | 17 (10.0%) | |
| 1–10 | 52 (13.4%) | 12 (7.1%) | |
| 11–100 | 78 (20.2%) | 33 (19.4%) | |
| 101–400 | 53 (13.7%) | 46 (27.1%) | |
| >400 | 9 (2.3%) | 62 (36.5%) | |
| Any plaques | 225 (58.1%) | 170 (100%) | <0.001 |
| Plaque characteristics | |||
| Calcified plaque | 170 (43.9%) | 125 (73.5%) | <0.001 |
| Noncalcified plaque | 93 (24.0%) | 95 (55.9%) | <0.001 |
| Mixed plaque | 34 (8.8%) | 85 (50.0%) | <0.001 |
| Modified Duke prognostic index | 1.1 ± 0.3 | 3.4 ± 1.2 | <0.001 |
| Segment stenosis score | 0.5 ± 1.1 | 7.6 ± 5.3 | <0.001 |
| Segment involvement score | 1.5 ± 1.9 | 4.9 ± 2.7 | <0.001 |
| Number of stenosed vessels | |||
| One-vessel disease | — | 84 (49.4%) | |
| Multivessel disease | — | 86 (50.6%) | |
| Proximal LAD artery | — | 91 (53.5%) | |
| LM artery | — | 13 (7.6%) | |
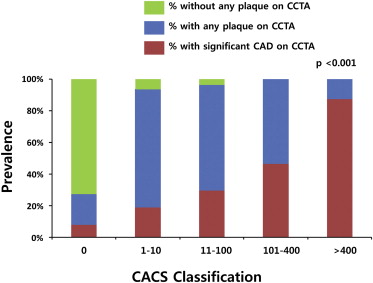
One hundred and seventy patients (30.5%) had a significant (≥50%) stenosis on CCTA, and 79 (14.2%) of them had a severe (≥70%) stenosis. Those with significant CAD had more CACS and atherosclerotic plaques compared with those without (496.2 ± 754.4 vs 55.0 ± 153.5, p <0.001 and 4.9 ± 2.7 vs 1.5 ± 1.9 segments, p <0.001). The incidence of significant CAD also increased with CACS category (p <0.001) ( Figure 1 ). One- and multivessel diseases were in 84 (15.1%) and 86 (15.4%), respectively. Significant CAD in the left main (LM) artery, left anterior descending (LAD) artery, left circumflex artery, and right coronary artery was observed in 13 (2.3%), 138 (24.8%), 74 (13.3%), and 79 (14.2%), respectively. Furthermore, in patients with only noncalcified plaques (n = 68) and zero CACS (n = 212), significant CAD occurred in 24 and 17, respectively. On multivariate analysis, family history of premature CAD, previous stroke, higher UKPDS 10-year risk scores, neuropathy, and retinopathy were independent clinical predictors of having significant CAD on CCTA ( Table 3 ).
| Univariate Analysis (1) | Univariate Analysis (2) | |||||
|---|---|---|---|---|---|---|
| OR | 95% CI | p Value | OR | 95% CI | p Value | |
| Age (yrs) | 1.056 | 1.031–1.082 | <0.001 | 1.050 | 1.019–1.082 | 0.001 |
| Men | 1.655 | 1.133–2.418 | 0.009 | 1.506 | 0.938–2.417 | 0.090 |
| Diabetic duration (yrs) | 1.065 | 1.039–1.090 | <0.001 | 1.065 | 1.035–1.095 | <0.001 |
| Body mass index (kg/m 2 ) | 0.972 | 0.916–1.031 | 0.350 | 0.984 | 0.915–1.059 | 0.668 |
| Systolic BP (mm Hg) | 1.012 | 1.000–1.024 | 0.060 | 1.006 | 0.991–1.022 | 0.403 |
| Diastolic BP (mm Hg) | 0.990 | 0.969–1.011 | 0.356 | 0.983 | 0.957–1.009 | 0.197 |
| Hypertension | 1.726 | 1.182–2.520 | 0.005 | 1.865 | 1.149–3.029 | 0.012 |
| Current smoker | 1.639 | 1.048–2.564 | 0.030 | 1.346 | 0.781–2.318 | 0.284 |
| Family history of CAD | 4.271 | 1.409–12.941 | 0.010 | 5.388 | 1.843–15.755 | 0.002 |
| Hyperlipidemia | 0.793 | 0.552–1.138 | 0.208 | 0.734 | 0.468–1.151 | 0.178 |
| Previous stroke | 3.960 | 1.973–7.948 | <0.001 | 2.059 | 0.957–4.432 | 0.065 |
| Previous peripheral artery disease | 3.879 | 0.916–16.419 | 0.066 | 3.101 | 0.728–13.210 | 0.126 |
| UKPDS 10-year risk score | 1.053 | 1.037–1.069 | <0.001 | 1.042 | 1.025–1.059 | <0.001 |
| Fasting blood glucose (mg/dl) | 1.003 | 0.998–1.007 | 0.262 | 1.002 | 0.997–1.008 | 0.396 |
| Glycated hemoglobin (%) | 1.154 | 0.998–1.335 | 0.054 | 1.117 | 0.936–1.333 | 0.220 |
| C-peptide (ng/ml) | 0.924 | 0.776–1.100 | 0.374 | 0.802 | 0.633–1.016 | 0.068 |
| Creatinine (mg/dl) | 3.676 | 1.412–9.569 | 0.008 | 4.201 | 1.308–13.486 | 0.016 |
| Total cholesterol (mg/dl) | 0.999 | 0.994–1.005 | 0.783 | 1.002 | 0.996–1.009 | 0.480 |
| LDL cholesterol (mg/dl) | 1.000 | 0.994–1.006 | 0.932 | 1.003 | 0.995–1.011 | 0.437 |
| HDL cholesterol (mg/dl) | 0.978 | 0.962–0.994 | 0.007 | 0.973 | 0.952–0.994 | 0.012 |
| Triglyceride (mg/dl) | 1.001 | 0.998–1.003 | 0.650 | 1.000 | 0.998–1.003 | 0.754 |
| Diabetic treatment by insulin | 1.990 | 1.194–3.317 | 0.008 | 2.730 | 1.553–4.802 | <0.001 |
| Neuropathy | 2.414 | 1.638–3.557 | <0.001 | 3.189 | 2.011–5.057 | <0.001 |
| Retinopathy | 2.390 | 1.627–3.510 | <0.001 | 2.665 | 1.684–4.218 | <0.001 |
| Nephropathy | 1.887 | 1.227–2.901 | 0.004 | 0.878 | 0.495–1.557 | 0.656 |
Stay updated, free articles. Join our Telegram channel

Full access? Get Clinical Tree


