Coronary Blood Flow


Coronary Blood Flow


Morton J. Kern MD, FSCAI, FAHA, FACC


The adoption of invasive coronary physiologic lesion assessment before and during percutaneous coronary intervention has become routine in many catheterization laboratories. The rationale for use of physiology in the cath lab is to overcome the limitation of angiography in reflecting the true ischemic potential of a coronary luminal narrowing. This chapter reviews the physiology of coronary blood flow, concentrating on the intracoronary (IC) pressure and Doppler flow velocity guide wire theory and methods, and the pertinent clinical studies.

The adoption of invasive coronary physiologic lesion assessment before and during percutaneous coronary intervention has become routine in many catheterization laboratories. The rationale for use of physiology in the cath lab is to overcome the limitation of angiography in reflecting the true ischemic potential of a coronary luminal narrowing. This chapter reviews the physiology of coronary blood flow, concentrating on the intracoronary (IC) pressure and Doppler flow velocity guide wire theory and methods, and the pertinent clinical studies.


CONTROL OF MYOCARDIAL BLOOD FLOW

The control of myocardial blood flow is based on balancing the myocardial oxygen (MVO2) supply and demand equation. The heart’s oxygen demand (through blood flow) is met through normal autoregulation by the appropriate oxygen supply. An imbalance in the oxygen demand/supply equation produces myocardial ischemia or infarction.

The heart metabolizes a variety of substrates such as glucose, free fatty acids, lactate, amino acids, and ketones, which are critical for the generation of high-energy phosphates (adenosine triphosphate [ATP] and creatine phosphate) that supply the energy requirements of the myocardium. Under normal aerobic conditions, several substrates contribute simultaneously to meeting myocardial energy needs: free fatty acid (65%), glucose (15%), lactate and pyruvate (12%), and amino acids (5%), while glycolysis plays only a minor role (1, 2).


Determinants of MVO2 Demand

The three major physiologic determinants of MVO2 are heart rate, myocardial contractility, and myocardial wall tension or stress (2) (Additional factors are shown in Table 7-1):


  • Heart rate is the most important determinant of MVO2. When heart rate doubles, MVO2 uptake approximately doubles. Increases in heart rate also increase oxygen consumption and reduce subendocardial coronary flow (3).


  • Myocardial contractility is related to MVO2 consumption by the degree of pressure work per heartbeat. The decrease in MVO2 from falling ventricular wall tension is opposed by the increase in contractility. Drugs that stimulate myocardial contractility elevate MVO2 because heart size, and therefore wall tension, is not reduced substantially and is not offset by enhanced contractility.


  • Myocardial wall tension is proportionate to the aortic pressure and ventricular volume. Tachycardia elevates MVO2 by increasing not only the heart rate but also the frequency of tension development per unit time and the contractility.


TABLE 7-1 Determinants of MVO2


Major


Heart Rate


Contractile state


Tension development


Minor


Activation


Depolarization


Effect of catecholamines


Determinants of MVO2 Supply

MVO2 supply depends on having an adequate inspired oxygen, normally functioning pulmonary capillary transit of oxygen, normal functioning hemoglobin to transport the oxygen and normal blood pressure, and low coronary resistance to permit blood to transit the coronary and capillary circuit. This chain of events in oxygen supply can be disrupted at any point, but insufficient supply is most commonly due to atherosclerotic obstructions. Figure 7-1 depicts factors related to the MVO2 supply and demand relationship.


FIGURE 7-1 Factors influencing myocardial oxygen supply and demand equation. Fio2, fraction of inspired oxygen; Hgb, hemoglobin.


Coronary Resistance and Flow

Coronary arterial flow is directly related to coronary resistance. Coronary resistance (R, pressure/flow) is the sum of the epicardial coronary conductance (R1), precapillary arteriolar (R2), and intramyocardial capillary (R3) resistance circuits (Fig. 7-2) (3). The epicardial vessels (R1) do not offer appreciable resistance to blood flow in the absence of disease. In normal arteries, there is no detectable pressure loss (i.e., resistance) along the length of the vessel (4). The epicardial vascular smooth muscular media responds to changes in aortic pressure and modulates coronary tone in response to flow-mediated endothelium-dependent vasodilators, circulating vasoactive substances, and neurohumoral stimuli. Large conduit arteries are unaffected by myocardial metabolites because of their extramural location, but can produce episodic increases in resistance during severe focal or diffuse contraction (vasospasm) in the absence of atherosclerosis.

Precapillary arterioles (R2) connect epicardial arteries to myocardial capillaries and are the principal controllers of coronary blood flow. Precapillary arterioles (100 to 500 mm) constrict and dilate to adjust blood pressure over the range 60 to 180 mm Hg.

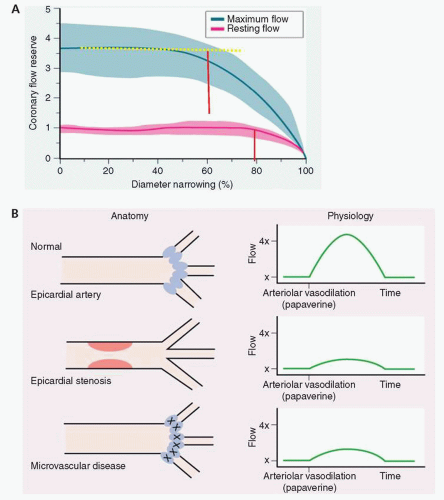
The microcirculatory resistance (R3) is a dense network coupling each myocyte to an adjacent capillary, and functions in a cyclic pattern with very high systolic resistance, followed by minimal diastolic resistance. Precapillary sphincters regulate flow according to oxygen demand. Several conditions, such as LV hypertrophy, myocardial ischemia, or diabetes, can impair the microcirculatory resistance (R3) and blunt the normal maximal increases in coronary flow, resulting in reduced coronary flow reserve (CFR) (i.e., the hyperemic/basal flow ratio).

Global coronary vascular resistance is regulated by several interrelated control mechanisms that include myocardial metabolism (metabolic control), endothelial (and other humoral) control, autoregulation, myogenic control, extravascular compressive forces, and neural control. These control mechanisms may be impaired in diseased states, contributing to episodic myocardial ischemia (Table 7-2).


FIGURE 7-2 Pathologic specimen depicting the three coronary resistances. The epicardial arteries (R1) normally have negligible resistance until an atherosclerotic narrowing occurs (top arrow). The precapillary arterioles (R2, middle arrow) regulate most of the coronary flow to the microvascular bed (R3, bottom arrow).


TABLE 7-2 Regulation of Coronary Circulation


Mechanism


Effector


Autoregulation


Intrinsic vasoconstrictor tone


Perfusion pressure


Aortic or post stenotic pressure


Metabolic activity


Exercise, ischemia


Myocardial compression and myogenic mechanisms


Systolic-diastolic interaction


Neural control


Sympathetic, parasympathetic, pain


Endothelium


EDRF, EDCF


Pharmacologic


Dipyridamole, adenosine, acetylcholine, α-, Β-agonists and antagonists, and so on


EDRF, endothelial derived relaxing factor; EDCF, endothelial derived constricting
factor.


Modified from Gould L. Coronary Artery Stenosis and Reversing Atherosclerosis, 2nd ed. New York: Arnold and Oxford University Press, 1998


Coronary vasodilator reserve is the ability of the coronary vascular bed to increase flow from a basal level to a maximal hyperemic level in response to mechanical or pharmacologic stimuli. Such stimuli include transient coronary occlusion, exercise, or the administration of various pharmacologic agents. CFR is expressed as the ratio of maximal hyperemic flow to resting coronary flow—a ratio that averages from 4 to 7 in experimental animals, and from 2 to 5 in man (5, 6). Factors responsible for reduced CVR in the absence of epicardial stenosis are shown in Table 7-3.

Coronary stenoses can limit coronary vasodilatory reserve (CVR). In experimental animal studies, an increasing conduit stenosis (R1) beyond 60% diameter narrowing produces a predictable decline in CVR. At diameter stenoses >80% to 90%, all available coronary reserve has been exhausted and resting flow begins to decline (Fig. 7-3). In an individual patient, however, CVR is not useful to assess epicardial narrowings, except if normal CVR is present, indicating no significant epicardial or microvascular disease. An abnormal CVR indicates abnormality in the epicardial conduit or the microvascular resistance, or both.


TABLE 7-3 Factors Responsible for a Reduction of Coronary Flow Reserve in the Absence of Coronary Artery Disease


Abnormal vascular reactivity


Abnormal myocardial metabolism


Abnormal sensitivity toward vasoactive substances


Coronary vasospasm


Myocardial infarction


Hypertrophy


Vasculitis syndromes


Hypertension


Diabetes


Recurrent ischemia


From Baumgart D, et al. Am Heart J. 1998; 136:136-149.


FIGURE 7-3 A: Coronary flow reserve, the ratio of maximum to resting flow plotted as a function of percent diameter narrowing. With progressive narrowing, resting flow does not change (dashed line), whereas maximum potential increase in flow and coronary flow reserve begins to be impaired at approximately 50% diameter narrowing. The shaded area represents the limits of variability of data about the mean. CFR is preserved until per cent narrowing exceeds 60% and resting flow is not affected until narrowing exceeds 80%. In patients, this relationship is not a strong since, the percent diameter stenosis is not accurate from the angiogram and that patients have microvascular disease and thus can have an impaired CFR despite a normal coronary artery. (From: Gould KL, et al. Am J Cardiol 1974;33:87-94). B: The limitation of coronary flow reserve (CFR) is the unknown status of the microvasculature. Because there are 2 components, CFR cannot distinguish between an epicardial stenosis and an impaired microcirculation.


Pressure Loss across a Stenosis

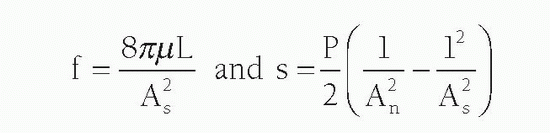
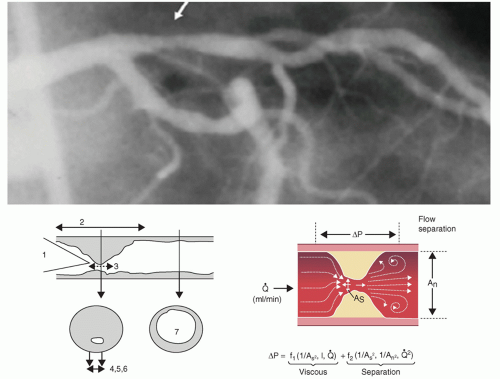
The resistance of a stenosis is related in large part to the morphology of the stenosis. Because resistance produces heat and the heat energy is dissipated, pressure is lost across the stenosis. As blood traverses a diseased arterial segment, turbulence, friction, and separation of laminar flow causes energy loss, resulting in a pressure gradient (ΔP) across the stenosis. The coefficients of friction (f) and separation (s) are related not only to the area of the stenosis (As) but also to the area of the normal reference segment (An) as noted here:


Where As is stenotic segment cross-sectional area, P is blood density, m is blood viscosity, L is stenosis length, and An is normal artery cross-sectional area.

Moreover, the separation energy loss term (s) increases with the square of the flow while viscous energy loss (f) becomes negligible. Pressure loss across a stenosis thus changes exponentially with the fourth power of the radius (as assessed by the cross-sectional area) and linearly with lesion length (Fig. 7-4). For most stenoses, the length of the narrowing has only a modest effect on its physiologic significance. However, in very long mildly narrowed segments, significant turbulence that occurs along the walls of the stenotic segment may result in a significant pressure drop. Additional factors contributing to stenosis resistance include the shape of the entrance and exit orifices, vessel stiffness, and distensibility of the diseased segment (permitting active or passive vasomotion). Dynamic changes in stenosis severity can also occur passively in response to changes in intraluminal distending pressure.


MEASURING CORONARY BLOOD FLOW IN THE CARDIAC CATH LAB

Measurements of IC blood flow velocity or pressure with angioplasty sensor guide wires can be used to describe the coronary physiologic responses to mechanical or pharmacologic interventions, determine the functional significance of a coronary stenosis, and assess the microcirculation and collateral flow (7). Other catheter-based methods used in the evaluation of coronary flow and metabolism in the cath lab include angiography and coronary venous (sinus) efflux measurements, which are discussed elsewhere (8, 9).


FIGURE 7-4 Factors contributing to stenosis resistance include minimal lumen area (4, 5, 6), length of the stenosis (3), the shape of the entrance (1) and exit angles, and size of reference segment (7) beyond the stenosis (figure at the top is frame from angiogram showing LAD lesion, bottom left figure depicts the factors that produce resistance to flow). Not shown here are also the factors of vessel stiffness and distensibility of the diseased segment permitting active or passive vasomotion (bottom right). ΔP, pressure gradient; As, area of the stenosis; An, area of the normal segment; L, stenosis length; Q, flow; f1, viscous friction factor (f); f2, separation coefficient(s).


Angioplasty Sensor Guide Wires: Pressure and Flow

Angioplasty sensor guide wires have a high fidelity pressure sensor located 3 cm from the distal tip, or a Doppler ultrasound crystal at the most distal tip of the wire, or in some cases, a combination pressure/velocity wire. There is both a general and specific methodology for the use of these wires to measure translesional pressure, coronary flow velocity and reserve, or coronary resistances using both pressure and flow velocity measurements simultaneously.


Technique of Sensor-Wire Use

After diagnostic angiography, the sensor angioplasty guide wire is passed through a standard Y connector attached to the guiding catheter ??????(5 or 6F catheters are suitable). About 40 to 60 U/kg of unfractionated heparin is given before introducing the guide wire. Intracoronary nitroglycerin (NTG) (100 to 200 mg) is also given before guide wire introduction. NTG vasodilates and fixes the epicardial vessel diameter for 10 to 15 minutes. It has no effect on fractional flow reserve (FFR) unless the stenosis is vasotonically constricted.

To measure translesional pressure, the pressure wire sensor and guide catheter pressures are first zeroed to atmosphere on the table. The sensor-wire is then advanced into the guide catheter to the coronary ostium. The sensor pressure is matched to the guide catheter pressure (by electronically equalizing or normalizing the two pressures). The guide wire is then passed beyond the stenosis approximately 2 to 3 cm distal to the lesion. To measure FFR, baseline pressures are recorded, followed by induction of coronary hyperemia, continuously recording both guide catheter and sensor-wire pressures. FFR is computed as the ratio of distal coronary pressure to aortic pressure at maximal hyperemia. FFR uses the lowest distal coronary pressure (Fig. 7-5), which coincides with the maximal hyperemic plateau (10, 11).

For coronary flow velocity measurements, the location of the Doppler sensor should be at least 10 artery-diameter lengths (>2 cm) beyond the stenosis. At this location, laminar flow is restored. Turbulent flow closer to the stenosis may lead to underestimation of true velocity. To measure CVR, baseline flow velocity is first recorded, and then coronary hyperemia is induced by IC or IV adenosine (also see other hyperemic options). CVR is then computed as the ratio of maximal hyperemic to basal average peak
velocity (APV; Fig. 7-6) Because of the highly position-dependent signal, poor signal acquisition may occur in 10% to 15% of patients. Guide wire position must be adjusted to move the sample volume and obtain an optimal velocity signal.


FIGURE 7-5 Pressure tracings used to calculate FFR. The aortic phasic and mean pressure (red) is measured with the distal coronary phasic and mean pressure (green). As can be seen on the left side of the figure, there is a mild resting pressure gradient which increases during adenosine. The largest pressure difference at steady hyperemia is then used to determine the ratio of absolute pressure values, i.e., the fractional flow reserve. In this case, it is calculated as 65/90, or 0.72.

The safety of IC sensor-wire measurements is excellent, with rare benign problems related mostly to adenosine. The most common adverse events are severe transient bradycardia after IC adenosine (<2.0%), coronary spasm (1%), and ventricular fibrillation (0.2%) of patients (12).


Coronary Hyperemia

Stenosis severity should always be assessed using measurements obtained at maximal hyperemia. Coronary hyperemia can be induced by coronary occlusion and release (reactive hyperemia), radiographic contrast media, adenosine, dipyridamole, dopamine, nitroprusside, and papaverine. The most widely used pharmacologic agent is adenosine.

The hyperosmolar ionic and low-osmolar nonionic contrast media produce submaximal vasodilatation. Nitrates increase volumetric flow, but since these agents also dilate epicardial conductance vessels, the increase in coronary flow velocity is less than with adenosine or papaverine.

IC papaverine (8 to 12 mg) increases coronary blood flow velocity four to six times baseline flow, but can cause QT prolongation and rarely ventricular tachycardia or fibrillation (13).

Adenosine is a potent short-acting hyperemic stimulus with the total duration of hyperemia only 25% of that of papaverine or dipyridamole (14). Adenosine is benign in the appropriate dosages (20 to 30 mg in the right coronary artery and 30 to 60 mg in the left coronary artery or infused intravenously at 140 mg/kg/min). IV and IC adenosine produce equivalent hyperemia (15). IV adenosine is weight based, and can produce sustained hyperemia necessary for pressure wire pullback to assess diffuse or serial coronary disease. Jeramias A et al. (15) found that in a small percentage of cases, maximal coronary hyperemia requires increased IC adenosine doses. Table 7-4 lists the hyperemic agents that can be used in coronary flow studies.


FIGURE 7-6 A: Spectral Doppler flow-velocity signals are displayed as baseline phasic (top left) and peak hyperemic velocity (top right). The trend of average peak velocity is shown at bottom panel. The double asterisks indicates time of intracoronary bolus adenosine injection. Scale is cm/sec and timeline is 90 seconds. B: Display of combined Spectral Doppler flowvelocity signals (lower signal outlined in blue) with aortic and distal coronary pressures (top red and yellow tracings) in a continuous beat-to-beat image. The phasic Doppler flow signal demonstrates a normal hyperemic velocity with a smaller systolic component and a larger diastolic component. The maximal velocity is 125 cm/second. The average peak velocity at baseline was 38 cm/sec and peak velocity 87 cm/sec for coronary flow reserve of 2.3. The FFR was 0.82 and hyperemic stenosis resistance was 0.22. Hyperemic myocardial resistance was 1.0 unit. Pa, aortic pressure (110 mm Hg) and Pd, distal pressure (91 mm Hg) were used to calculate FFR.

Other agents that produce maximal coronary hyperemia include ATP, nitroprusside, and dobutamine. IC nitroprusside ??????(50, 100 mg bolus) produces nearly identical results to IV and IC adenosine (16).

Controversy exists regarding whether the concentration of caffeine after a cup of coffee interferes with FFR measurement. A review of the literature (17) suggests that a serum caffeine level of 3 to 4 mg/L at the time of an adenosine-hyperemia study does not affect perfusion stress imaging studies to detect coronary artery
disease (CAD). These same considerations hold true for patients undergoing cardiac catheterization and intravenous adenosineinduced hyperemia.


TABLE 7-4 Pharmacologic Agents Used for Hyperemic Lesion Assessment


Only gold members can continue reading. Log In or Register to continue

Stay updated, free articles. Join our Telegram channel

May 28, 2016 | Posted by in CARDIOLOGY | Comments Off on Coronary Blood Flow

Full access? Get Clinical Tree

Get Clinical Tree app for offline access


Adenosine


Adenosine


Papaverine


NTP


Route


IV


IC


IC


IC


Dosage


140 µg/kg/min


30-60 µg LCA


15 mg LCA


50-100 µg


20-30 µg RCA


10 mg RCA


T ½


1-2 minutes


30-60 seconds


2 minutes


1-2 minutes


Time to max


≤1-2 minutes


5-10 seconds


30-60 seconds


10-20 seconds


Advantage


Gold standard


Short action


Short action


Short action


Disadvantage


↓BP by 10%-15%, chest burning


AV delay, ↓BP