Serial myocardial perfusion imaging (MPI) is valuable for assessing coronary disease progression and treatment efficacy. Previous serial MPI studies emphasized severe perfusion defects, with no attention given to milder perfusion defects. Thus, this study sought to compare and identify predictors of change in severe versus mild perfusion defect size in patients who underwent serial positron emission tomography (PET) MPI. Serial PET MPI was performed in 551 patients with an average of 1.9 years between scans. Severe and mild perfusion defect size at both PETs were derived from automated software as percentage of left ventricular mass with relative tracer activity <60% (severe) and between 61% and 80% of maximum tracer activity (mild), respectively. Predictors of change in severe and mild perfusion defect size between PETs were determined. Overall, severe perfusion defect sizes improved (p <0.001) and mild perfusion defect sizes worsened (p <0.001) between PETs with individual changes being highly variable. In individuals with negligible changes in severe defect size (±2%), changes in mild defect size ranged from a worsening of 47% to an improvement of 48% of left ventricular mass. The strongest predictors of change in severe defect size were indicators of obstructive coronary disease including interval myocardial infarction, interval revascularization, history of myocardial infarction, and history of bypass surgery. Strong predictors of change in mild defect size were cardiac risk factors including male gender, body mass index, diabetes, and smoking. In conclusion, changes in mild perfusion defects may provide valuable secondary information for evaluating treatment efficacy in patients who underwent serial MPI.
Serial myocardial perfusion imaging (MPI) reveals change in the size and severity of myocardial perfusion defects as a means of assessing coronary arterial disease (CAD) progression, evaluating treatment efficacy, and reappraising cardiac event risk in individuals being evaluated for CAD. A principal goal of MPI is to determine the presence and severity of significant, flow-limiting coronary stenosis that may warrant invasive diagnostic arteriography and possible mechanical revascularization. Accordingly, previous studies evaluating serial MPI findings tended to focus on severe, focal myocardial perfusion defects indicative of regionally obstructive CAD. However, powerful imaging techniques, such as PET MPI, are capable of quantifying milder, more global perfusion deficits that may be prognostically relevant and manifest on PET images as more subtle regional radiotracer heterogeneity only quantifiable with computerized, automated methods. Assessment of milder perfusion defects with MPI could be particularly valuable as up to 75% of MPI studies are classified as normal by traditional MPI evaluation focused on severe defects. Importantly, milder perfusion defects measurable by PET MPI may afford unique insight into myocardial perfusion status over and above severe regional defects and, thus, provide important secondary information for tracking therapeutic effectiveness and assessing risk. Accordingly, the present study sought first to describe simultaneous changes in severe and mild perfusion defects in a group of patients who underwent clinically indicated serial PET and, second, to compare and contrast predictors of change in severe versus mild perfusion defect size on serial PET as a means to better understand the unique pathology defined by each defect type.
Methods
The study population consists of 551 individuals initially with known or suspected CAD who underwent clinically indicated serial rubidium-82 (Rb-82) PET MPI. The parent study was approved by the Institutional Review Board of the University at Buffalo that granted a waiver of patient consent. The PET MPI patient population and protocol in place at the study institution have been described. Briefly, attenuation-corrected PET MPI is performed at rest and with dipyridamole stress, and images are constructed as described previously. PET images display the regional distribution of radiotracer activity (perfusion) across the left ventricular (LV) circumference. Visual interpretation of PET images is complemented by computer software permitting automated, objective quantitation of perfusion defect sizes at multiple severity thresholds. The 2% of image pixels with maximum radiotracer activity serve as the reference region, and relative activity in the remaining pixels is normalized to this maximum. Thus, the size of perfusion defects is defined by the percentage of pixels with relative activity below some severity threshold (e.g., <60%).
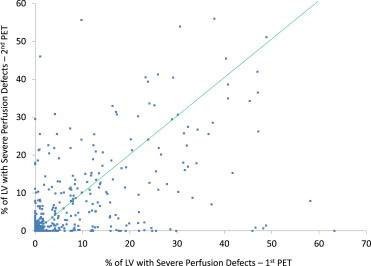
The present study incorporates 2 perfusion defect severity thresholds for defining the size of severe and mild perfusion defects during stress PET. The size of severe perfusion defects is defined as the percentage of LV mass with relative tracer activity (perfusion) <60% of maximum. The 60% threshold is approximately 7 SDs below the mean relative perfusion value observed in normal volunteers. The size of mild perfusion defects is defined as the percentage of LV mass with relative tracer activity (perfusion) between 61% and 80% of maximum (1.5 to 7 SD below the mean value observed in normal volunteers). Each metric was calculated on a 0% to 100% scale by automated software at both PETs, and changes are defined by absolute differences between PETs. Severe perfusion defects as observed during stress PET typically manifest as localized, discrete perfusion abnormalities attributable to significant flow-limiting stenosis, scar from previous myocardial infarction (MI), and/or hibernating myocardium. In a group of normal patients without known cardiac risk factors, the mean (±SD) size of severe perfusion defects was 0.9% (±1.2) of the LV, whereas in the present study population the mean was 6.2% (±10.7) at the first PET. Mild perfusion defects observed during stress PET typically denote the integrated and cumulative effects of milder coronary aberrations on myocardial perfusion. In normal patients, the mean (±SD) size of mild perfusion defects was 28.0% (±11.6), whereas in the present study population the mean was 46.8% (±15.2) at the first PET. For both metrics, higher values indicate reduced myocardial perfusion. Notably, the severe perfusion defect metric incorporated here is analogous to perfusion defect sizes and normalized summed stress scores as measured in previous studies. Three scatter plots were created to describe changes in severe and mild defects across the 2 PETs: (1) severe defect size at first PET versus severe defect size at second PET, (2) mild defect size at first PET versus mild defect size at second PET, and (3) change in severe defect size between PETs versus change in mild defect size between PETs.
Patient characteristics recorded at both PETs include demographics, physical examination findings, cardiac risk factors, medical history, medications, lipid profiles, indications for PET MPI, and PET MPI procedural characteristics. Patient characteristics are reported across respective PET scans (first vs second) as percentages for categorical variables and means with SDs for continuous variables. Differences in patient characteristics between PETs were evaluated for significance using statistical tests for matched data, either paired t tests for continuous variables or McNemar’s test for categorical variables.
Linear regression models for continuously distributed outcomes were developed to evaluate predictors of change in severe and mild perfusion defect size, respectively. Change in severe defect size had an approximate normal distribution despite the extreme right-skewed nature of severe defect size at a single PET. A forward stepwise variable selection procedure was incorporated to determine the strongest predictors of the respective perfusion change parameter. The collection of candidate predictors considered in these models included all baseline demographics, physical examination findings, cardiac risk factors, medical history, medications, lipid values, and PET MPI procedural characteristics as listed in Table 1 . Additional variables considered in the variable selection process included between-PET changes in risk factors, such as body mass index, blood pressure, and lipids; between-PET initiation of medications; and interval events and procedures, such as MI and coronary revascularization. In the final reported models, positive regression coefficients identify characteristics independently associated with a worsening of perfusion defect size between PETs, and negative regression coefficients identify characteristics independently associated with an improvement of perfusion defect size between PETs. A p-value threshold of 0.10 was employed for inclusion in the final models to avoid excluding borderline predictors. All models were adjusted for baseline perfusion defect size and number of days between PETs.
| Variable | 1st PET (n = 551) | 2nd PET (n = 551) | p-Value |
|---|---|---|---|
| Age (years) | 63.6 ± 12 | 65.5 ± 12 | — |
| Men | 62% | 62% | — |
| Body mass index (kg/m 2 ) | 30 ± 6 | 30 ± 6 | 0.27 |
| Heart rate (bpm) | 65 ± 11 | 64 ± 11 | <0.01 |
| Systolic blood pressure (mm Hg) | 133 ± 21 | 125 ± 19 | <0.001 |
| Diastolic blood pressure (mm Hg) | 73 ± 11 | 69 ± 10 | <0.001 |
| Abnormal resting ECG | 17% | 22% | <0.001 |
| Hypertension | 64% | 67% | 0.04 |
| Dyslipidemia | 70% | 86% | <0.001 |
| Diabetes mellitus | 24% | 25% | 0.48 |
| Smoker | |||
| Current | 12% | 10% | 0.16 |
| Former | 53% | 55% | |
| Never | 35% | 35% | |
| Parental history of CAD | 49% | 54% | <0.01 |
| Myocardial infarction | 23% | 26% | 0.01 |
| Coronary bypass surgery | 22% | 25% | <0.001 |
| Percutaneous coronary intervention | 18% | 25% | <0.001 |
| Cerebrovascular disease | 9% | 10% | 0.22 |
| Peripheral vascular disease | 12% | 13% | 0.47 |
| Arrhythmia | 31% | 39% | <0.001 |
| Cancer | 10% | 10% | 0.56 |
| Kidney disease | 7% | 7% | 0.41 |
| Lung disease | 12% | 13% | 0.45 |
| Total cholesterol (mg/dl) | 182 ± 45 | 146 ± 36 | <0.001 |
| LDL cholesterol (mg/dl) | 107 ± 36 | 76 ± 28 | <0.001 |
| HDL cholesterol (mg/dl) | 47 ± 13 | 53 ± 15 | <0.001 |
| Triglycerides (mg/dl) | 140 ± 117 | 85 ± 69 | <0.001 |
| Heart rate at peak stress (bpm) | 86 ± 15 | 84 ± 15 | <0.001 |
| Systolic blood pressure at peak stress (mm Hg) | 129 ± 19 | 120 ± 18 | <0.001 |
| Diastolic blood pressure at peak stress (mm Hg) | 70 ± 11 | 65 ± 11 | <0.001 |
| Statin | 61% | 76% | <0.001 |
| Aspirin | 55% | 66% | <0.001 |
| Nitrate | 26% | 33% | <0.01 |
| Digoxin | 6% | 6% | 0.58 |
| Diuretic | 26% | 32% | <0.001 |
| Beta blocker | 46% | 60% | <0.001 |
| Calcium channel blocker | 25% | 27% | 0.42 |
| ACE inhibitor | 34% | 42% | <0.001 |
| Angiotensin receptor blocker | 9% | 10% | 0.45 |
| Anticoagulant | 8% | 9% | 0.34 |
| Antiplatelet | 12% | 17% | <0.01 |
Results
A total of 551 patients underwent serial Rb-82 PET MPI with an average time interval between PET scans of 1.9 (±1.1) years (interquartile range 1.1 to 2.5 years). The mean age at first PET was 63.6 years, and 62% of the study population were men. A significant uptake of several cardioprotective medications was observed between PETs, including use of statins, aspirin, β blockers, ACE inhibitors, and antiplatelet agents (all p <0.01). Accordingly, systolic blood pressure, diastolic blood pressure, and all lipid parameters improved over time (all p <0.001). Fourteen patients (2.5%) had a new MI between PETs, and 55 (10.0%) had a coronary revascularization procedure between PETs.
The mean (±SD) size of severe perfusion defects at the first and second PETs were 6.2% (±10.7) and 5.2% (±9.7) of the LV, respectively. Thus, overall, there was an average 1.0% (±9.3) improvement in severe perfusion defect size between PETs—an overall change that was small but statistically significant (p = 0.008). Figure 1 shows that changes in severe perfusion defect size had substantial variation, although a strong correlation between severe defect size at the first and second PETs was observed (r = 0.57, p <0.001). The significant predictors of change in severe defect size between PETs are listed in Table 2 . Statistically significant variables are listed by strength of association from smallest to largest p-value. The 4 strongest predictors of change in severe defect size were interval MI, interval revascularization procedures, history of MI at baseline, and history of coronary bypass surgery at baseline ( Table 2 ). None of these variables were significantly associated with change in mild perfusion defect size.