Contemporary real-world data on clinical outcomes after utilization of coronary atherectomy are sparse. The study cohort was derived from Healthcare Cost and Utilization Project Nationwide Inpatient Sample database from year 2012. Percutaneous coronary interventions including atherectomy were identified using appropriate International Classification of Diseases, 9th Revision diagnostic and procedural codes. Two-level hierarchical multivariate mixed models were created. The primary outcome was a composite of in-hospital mortality and periprocedural complications; the secondary outcome was in-hospital mortality. Hospitalization costs were also assessed. A total of 107,131 procedures were identified in 2012. Multivariate analysis revealed that atherectomy utilization was independently predictive of greater primary composite outcome of in-hospital mortality and complications (odds ratio 1.34, 95% confidence interval 1.22 to 1.47, p <0.001) but was not associated with any significant difference in terms of in-hospital mortality alone (odds ratio 1.22, 95% confidence interval 0.99 to 1.52, p 0.063). In the propensity-matched cohort, atherectomy utilization was again associated with a higher rate of complications (12.88% vs 10.99%, p = 0.001), in-hospital mortality + any complication (13.69% vs 11.91%, p = 0.003) with a nonsignificant difference in terms of in-hospital mortality alone (3.45% vs 2.88%, p = 0.063) and higher hospitalization costs ($25,341 ± 353 vs $21,984 ± 87, p <0.001). Atherectomy utilization during percutaneous coronary intervention is associated with a higher rate of postprocedural complications without any significant impact on in-hospital mortality.
Rotational atherectomy was first introduced by David Auth at University of Washington in 1981 and first used in a human case by Fourrier et al in 1988. Several decades and trials later, rotational atherectomy remains an important tool in an interventional cardiologist’s armamentarium to treat heavily calcific and fibrotic coronary lesions and those resistant to balloon dilation alone. Rotational atherectomy initially developed as an adjunct to balloon angioplasty was limited by high rates of restenosis plausibly secondary to vessel wall ablation injury. However, heavily calcified lesions pose problems for stent delivery, apposition, or expansion, thus increasing the risk of stent thrombosis or expansion in the future. Atherectomy can effectively reduce plaque volume in heavily calcified lesions, thereby allowing easier stent delivery. Previous studies evaluating the role of atherectomy in coronary interventions have yielded mixed results. However, most of these studies have had several inherent limitations, and real-world clinical data regarding clinical outcomes of atherectomy in coronary interventions from the contemporary era are sparse. The primary objective of our study was to evaluate the impact of atherectomy on in-hospital outcomes in terms of postprocedural complications and in-hospital mortality after percutaneous coronary interventions (PCIs) from the largest publicly available national database.
Methods
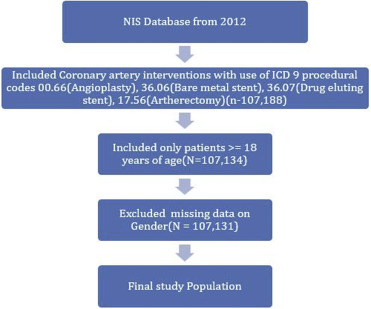
The study cohort was derived from the Nationwide Inpatient Sample (NIS) database from the year 2012, a subset of the Healthcare Cost and Utilization Project sponsored by the Agency for Healthcare Research and Quality. The NIS is the largest publicly available all-payer inpatient care database in the United States, including data on approximately 7 to 8 million discharges per year, and is a stratified 20% sample of discharges from US community hospitals, excluding rehabilitation and long-term acute care hospitals. National estimates are produced using sampling weights provided by the sponsor. The details regarding the NIS data have been previously published.
Ascertainment of all diagnoses and procedures was made using the International Classification of Diseases, 9th Revision, Clinical Modification (ICD-9-CM) codes. PCIs were identified using procedure codes 00.66 (percutaneous transluminal coronary angioplasty), 36.06 (bare-metal stent), and 36.07 (drug-eluting stent). Patients <18 years of age were excluded, and atherectomy was identified using the ICD-9 code 17.55 (transluminal coronary atherectomy) introduced in October 2011. Details of data extraction are included in Figure 1 .
The primary outcome was a composite of in-hospital mortality and postprocedural complications; the secondary outcome was in-hospital mortality alone. Preventable procedural complications were identified by Patient Safety Indicators, version 4.4, March 2012. These have been established by the Agency for Healthcare Research and Quality to monitor preventable adverse events during hospitalization. These indicators are based on ICD-9-CM codes and Medicare Severity Diagnosis-Related Groups, and each Patient Safety Indicator has specific inclusion and exclusion criteria. Other procedure-related complications, which included postprocedural hemorrhage requiring blood transfusion, iatrogenic cardiac complications (including postprocedural myocardial infarction [MI] and postprocedural need for revascularization), pericardial complications, requiring open heart surgery, other iatrogenic respiratory complications (which included ventilator-associated pneumonia, postprocedural aspiration pneumonia, and other respiratory complications not elsewhere classified), postprocedural stroke or transient ischemic attack, and other vascular complications, were identified using ICD-9-CM codes (listed in Supplementary Table 1 ) in any secondary diagnosis field. “Any complications” was defined as occurrence of ≥1 postprocedural complications listed in Supplementary Table 1 . Similar method has been used before.
NIS variables were used to identify patient demographic characteristics including age, gender, and race ( Table 1 ). We defined severity of co-morbid conditions using Deyo’s modification of Charlson Co-morbidity Index (CCI). This index contains 17 co-morbid conditions with differential weights. The score ranges from 0 to 33, with higher scores corresponding to greater burden of co-morbid diseases ( Supplementary Table 2 ). Annual hospital volume was determined using the unique hospital identification number to calculate the total number of procedures performed by a particular institution in the given year. The Healthcare Cost and Utilization Project NIS database contains data on total charges that hospitals billed for services. These data were merged with the Cost-to-Charge Ratio files to get actual cost per hospital visit.
| Baseline | Atherectomy | Overall | P-value | |
|---|---|---|---|---|
| No | Yes | |||
| Overall(unweighted) | 103,759(96.85) | 3,372(3.15) | 107,131 | |
| Overall(weighted) | 518,795(96.85) | 16,860(3.15) | 535,655 | |
| Overall | ||||
| Age(Years) | 64.6 ± 0.04 | 65.5 ± 0.22 | 64.6 ± 0.04 | <0.001 |
| 18-34 | 0.67% | 0.68% | 0.67% | <0.001 |
| 35-49 | 11.13% | 10.59% | 11.11% | |
| 50-64 | 37.7% | 35.35% | 37.62% | |
| 65-79 | 37.1% | 37.01% | 37.1% | |
| >=80 | 13.41% | 16.37% | 13.5% | |
| Gender | <0.001 | |||
| Male | 66.68% | 70.26% | 66.79% | |
| Female | 33.32% | 29.74% | 33.21% | |
| Race | 0.350 | |||
| White | 71.95% | 71.65% | 71.94% | |
| Non-white | 21.75% | 22.18% | 21.77% | |
| Missing | 6.3% | 6.17% | 6.3% | |
| Charlson/Deyo comorbidity index | <0.001 | |||
| 0 | 15.09% | 10.56% | 14.95% | |
| 1 | 37.55% | 37.6% | 37.55% | |
| >=2 | 47.36% | 51.84% | 47.5% | |
| Comorbidities | ||||
| Obesity ∗ | 15.99% | 15.33% | 15.97% | 0.020 |
| Hypertension by history | 74.03% | 71.89% | 73.97% | <0.001 |
| Diabetes by history | 37% | 35.71% | 36.96% | 0.001 |
| Congestive heart failure by history | 1.29% | 1.22% | 1.29% | 0.420 |
| Chronic pulmonary disease by history | 17.57% | 16.9% | 17.55% | 0.030 |
| Renal failure | 23.18% | 25.47% | 23.25% | <0.001 |
| Neurological disorder or paralysis | 4.4% | 4.86% | 4.42% | 0.004 |
| Anemia or coagulopathy | 11.31% | 13.29% | 11.37% | <0.001 |
| Hematological or oncological malignancy | 1.72% | 1.54% | 1.71% | 0.080 |
| Rheumatoid arthritis or other collagen vascular disease | 2.14% | 2.43% | 2.15% | 0.010 |
| Depression, psychosis or substance abuse | 10.24% | 9.19% | 10.21% | |
| Primary Payer | 0.001 | |||
| Medicare/Medicaid | 59.38% | 60.05% | 59.4% | |
| Private including HMO | 30.01% | 30.31% | 30.02% | |
| Self pay/no charge/other | 10.39% | 9.46% | 10.36% | |
| Hospital characteristics | ||||
| Hospital bed size | <0.001 | |||
| Small | 8.72% | 7.53% | 8.68% | |
| Medium | 23.62% | 23.25% | 23.61% | |
| Large | 67.66% | 69.22% | 67.71% | |
| Location status of Hospital | <0.001 | |||
| Rural | 6.56% | 3.68% | 6.47% | |
| Urban nonteaching | 37.73% | 37.81% | 37.73% | |
| Urban teaching | 55.71% | 58.51% | 55.8% | |
| Hospital Region | <0.001 | |||
| Northeast | 17.32% | 18.51% | 17.36% | |
| Midwest or North Central | 24.27% | 21.56% | 24.18% | |
| South | 40.4% | 35.02% | 40.23% | |
| West | 16.43% | 23.55% | 16.65% | |
| Admission types | <0.001 | |||
| Non-elective | 81.58% | 79.72% | 81.53% | |
| Elective admission | 18.04% | 19.99% | 18.1% | |
| Admission day | 0.001 | |||
| Weekdays | 80.06% | 81.14% | 80.09% | |
| Weekend | 19.94% | 18.86% | 19.91% | |
| Disposition | <0.001 | |||
| Home | 91.53% | 88.61% | 91.44% | |
| Facility | 6% | 7.74% | 6.06% | |
| Death | 2.07%% | 3.32% | 2.11% | <0.001 |
| Cost | 21224 ± 52 | 25272 ± 338 | 21348 ± 52 | <0.001 |
| Acute myocardial infarction | 24.82% | 39.89% | 25.3% | <0.001 |
| Shock | 4.35% | 7.53% | 4.45% | <0.001 |
| Fractional flow reserve | 2% | 1.99% | 2% | 0.930 |
| Intravascular ultrasound | 6.74% | 10.41% | 6.86% | <0.001 |
| Bare metal stent | 21.88% | 21.83% | 21.88% | 0.860 |
| Drug eluting stent | 71.97% | 67.05% | 71.82% | <0.001 |
| Stents and vessels | <0.001 | |||
| Single vessel and single stents | 60.35% | 49.2% | 60.03% | |
| Single vessel and multiple stents | 18.95% | 25% | 19.12% | |
| Bifurcation PCI | 2.95% | 5.09% | 3.01% | |
| Multivessel PCI | 17.75% | 20.66% | 17.84% | |
| Intra-aortic balloon pump | 3.61% | 7.95% | 3.74% | <0.001 |
| Percutaneous ventricular assist devices | 0.5% | 1.72% | 0.53% | <0.001 |
| Cardiopulmonary bypass | 3.61% | 7.95% | 3.74% | <0.001 |
| Extracorporeal membrane oxygenation | 0.01% | 0.06% | 0.02% | <0.001 |
∗ Obesity defined as https://www.hcup-us.ahrq.gov/db/vars/cm_obese/nisnote.jsp#top .
Stata IC 11.0 (StataCorp, College Station, Texas) and SAS 9.4 (SAS Institute Inc., Cary, North Carolina) were used for analyses. Weighted values of patient-level observations were generated to produce a nationally representative estimate of the entire US population of hospitalized patients. Differences between categorical variables were tested using the chi-square test, and differences between continuous variables were tested using the Student t test. p Value <0.05 was considered significant. Hierarchical mixed-effects logistic regression models were used for categorical dependent variables such as primary and secondary outcomes, and hierarchical mixed-effects linear regression models were used for continuous dependent variables such as cost of care. Two-level hierarchical models were created with the unique hospital identification number incorporated as random effects within the model. In all multivariate models, we included hospital-level variables such as teaching versus nonteaching hospital and hospital bed size and patient-level variables such as age, gender, acute myocardial infarction (AMI), shock, Deyo modification of CCI, primary payer (with Medicare/Medicaid considered as referent), hospital region (northeast region as referent), hospital teaching (nonteaching referent), hospital PCI volume quartile, and intervention type (no atherectomy group as referent).
To control for imbalances in baseline characteristics between the 2 study groups (atherectomy use and no atherectomy use) that might influence treatment outcome, we used propensity scoring method to establish matched cohorts. A propensity score, which was assigned to each hospitalization, was based on multivariate logistic regression model that examined the impact of 11 variables (patient demographics, co-morbidities, and hospital characteristics) on the likelihood of treatment assignment. Patients with similar propensity score in 2 treatment groups were matched using a 1 to 15 scheme without replacement using greedy methods.
Furthermore, we investigated the institutional variation in atherectomy utilization by creating 3 separate hierarchical logistic regression models: model 1: unconditional model with only hospital ID intercept; model 2: model 1 + patient-level variables including age, gender, AMI, shock, Charlson score, and payment; and model 3: model 2 + hospital-level variables such as hospital region, teaching status, and hospital PCI volume quartile. For each model, between-hospital variance was calculated along with C statistic to account for model discrimination. Interclass correlation coefficient was calculated to determine the proportion of variance attributable to between-hospital variance. The median odds ratio (OR) was also calculated to quantify the extent to which the variation in utilization of atherectomy was secondary to clustering of patients within hospitals.
Results
Table 1 lists the baseline characteristics of the 2 study cohorts (atherectomy vs no atherectomy group). In 2012, a total of 107,131 PCI procedures were identified (3,372 underwent atherectomy and 103,759 had no atherectomy). Atherectomy group had 70.26% males, 71.65% were whites, and 51.84% of the patients had a CCI score ≥2 compared with no atherectomy group with 66.68% males (p <0.001), 71.95% whites (p = 0.358), and CCI score of ≥2 in 47.36% (p <0.001). Hypertension (atherectomy vs no atherectomy) (71.89% vs 74.03%, p <0.001), diabetes (35.71% vs 37%, p = 0.001), and renal failure (25.47% vs 23.18%, p <0.001) were the most common co-morbidities. Medicare/Medicaid was the primary payer (60.05% vs 59.38%, p 0.001). A majority of procedures were done in large (69.22% vs 67.66%, p <0.001) and urban teaching (58.51% vs 55.71%, p <0.001) hospitals. There was greater utilization of intra-aortic balloon pump (7.95% vs 3.61%, p <0.001), extracorporeal membrane oxygenation (0.06% vs 0.01%, p <0.001), percutaneous ventricular assist devices (including Impella; Abiomed, Danvers, MA and TandemHeart; CardiacAssist, Inc, Pittsburg, PA) (1.72% vs 0.5%, p <0.001), and cardiopulmonary bypass (7.95% vs 3.61%, p <0.001) in the atherectomy cohort. Furthermore, there was a higher rate of multivessel (20.66% vs 17.75%, p <0.001) and bifurcation (5.09% vs 2.95%, p <0.001) PCI in the atherectomy cohort.
The overall rate of periprocedural complications ( Table 2 ) was 9.16%. Atherectomy use was associated with a higher rate of complications (12.66%) compared with the cohort without atherectomy use (9.05%; p <0.001). The composite outcome of in-hospital mortality and complications was also greater in the atherectomy group (13.5% vs 9.73%, p <0.001). Cardiac (atherectomy vs no atherectomy) complications (4.06% vs 2.07%, p <0.001) including iatrogenic cardiac (3.56% vs 1.83%, p <0.001) and pericardial complications (0.3% vs 0.13%) were greater in the atherectomy group. The overall rate of vascular complications was 1.08% (1.57% in the atherectomy group vs 1.06% in the no atherectomy group, p <0.001; Figure 2 ). Table 2 provides the details of respiratory, renal, and infectious complication rates.
| Atherectomy | Overall | P-value | ||
|---|---|---|---|---|
| No | Yes | |||
| Overall(unweighted) | 103759(96.85) | 3372(3.15) | 107131 | |
| Overall(weighted) | 518795(96.85) | 16860(3.15) | 535655 | |
| Any complication ∗ | 9.05% | 12.66% | 9.16% | <0.001 |
| Any complication or death | 9.73% | 13.5% | 9.85% | <0.001 |
| Any vascular complication | 1.06% | 1.57% | 1.08% | <0.001 |
| Postoperative hemorrhage requiring transfusion | 0.4% | 0.3% | 0.4% | <0.001 |
| Vascular injury | 0.7% | 1.28% | 0.71% | <0.001 |
| Cardiac complications | 2.07% | 4.06% | 2.14% | <0.001 |
| Iatrogenic cardiac complications | 1.83% | 3.56% | 1.88% | <0.001 |
| Pericardial complications | 0.13% | 0.3% | 0.13% | <0.001 |
| Open heart surgery | 0.16% | 0.24% | 0.16% | 0.01 |
| Respiratory complications (Postoperative respiratory failure) | 5.46% | 7.12% | 5.51% | <0.001 |
| Postoperative stroke/TIA | 0.14% | 0.12% | 0.14% | 0.507 |
| Acute renal failure requiring dialysis | 0.18% | 0.24% | 0.18% | 0.107 |
| Postoperative DVT/PE | 0.52% | 0.71% | 0.53% | 0.001 |
| Postoperative infectious complications | 1.44% | 1.66% | 1.45% | 0.019 |
∗ Any complication is defined as any periprocedural complication listed in Supplementary Table 1 .
Table 3 lists the baseline characteristics in a propensity-matched cohort. Patient demographics, co-morbidities (CCI score), and admission characteristics were similar among the 2 groups. In the propensity-matched cohort, atherectomy utilization was again associated with a higher rate of complications (12.88% vs 10.99%, p = 0.001), in-hospital mortality + any complication (13.69% vs 11.91%, p = 0.003) with a nonsignificant difference in terms of in-hospital mortality alone (3.45% vs 2.88%, p = 0.063) and vascular complication rate (1.6% vs 1.21%, p = 0.051). In the propensity-matched cohort, atherectomy use was associated with higher costs ($25,341 ± 353 vs $21,984 ± 87, p <0.001).
| Atherectomy | P-value | ||
|---|---|---|---|
| No | Yes | ||
| Overall | 47880(93.75) | 3192(6.25) | |
| Age | 65.2±0.1 | 65.1±0.1 | 0.780 |
| Female | 29.59% | 29.79% | 0.810 |
| Acute Myocardial Infarction | 38.6% | 39.57% | 0.280 |
| Shock | 6.41% | 7.46% | 0.020 |
| Charlson/Deyo comorbidity index | 0.650 | ||
| 0 | 10.12% | 10.62% | |
| 1 | 37.54% | 37.16% | |
| >=2 | 52.35% | 52.22% | |
| Primary Payer | 0.040 | ||
| Medicare / Medicaid | 62.46% | 60.49% | |
| Private including HMO | 28.2% | 30.29% | |
| Self pay/no charge/other | 9.34% | 9.21% | |
| Admission types | 0.070 | ||
| Elective admission | 78.32% | 79.67% | |
| Non-elective admission | 21.68% | 20.33% | |
| Admission day | 0.600 | ||
| Weekdays | 81.64% | 81.27% | |
| Weekend | 18.36% | 18.73% | |
| Hospital Region | <0.001 | ||
| Northeast | 17.03% | 19.24% | |
| Midwest or North Central | 22.74% | 21.21% | |
| South | 40.95% | 34.93% | |
| West | 19.28% | 24.62% | |
| Hospital Teaching status | 0.562 | ||
| Non teaching | 38.64% | 39.16% | |
| Teaching | 61.36% | 60.84% | |
| Hospital PCI volume quartile | 0.284 | ||
| 1st(<55) | 20.4% | 20.61% | |
| 2nd(55-91) | 23.38% | 24.06% | |
| 3rd(92-167) | 27.44% | 28.13% | |
| 4th(>167) | 28.78% | 27.19% | |
| c-index | 0.62 | ||
| Death | 2.88% | 3.45% | 0.063 |
| Death/any complication | 11.91% | 13.69% | 0.003 |
| Any complications | 10.99% | 12.88% | 0.001 |
| Any vascular complication | 1.21% | 1.6% | 0.050 |
| Cost of care | 21984±87 | 25341±353 | <0.001 |
Stay updated, free articles. Join our Telegram channel

Full access? Get Clinical Tree


