Agent
Company
Gas
Shell
Approval
First generation, nontranspulmonary vascular
Free microbubbles
Schering
Air
None
Europe
Echovist (SHU 454)
Air
Galactose
Second–generation, transpulmonary vascular, short half–life (<5 min)
Albunex
Molecular biosystems
Air
Albumin
United States
Levovist (SHU 508 A)
Schering
Air
Palmitic acid
Europe, Japan
Third–generation transpulmonary vascular longer half life (>5 min)
Aerosomes (definity MRX115, DMP115)
Bristol-Meyers-Squibb
Perfluoropropane
Phospholipid
United States
Echogen (QW3600)
SonoGen
Dodecafluroropentane
Surfactant
a
Optison (FSO 69)
Amersham
Octafluoropropane
Albumin
United States
Sono Vue (BR1)
Bracco
Sulfur hexafluoride
Phospholipid
Europe
Imaivst (AF0150)
Alliance
Perfluorohexane
Surfactant
United States
Transpulmonary with organ–specific phase
Levovist (SHU 508A)
Schering
Air
Palmitic acid
Europe, Japan
Sonavist (SHU 563A)
Schering
Air
Cyanoacrylate
b
Sonazoid (NC100100)
Amersham
Perfluorocarbon
Surfactant
a
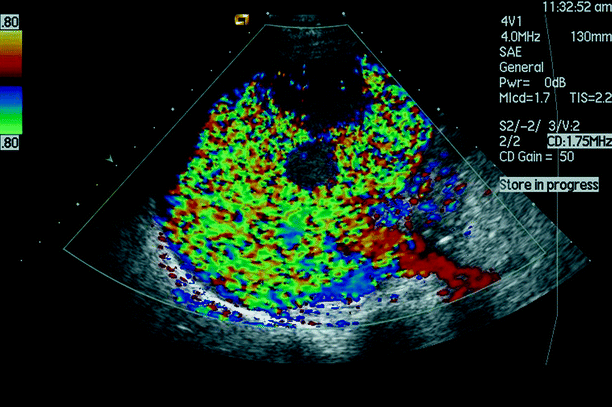
Fig. 55.1
Imaging 3 min after Levovist injection improves the delineation of tumor metastases (Reprinted from Harvey et al. [12]. With permission from Elsevier)
Mechanics of Ultrasonographic Contrast
Microbubble behavior is influenced by the local acoustic power [20], which depends on the output power of the ultrasound system, the transmit frequency, and the attenuation of the ultrasound beam with depth. The mechanical index (MI) reflects output power, and therefore correlates with the local acoustic power. As mentioned previously, each contrast agent behaves uniquely at a given MI, and consequently each agent will have its own optimal imaging sequence.
Low Acoustic Power (MI < 0.1)
At low MI, symmetrical oscillations occur and the frequency of the scattered signals is the same as the transmitted pulse. Microbubbles resonate equally and symmetrically (linear response) with the high and low pressures generated by the incident ultrasound wave with minimal destruction. They act as very efficient signal scatterers, which is attributed to the difference in their compressibility and density compared to the surrounding tissues (Fig. 55.2). Scattering efficiency increases as a function of microbubble radius to the sixth power, and therefore larger bubbles display higher backscatter coefficients [8]. Furthermore, increasing shell stiffness or gas density in turn decreases the microbubble response. Under low MI imaging, the intensity of the scattered signal is linearly related to that of the incident ultrasound beam [12]. Low MI is useful in conventional Doppler applications and real-time contrast imaging.
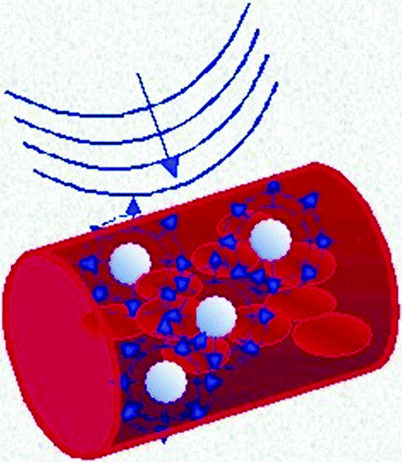

Fig. 55.2
Resonance of microbubbles (Image courtesy of Dr. E. Stride, University College London, UK)
Intermediate Acoustic Power (0.1 < MI < 0.5)
The amplitude of the microbubble oscillations in an ultrasound field increases as the MI is increased. As the amplitude increases, the microbubble oscillations become asynchronous with the ultrasound wave (Fig. 55.3). By manipulating the local acoustic power, the microbubbles begin to echo a harmonic response at frequencies that differ from that of the incident wave (fundamental frequency). The highest intensity response is that of the second harmonic response, which is found at twice the fundamental frequency. Those responses found at higher frequencies are called higher harmonics. Specific types of harmonics called ultraharmonics can be obtained at specific frequencies such as those at 1.5 or 3.5 times the fundamental frequency [8]. Intermediate MI imaging possesses two main advantages. First, the technique enables avoidance of microbubble destruction while eliciting a good harmonic contrast signal. Second, the harmonics elicited from the surrounding tissues are reduced. As the advantage of contrast agents is their harmonic echo, any tissue harmonics become the background “noise.” Tissue is less compressible and denser than the microbubbles, therefore requiring a higher MI for a harmonic response. Intermediate MI scanning allows for a higher contrast-to-tissue ratio compared to a high MI by limiting the tissue harmonic response, and thus eases the removal of the background “noise” from the contrast signal [20].
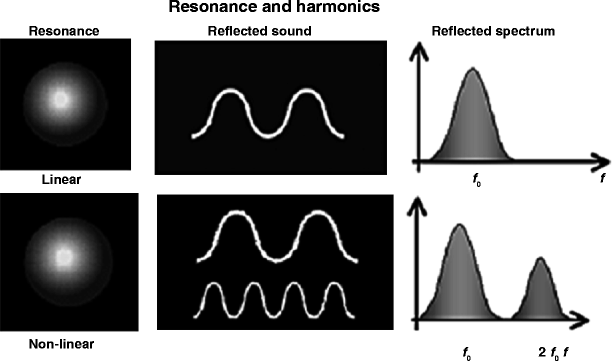

Fig. 55.3
Nonlinear microbubbles return not only the fundamental (transmitted frequency) but also a second harmonic frequency that is at twice the transmitted frequency (Image courtesy of Dr. David Adams)
High Acoustic Power (MI > 0.5)
The destruction of microbubbles occurs at higher acoustic powers. The encapsulating shell is broken and the gas diffuses into the surrounding fluid. The rupture of the microbubble causes an intense echo, very rich in nonlinear (harmonic) components (Figs. 55.4 and 55.5). Although the destruction of contrast agents is often viewed as a limitation, it allows for improved sensitivity in microbubble detection. When color and power Doppler are used, the change in the echo of two consecutive pulses is seen as a particular color pixel. These color signals thus correlate with the distribution of the microbubbles with little affect from blood flow characteristics [8].
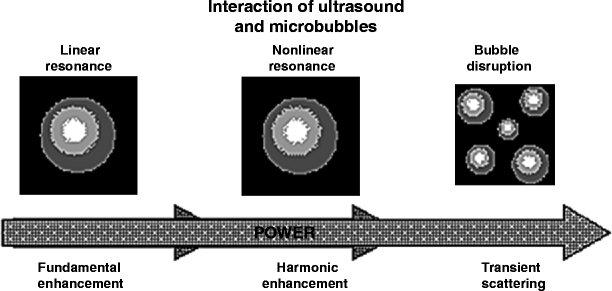
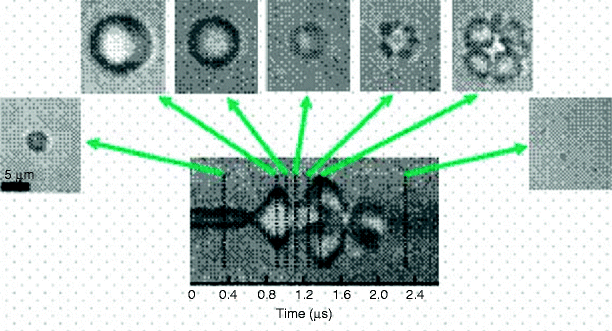

Fig. 55.4
As acoustic power is increased, microbubbles move from a linear response to a nonlinear, harmonics-producing response. At maximum power, destruction of the microbubbles occurs (Image courtesy of Dr. David Adams)

Fig. 55.5
Electron microscopy image of a microbubble responding to increasing ultrasound MIs
Microbubble Technology
Technological advances in microbubble engineering have focused on the optimization of tissue-specific binding of microbubbles by manipulation of the components of the encapsulating shell. One such strategy exploits the disease-related upregulation of surface receptors in activated leukocytes that bind nonspecifically to either albumin or lipid in the microbubble shell [21]. Linder et al. studied the binding of albumin and lipid shells to activated leukocytes after reperfusion injury and exposure to proinflammatory cytokines. Albumin binds to the β2-integrin Mac-1 on the activated leukocytes, which in turn binds to intercellular adhesion molecule (ICAM)-1 expressed on endothelial cells in areas of inflammation. Lipids are found to undergo opsonization by the complement system and bind via a complement receptor to activated leukocytes. By adding phosphatidylserine to the lipid shell, there is a sixfold increase in the affinity of the microbubble to the activated leukocytes due to increased complement attachment to the lipid shell [21, 22]. Inflammation-specific binding of microbubbles can augment the visualization of inflammatory atherosclerotic plaques. Since the amount of microbubbles bound correlates with the amount of inflammation, contrast-enhanced ultrasound (CEUS) will be able to determine the inflammatory phenotype of plaques, thus identifying those plaques with increased vulnerability to thrombosis. Another strategy to enhance the tissue-specific retention of microbubbles is the conjugation of ligands or antibodies that recognize specific antigens or receptors on a specific tissue type (Fig. 55.6). One example is the attachment of an oligopeptide to the shell surface that recognizes the glycoprotein IIb/IIIa integrin receptor on activated platelets [24, 25]. This allows the visualization of thrombus by the binding of microbubbles to platelets, as well as a means for clot lysis when the microbubbles are ruptured using an ultrasound beam [26]. A modification of this strategy achieved by adding the attachment of a chemical spacer, such as polyethylene glycol, allows the ligand to be projected further away from the shell surface, thus increasing its affinity for tissue-specific antigens or receptors [27]. In addition to tissue-specific binding, new microbubbles are now being used as a vehicle for drug and gene delivery (Fig. 55.7). Chemotherapeutic and thrombolytic agents and plasmid DNA are encapsulated in an oil emulsion within the microbubble. Once the microbubbles have reached their target tissue, an ultrasound beam with a high MI is used to rupture the bubbles and release the agent. This focal destruction of microbubbles decreases the systemic concentration of an agent, thus improving its therapeutic index and limiting systemic toxicities [28]. Encapsulation of genes also protects naked DNA and vectors from plasma endonucleases and hepatic clearance, which limits their stability [28] (Fig. 55.8). Engineering microbubbles as target-specific therapeutic delivery vehicles will have a wide range of applications in the diagnosis and therapy of numerous medical conditions. Stabilized gas microbubbles can be functionalized with antibodies or peptides to specifically bind receptors overexpressed on vascular endothelial cells, thereby generating sensitive intravascular molecular imaging probes. Moreover, they can also be loaded with drugs and genes and release these payloads upon exposure to destructive ultrasound pulses [29, 30].
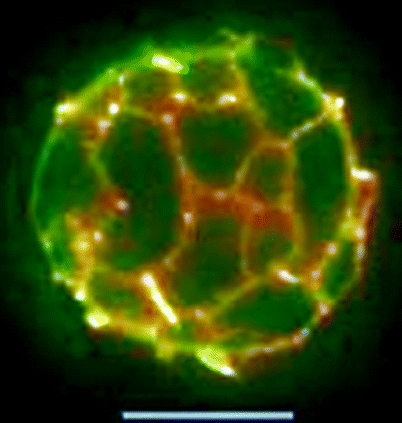
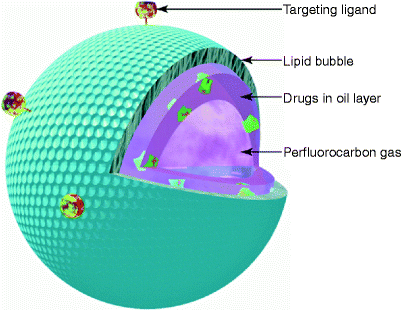
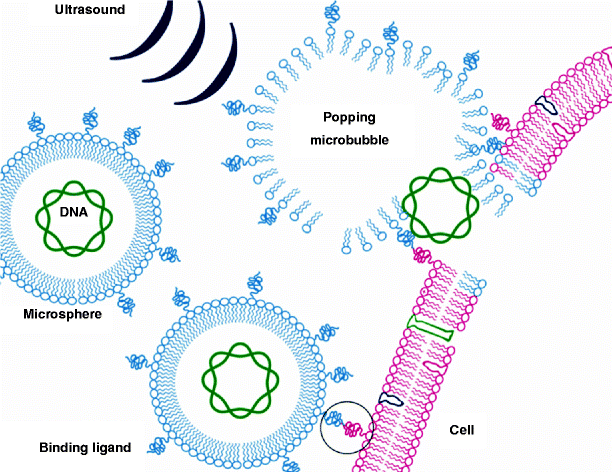

Fig. 55.6
Fluorescent targeted microbubble (Reprinted from Borden et al. [23]. With permission from American Chemical Society)

Fig. 55.7
Schematic of a microbubble with ligands conjugated to its outer shell and encapsulating drugs (Image courtesy of Dr. Evan Unger, University of Arizona. Tucson, AZ)

Fig. 55.8
Schematic of microbubble gene delivery (Image courtesy of Dr. Evan Unger, University of Arizona. Tucson, AZ)
Ultrasound Imaging Techniques
B-Mode and Color Imaging
Contrast agents can be employed when using conventional B-mode imaging and Doppler imaging modalities, including color, power, and spectral imaging. They can be used to opacify fluid-containing cavities such as the bladder, uterus, cardiac chambers (Fig. 55.9), and some large venous structures. Echovist (Schering AG, Berlin, Germany) has been used for sonosalpingography [32] and Levovist (Schering) has been used to detect vesicoureteric reflux [33]. This allows equally sensitive and specific imaging alternatives to conventional radiographs while avoiding ionizing radiation exposure. The limitation of contrast agents with B-mode imaging is that there is no added enhancement in solid structures. Doppler imaging provides excellent detection of microbubbles, but it is limited by color blooming and oversaturation artifacts [8].
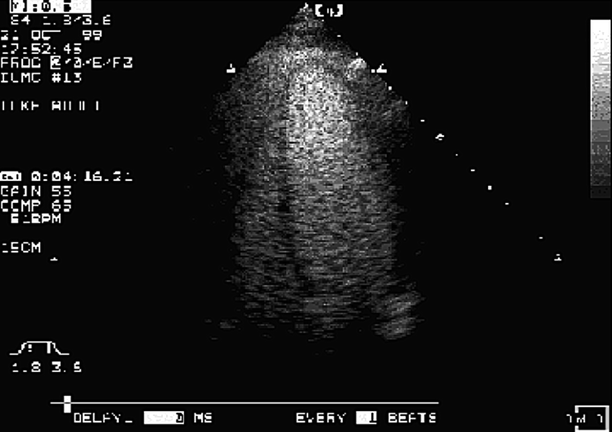

Fig. 55.9
An apical four-chamber view demonstrating optimal left ventricular opacification with microbubbles (Reprinted from McCulloch et al. [31]. With permission from Elsevier)
Stimulated Acoustic Emission
This microbubble destructive modality involves an initial wave of ultrasound at a high MI, which ruptures the microbubbles. Signal responses are recorded before and after this destruction, and the loss of correlation between the two signals maps the distribution of the contrast agent [10]. As mentioned above, some organ-specific contrast agents accumulate only in normal liver tissue. This characteristic has been utilized to detect liver metastases using Levovist. Metastases appear as signal defects [34] (Figs. 55.10 and 55.11).
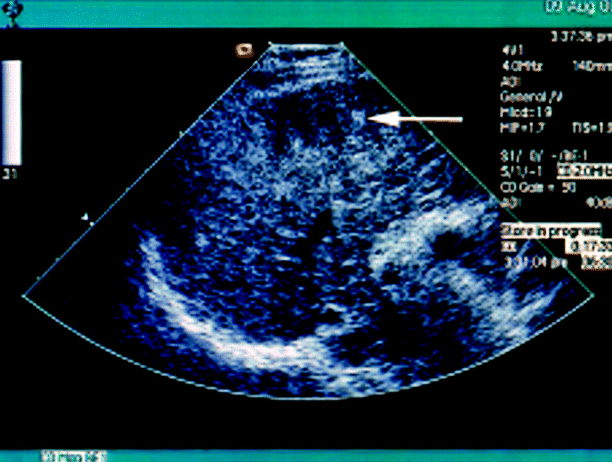
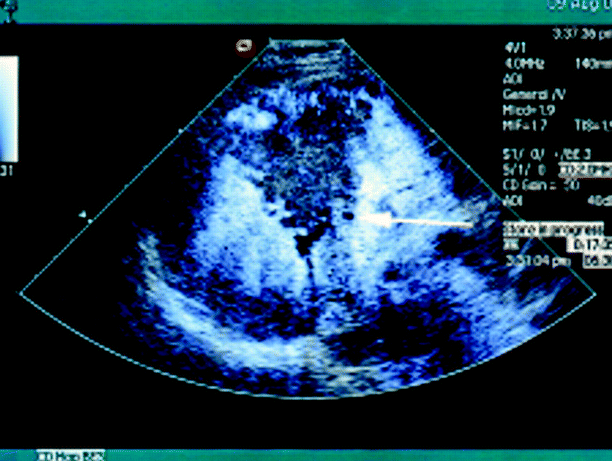

Fig. 55.10
B-mode imaging shows the liver is heterogeneous with an ill-defined lesion (arrow) (Image courtesy of Dr. Evan Unger, University of Arizona. Tucson, AZ)

Fig. 55.11
The presence of liver-specific microbubbles (Levovist) administered 5 min earlier. A defect is clearly seen in the central right lobe of the liver, with several additional defects thought to represent additional satellite foci of hepatocellular carcinoma (arrow) (Image courtesy of Dr. Evan Unger, University of Arizona. Tucson, AZ)
Contrast-Enhanced Dynamic Flow
Conventional Doppler imaging can be used with multiple pulse techniques. After the ideal bandwidth is determined, consecutive pulses are emitted. The flow signals are isolated from static tissue signals by amplifying their intercorrelation at different times, and the static tissue signals are removed. This technique, called advanced dynamic flow, allows better spatial delineation of the microvasculature of superficial structures compared to conventional Doppler modes (Fig. 55.12). However, its sensitivity is limited by the depth of the structure of interest. The utilization of contrast agents with this technique expands its uses to the visualization of deep structures, hypoperfused structures, and even real-time perfusion imaging using lower MIs to preserve microbubbles [8].
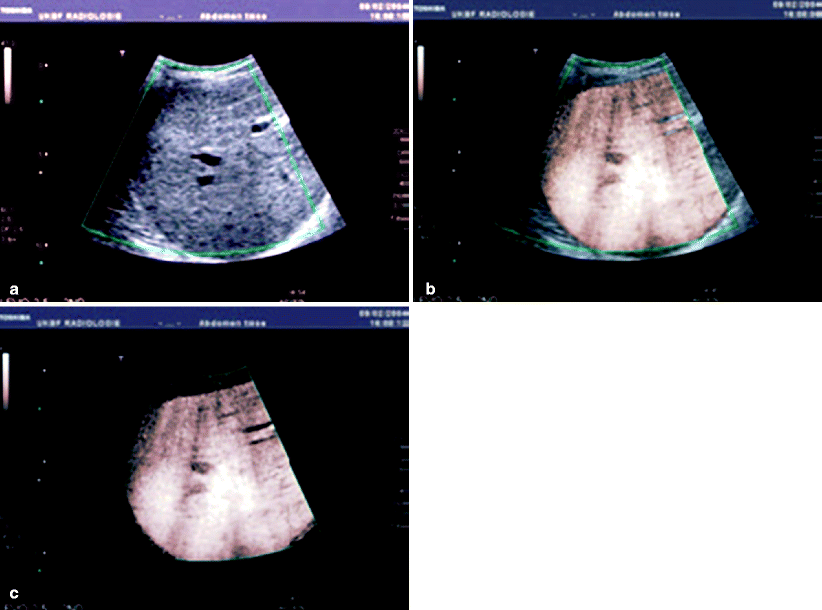

Fig. 55.12
Normal liver scanned at high MI using advanced dynamic flow in the liver-specific late phase 4:50 min post-Levovist. Advanced dynamic flow can be displayed (a) as conventional B-mode only, (b) as a combination of B-mode and colorized contrast information, or (c) as a contrast only image (Images courtesy of Dr. Thomas Albrecht, Vivantes Hospital. Berlin, Germany)
Harmonic Imaging
This is a nonlinear imaging modality that can detect microbubble harmonic responses at a higher sensitivity than the response from the surrounding tissues. The weaker nonharmonic echos from the multiple responses from the body wall (as with obese patients) are filtered from the final image as well, improving the signal-to-noise ratio [12]. This sensitivity is derived from the fact that the microbubbles produce a unique nonlinear, harmonic response that can be separated from the tissue echos and large vessel blood flow. Currently, there are commercially available transducers that can both emit ultrasound energy and detect the microbubble harmonic response. These transducers are tuned in to detect the resonant frequency of microbubbles, which range in diameter from 1 to 9 μm, in the 1–9 MHz range [35, 36]. Several techniques can be used with harmonic imaging to refine the detection of the nonlinear, harmonic response of the contrast agents including conventional imaging, subtraction techniques using single (coherent imaging mode) or multiple pulses (pulse or phase inversion), and a combination of the latter for multiframe subtraction techniques. Conventional imaging uses a monopulse technique in which a single pulse of ultrasound is emitted and the second harmonic of the microbubble echo is isolated using filters. The microbubble signal returns at 10–15 dB higher than the signal from the surrounding clutter. Harmonic imaging can provide gray scale and Doppler information; however, it does have its limitations. First, the filtering process to isolate the second harmonic from the fundamental frequency affects the image quality. Also, the increased attenuation of the harmonic frequency compared to the fundamental frequency limits the depth of the imaging capabilities [8].
Pulse or phase inversion involves the emission of two consecutive pulses in inverted phases and the detection of the difference of the unique resonance of microbubbles in each phase [36]. Since microbubbles have a unique harmonic response to the consecutive pulses, the difference in the echo signals in the two phases results in an increased sensitivity in the detection of the microbubbles (Fig. 55.13). Power pulse inversion utilizes these same principles using a multipulse technique. The multipulse technique adds to the sensitivity of the modality and improves the differentiation between liquids and solids, as well as limiting motion artifacts [14]. Intermittent imaging and scanning are employed when using a high MI imaging modality for microbubble destruction [8]. This approach allows for replenishment of the contrast agent between images. The frame rate is reduced to about 1 frame/s compared to the conventional 30 frames/s. The frame rate can also be synchronized with the cardiac cycle so that the microbubble can be carried into the area of interest where the microbubbles have been destroyed. Depending on the imaging delay time after the microbubbles have been destroyed, regions with either increased or decreased blood volumes can be determined. Intermittent imaging is thus limited by its inability to provide real-time imaging. Another limitation is motion artifact between image acquisitions.
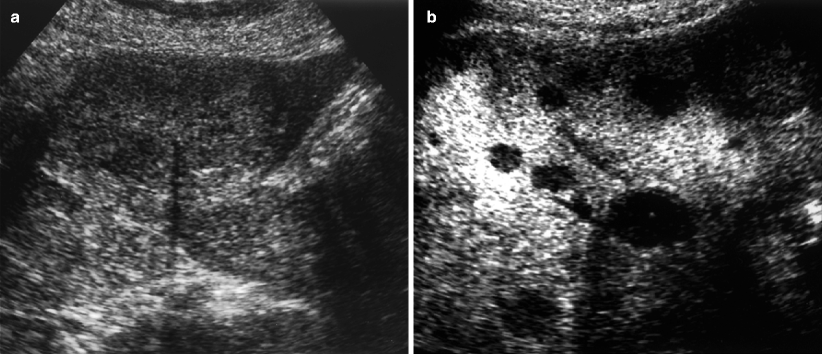

Fig. 55.13
A 78-year-old man with metastatic liver disease. (a) Native B-mode sonogram shows inhomogeneous parenchyma of the liver, suggestive of focal liver lesions. (b) Contrast-enhanced late-phase pulse-inversion sonogram shows clear demarcation of multiple focal lesions without enhancement surrounded by enhanced liver parenchyma. Liver biopsy revealed metastatic liver disease by adenocarcinoma. Diffuse infiltration of the liver was confirmed on CT (Reprinted from von Herbay et al. [37]. With permission from American Roentgen Ray Society)
Flash Echo Imaging
Flash echo imaging is a technique that involves using a low MI between intermittent high MI destructive phases and following the target to be imaged during the entire study. A real-time anatomic image and a contrast-enhanced image during bubble destruction can be viewed simultaneously on the image screen [8] (Toshiba Medical Systems, Tokyo, Japan) (Fig. 55.14).
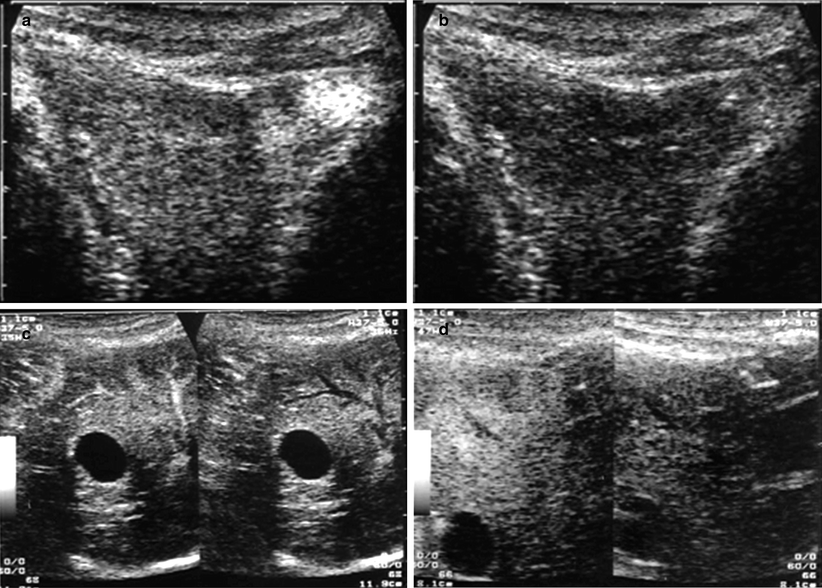

Fig. 55.14
Contrast echography images obtained using the flash echo imaging system (harmonic imaging). (a, b) First and second frames of intermittent scanning (interval: 4 s, multiple frame scanning: three frames); (c) dual window method (interval: 1 s, multiple-frame scanning: two frames); and (d) intermittent scanning (left) with monitoring (Reprinted from Kamiyama et al. [38]. With permission from Elsevier)
Real-Time Digital Subtraction
Another imaging sequence involves real-time digital subtraction of a bubble-destruction phase image from a consecutively acquired background image taken milliseconds apart. This technique limits motion artifact and improves the visibility of the microbubbles in the resulting image [8] (Fig. 55.15).
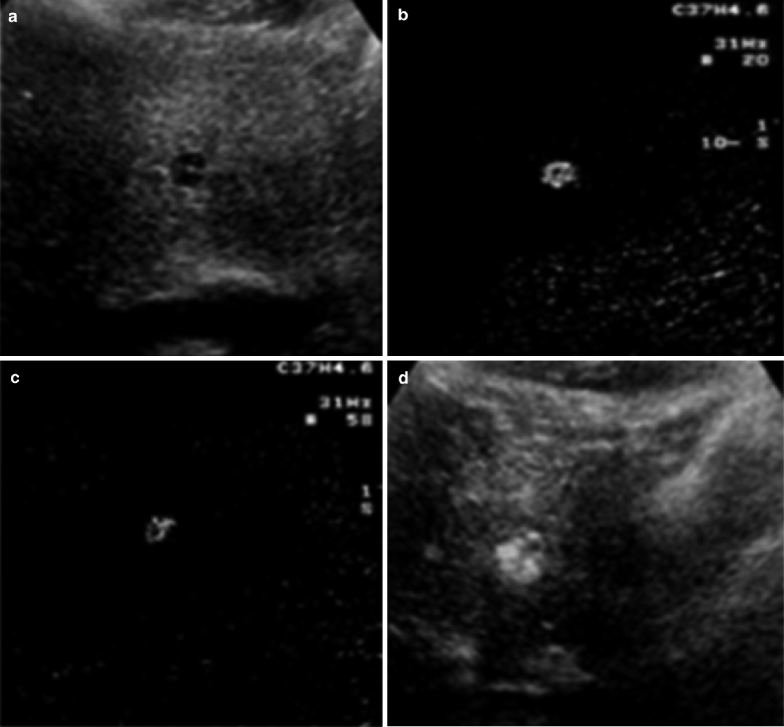
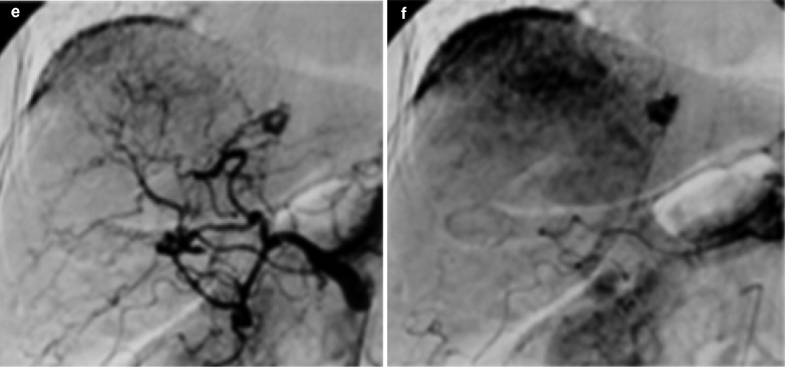


Fig. 55.15
A 72-year-old woman with a hemangioma (diameter, 12.7 mm) on the left liver. (a) Subcostal plain ultrasound (US) scan shows a hypoechoic nodule in the left lobe. (b) Digital subtraction image (DSI) of the same tumor, at 50 s after the injection, shows hyperenhancement. (c) DSI of the same tumor, at 5 min after the injection, shows hyperenhancement. (d) US angiography of the same tumor, at 5 min after the injection, shows hyperenhancement. (e) Hepatic angiogram obtained during the arterial phase shows a hypervascular tumor. (f) Hepatic angiogram obtained during the late phase shows a hypervascular tumor (Reprinted from Yamamoto et al. [39]. With permission from Demetrios Spandidos, Spandidos Publications)
Clinical Applications of Ultrasound Contrast Agents
Assessment of Vascular Abnormalities
Imaging of vascular structures using CEUS allows simultaneous assessment of the vascular lumen (using the CEUS signal) and the vascular wall (using the classical B-Mode signal). Thus, vascular anatomy and vessel patency can be evaluated, allowing reliable detection of several vascular abnormalities [40]. Since CEUS can easily be used at the bedside and during interventions, it is also suitable for guiding and monitoring vascular interventions and following them up [41]. CEUS can also be used to image vascular plaques. Location and extension as well as ulcerations can be visualized.
Renovascular Assessment
Diagnosis of renal artery stenosis, determination of microperfusion, and extent of infarcts, as well as delineation of solid or cystic masses are all applications of CEUS that are being studied. It has been shown that using contrast agents with ultrasound evaluation improved the efficacy of the scan by enhancing the operator’s ability to visualize the renal arteries and by increasing the number of definitive examinations. Although angiography has been considered the “gold standard” in the evaluation of renal artery stenosis, its invasiveness and patient exposure to radiation and nephrotoxic contrast agents restrict its use as a screening modality. Conventional Doppler ultrasound is routinely used for renal artery stenosis evaluation; however, studies have shown that there is great variability from center to center in its correlation to angiographic findings. In addition, the ability to obtain technically successful examinations was also shown to vary among the studies. Avasthi et al. reported good correlation between the studies when evaluating 52 renal arteries with both Doppler ultrasound and angiogram [42]. They reported 89% sensitivity and 73% specificity for Doppler ultrasound in detecting lesions with a greater than 50% lumen reduction. Technically adequate examinations were performed in approximately 84% of the patients. Similarly, Norris et al. performed successful examinations in 90% of the patients studied, with Doppler ultrasound having 73% sensitivity and 97% specificity when compared to angiography [43]. In contrast, Berland et al. obtained adequate examinations in only 58% of their patients, while being unable to identify any of the seven patients who had renal artery stenosis on angiogram. They reported only 37% specificity, as patients without renal artery stenosis were detected on only 7 out of 19 ultrasound examinations [44]. Desberg et al. reported success in only 51% of ultrasound examinations [45]. Such variability in the success of Doppler ultrasound in the evaluation of renal artery stenosis is reflective of the technical difficulty of performing an adequate examination in a wide variety of patients. Patient body habitus and variable renal artery anatomy also complicate examinations. CEUS is proving to be the imaging modality that can overcome these limitations. Claudon et al. reported the results of a randomized crossover study of 198 patients from 14 European centers who were referred for renal arterial angiography because they were suspected of having renal arterial stenosis [15]. They reported a 63.9–83.8% increase in successful examinations when adding contrast to the ultrasound scan, including in obese patients and those with renal dysfunction. When comparing Doppler ultrasound to angiography, CEUS results correlated with angiographic results in the diagnosis or exclusion of renal artery stenosis more often than conventional Doppler ultrasound (p = 0.001). In addition, Lacourciere et al. reported results from 78 patients involved in a Canadian multicenter controlled pilot study who were undergoing evaluation for renal artery stenosis comparing captopril-enhanced scintigraphy and unenhanced and enhanced ultrasound [46]. Results revealed that CEUS examination yielded a diagnosis in more patients than unenhanced ultrasound or scintigraphy—99%, 82%, and 81%, respectively (p = 0.002). The proportion of technically successful ultrasound examinations increased significantly with the addition of contrast. CEUS has also been used to evaluate the microperfusion of the kidney and to define areas of ischemia or infarct. Renal perfusion has been quantified by using a high MI to destroy microbubbles, then using low MI intermittent harmonic imaging at various pulse intervals to plot pulse interval versus video intensity to derive microbubble velocity (MV) and renal blood volume fraction (BVF) [47] (Fig. 55.16). Wei et al. showed that measuring the rate of microbubble replenishment after destruction reflected MV. When the tissue is completely replenished with contrast, the signal reflects the tissue BVF. The product of MV and BVF correlates with tissue nutrient blood flow (NBF) [48]. Total renal blood flow (RBF) is estimated by cortical MV since >90% of total RBF supplies the renal cortex. Wei et al. showed that CEUS provides an assessment of RBF and tissue NBF that correlates with blood flow measurements obtained with a conventional Doppler flow probe [47]. The added assessment of NBF with CEUS allows the evaluation of renal pathologies that affect NBF with little affect on RBF and vice versa. Thus, CEUS provides improved information on the perfusion pattern of the kidneys in conditions such as pyelonephritis, embolism to the kidney, and post-transplant assessment of a transplanted kidney [49]. In addition to the imaging capabilities of CEUS, recent reports have demonstrated nonvector gene transfer into the kidney using microbubbles and ultrasound as a delivery vehicle. For example, Lan et al. studied the use of ultrasound and microbubbles to transfer a doxycycline-regulated Smad7 gene into the kidney as a potential therapy for renal fibrosis. They found that compared with nonultrasound treatment, the combination of ultrasound microbubble-mediated delivery largely increased Smad7 transgene expression up to a 1,000-fold in all kidney tissues [50]. CEUS is an imaging and therapeutic modality that will hopefully provide a safe, noninvasive, and easily applicable alternative in the management of renal disease.
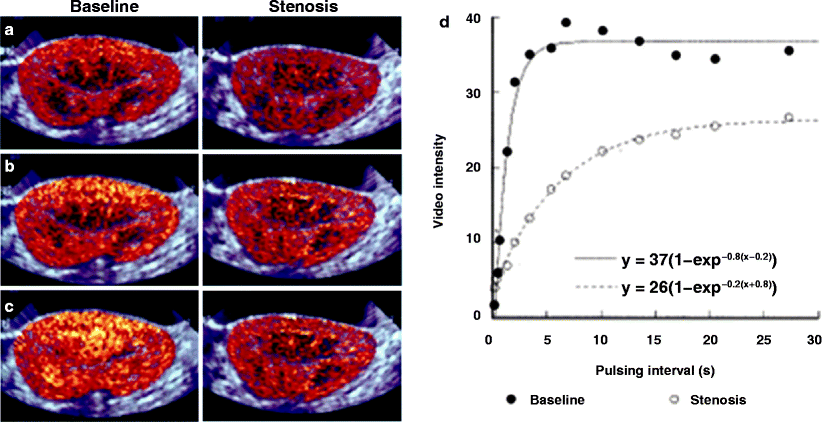

Fig. 55.16
Background-subtracted color-coded images obtained from an animal at progressively longer pulsing intervals (a–c), at baseline and in the presence of a flow-limiting renal artery stenosis. The pulsing interval versus video intensity curves obtained from the cortex during both stages are shown in (d). The lower rate of rise of video intensity (open versus closed circles) was reflected by a significant decrease in cortical microbubble velocity from 0.8 to 0.2 s−1 (Image courtesy of Dr. Kevin Wei, Oregon Health & Science University, Portland, OR)
Echocardiography
Left ventricular cavity opacification (LVO) is clinically important in the evaluation of cardiac structure and ventricular function in resting and stress echocardiography. In the United States, contrast agents are FDA approved for ventricular opacification and enhancement of endocardial border definition. CEUS is used in those patients with a technically suboptimal echocardiogram. Contrast has been shown to increase the diagnostic capability of echocardiograms in numerous studies. In one study with 200 patients, the patient cohort was selected on the basis of suboptimal baseline echocardiograms with nonvisualization of at least 2 of 6 segments in the apical four-chamber view. CEUS in these patients converted a nondiagnostic study to a diagnostic echocardiogram in 75% of those patients examined. This added improvement in image quality resulted in a greater ability to answer the primary referral question in as many as 50% of patients [51]. Similar findings have been observed after left ventricular (LV) opacification produced by intravenous injections of investigational contrast agents [19, 52].
Stay updated, free articles. Join our Telegram channel

Full access? Get Clinical Tree


