Chapter 22
Computed Tomography
Jan D. Blankensteijn, Leo J. Schultze Kool
Conventional contrast-enhanced arteriography is no longer considered the standard imaging modality for vascular disease.1–6 As with many technologic advances, however, the process of image creation continues to become more difficult for the average end user to understand. Although the typical vascular surgeon can perform clinical evaluation and make decisions without an understanding of the basic principles behind computed tomography (CT), these concepts remain important. A better grasp of the image creation process and terminology also aids collaboration between the radiologists creating the images and the surgeons who use the images to plan surgical interventions. Finally, an understanding of the basic concepts enhances the ability of the surgeon to understand technologic advances as they become the new standard of care.
Basic Principles
In the early 1930s, the Dutch radiologist Ziedses des Plantes first devised a technique that reduced the problem of superimposition of structures in basic radiography (x-ray tube and plain film). Physically connecting the x-ray tube and film opposite each other and rotating the combination around a body segment sharpens the image created by the points on the focal plane, whereas the images of points outside the focal plane are blurred, thereby creating less superimposition artifact. This technique was called “planigraphy” or “tomography,” derived from the Greek words tomos, which means “a section” or “a cutting,” and graphein, meaning “to write.” Tomography played an important role in diagnostic radiology until the 1970s, when invention of the transverse axial scanning method together with the availability of minicomputers, which allowed computational reconstruction of images, led to the development of so-called computed axial tomography (CAT scan, or later CT scan).
Two similar methods for transverse axial scanning and image reconstruction were independently invented by Sir Godfrey Newbold Hounsfield in Hayes, United Kingdom, at Elector-Musical Instruments (EMI) Limited Central Research Laboratories, and Allan McLeod Cormack of Tufts University in Massachusetts. A combination of hardware, mathematical algorithms, and computer software resulted in the cross-sectional images. The first so-called EMI scanner was installed in Atkinson Morley’s Hospital, Wimbledon, England, in 1971.7 In the United States, the first installation was at the Mayo Clinic in Rochester, Minnesota. These machines would acquire two adjacent brain tomographic sections in about 4 minutes and needed about 7 minutes of computation time per picture. This was such a leap forward in imaging technology that Hounsfield and Cormack shared the Nobel Prize in 1980.
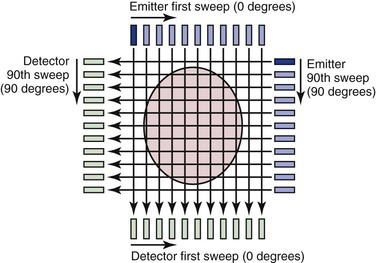
Many of the principles used in this first-generation CT scanner are still in use today and provide a framework for understanding the technology. The fundamental unit for this scanning method consists of an emitter and a detector; an x-ray beam is transmitted through the tissue and detected on the other side. The emitter produces a thin (highly collimated) x-ray beam that sweeps in linear fashion across the body cross-section (Fig. 22-1). The detector moves as a unit with the emitter and records data from 160 separate, parallel, and immediately adjacent beams. The emitter and detector units are mounted within a gantry, which is rotated 1 degree before another linear, transverse sweep takes place. This process is repeated through 180 degrees of rotation to produce the data necessary to form a 160 × 160 matrix for a single cross-sectional image. The attenuation (the rate of reduction of x-ray energy recorded at the detector) of multiple x-ray beams traversing the same point in the matrix from different angles is collected and an ingenious method applied to calculate backward to the density or CT number that must be present at each location in the matrix.
The resulting CT number is said to be expressed in Hounsfield units (H). Clinically, CT numbers range from the extremes of air (−1000 H) to dense bone (>1000 H), but fat (−20 to −100 H), water (0 H), and muscle and blood (40 to 60 H) tend to lie in a much narrower range. Differences in factors such as the energy level of the beam and tissue thickness prevent the density in Hounsfield units from being absolutely uniform from one CT scan to another, but the ranges are similar. When the range of CT numbers for a scan is determined, it can be broken up into smaller ranges for graphic display by a set of gray-scale values. In the chest, CT numbers approaching 1000 H (bone) are typically assigned values close to pure white, whereas CT numbers approaching −1000 H (air) are typically assigned values close to pure black. CT numbers between −1000 and +1000 H would be displayed as graduated shades of gray. Each gray-scale data point in the matrix is known as a pixel because it represents a “picture element.” When displayed as a whole, this matrix of gray squares becomes an interpretable image.
Types of Scanners
Single-Slice Sequential CT
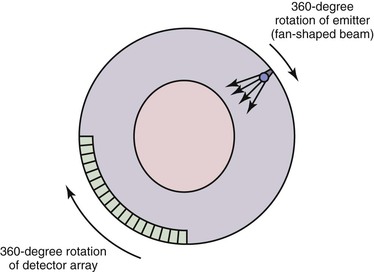
A first-generation CT scanner is capable of producing a cross-sectional image with a 160 × 160 matrix. These CT scans were applicable only to parts of the body with limited motion (e.g., the head) because the back-calculation algorithm depends on the subject’s remaining in one position while data are collected for the entire cross-section. To obtain useful scans in areas such as the chest and abdomen, subsequent generations of CT scanners were designed to decrease the time required to obtain a complete cross-sectional image. The second-generation CT scan used an emitter that produced a broader fan-shaped x-ray beam and an array of 30 detectors instead of a single detector. These innovations greatly reduced the number of emitter locations required to complete a single transverse sweep, as well as the number of transverse sweeps (1-degree increments were no longer required for a complete cross-sectional image). The time for a single cross-sectional scan was reduced to approximately 15 seconds. In a third-generation scanner, the emitter produces a wider fan-shaped x-ray beam, and hundreds of detectors are arranged in an arc (Fig. 22-2). Because the beam/detector combinations cover the entire patient, no transverse sweep is required—the emitter and detector array rotate in a continuous 180- or 360-degree arc to produce a complete cross-sectional scan in 1 second. In a fourth-generation CT scanner, the detector array covers the entire 360-degree arc and only the emitter rotates.
Spiral (Helical) CT
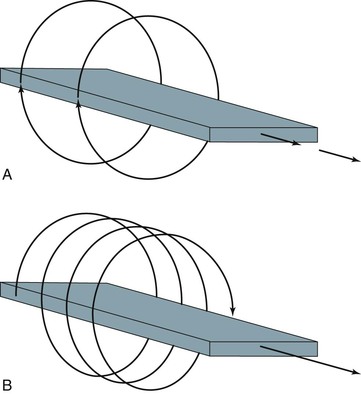
With development of the slip-ring gantry, the emitter and detector array can rotate continuously in the same direction, and at the same time, the computer can acquire data continuously. With conventional CT, there would still be a pause in data acquisition while the table (patient) moves to a new position for the next cross-section to be scanned. If the table moves in a continuous linear motion through the gantry while the x-ray emitter and detector rotate continuously over 360 degrees, data can be acquired in a single sweep over the entire volume of interest. In this technique the emitter traces out a spiral relative to the patient, which is referred to as a spiral CT or helical CT scan (Fig. 22-3).
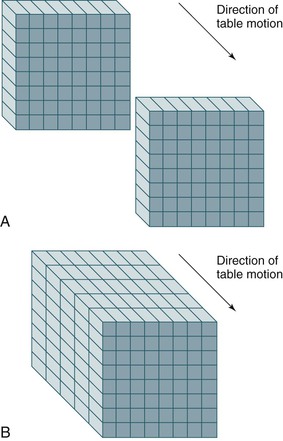
Spiral or helical CT technology has several important ramifications beyond a simple decrease in scan time. A spiral CT scan collects data over a continuous volume rather than discontinuous slices (Fig. 22-4). The most obvious advantage of acquiring data over a continuous volume is that thin axial slices can be reconstructed from the digital data set at arbitrarily small intervals without additional radiation exposure. Single-slice sequential CT can produce similar overlapping or adjacent axial slices, but the tradeoff is increased scan time and additional radiation exposure. The advantage of sequential scanning, however, is a lower level of reconstruction artifacts because table movement along the z-axis during scanning does not need to be corrected in the acquired data sets. This is the main reason why sequential scanning is often used for brain imaging.
Multislice (Multidetector) CT
Multidetector scanners have multiple rows of detectors, so that the volume to be scanned can be covered more quickly. Whereas a single-slice detector acquires one slice per rotation, multidetector CT scanners are capable of acquiring multiple separate slices. Each slice can be acquired at 1-mm or even submillimeter thickness with rotation times in the range of subseconds. Complete imaging of the abdominal vasculature can be accomplished in a fraction of the time required with previous-generation scanners, which can diminish or eliminate many artifacts or compromises that must be dealt with in single-row detector scanners, as discussed subsequently. For this reason, multidetector or multirow scanners have almost completely replaced the earlier-generation single-row scanners.
Advances in hardware and computer software technology have also greatly improved the graphic image display despite the reduction in scan times. A first-generation CT scanner produced a cross-sectional image with a 160 × 160 matrix, but current scanners typically generate a 512 × 512 matrix. Each data point in the matrix is mapped to a gray scale for display, so the size of the matrix and the field of view (FOV) have a direct impact on resolution of the display (the smallest distinguishable element). Data points are displayed as a two-dimensional (2D) picture, and each point in the display matrix is a pixel (picture element). Data points are acquired in three dimensions, however, and each data point in the matrix actually represents a voxel (volume element). The size of the voxel is determined by multiple factors, including detector design, FOV (x, y direction), and thickness of the x-ray beam (z direction). One current advantage of CT over magnetic resonance imaging (MRI) is that CT is typically displayed in a 512 × 512 or greater matrix, with resolution of 0.2 to 1 mm2 for each pixel. MRI is generally limited to a 256 × 256 matrix, and resolution in the axial plane is roughly half that of CT.
CT Angiography
Visualization of vessels on CT is limited by the similar densities of blood and soft tissue. Although administration of intravenous contrast material can overcome this problem to some extent, optimal visualization of the vessels (computed tomographic angiography [CTA]) was not possible until the availability of spiral CT. The main advantage of spiral CT over sequential CT is the possibility of imaging a larger part of the body in a shorter time. Such fast scanning allows visualization of the vessels during the short period that a bolus of contrast material passes the imaged volume. Thus faster scan times and increased numbers of detectors will allow a larger part of the body to be imaged as the contrast bolus passes.
Timing of the initiation of image acquisition relative to injection of the contrast agent is crucial for maximizing opacification of vessels in the scanned volume. Various dedicated algorithms have been developed by the CT scanner manufacturers, but they are all based on a stationary, continuous scan of a single slice in which contrast density is measured in an area of interest (usually a large vessel) marked by the operator. Only after a sufficient increase in density is measured is the spiral CT run initiated.
Both the length and the density of the contrast bolus are important parameters. Bolus length should be balanced against the length of the volume to be imaged. Because large distances must often be covered, CTA generally requires a significant infusion of contrast material. In the past, a typical CTA study from the celiac axis down to the external iliac arteries would require 120 to 180 mL of 300 mg/mL nonionic contrast.8,9 Optimization of scanning and power injector protocols and the use of saline push bolus techniques reduced this volume significantly, and often volumes do not exceed 100 mL.
Acquisition Parameters
All the concepts and considerations mentioned previously are ultimately used to form a scan protocol. A scan protocol consists of a series of settings of acquisition and contrast parameters, reconstruction parameters, technician and patient instructions, and maneuvers to generate a set of images that is optimal for the specific anatomy and indication for the CT scan. The protocol includes the setting of x-ray emitter parameters (i.e., kilovolts peak [kVp] and milliampere-second [mAs]), length of helical exposure, pitch, collimation, patient instructions (i.e., breath-hold), dosage of contrast material, delay, volume and infusion rates, reconstruction interval and algorithm, parameters of radiation dose optimization tools, and FOV.
Prescan and postscan parameter settings should be distinguished. Various postscan settings, such as the reconstruction algorithm or interval, can be applied to the raw image data. This is not true for the prescan settings. Obviously, an improper prescan setting cannot be corrected after the images have been acquired. Particularly in multislice scanners, proper prescan settings are important and have a direct impact on the diagnostic value of the scan.
Scan parameter settings are also important for optimization of the scan protocol in relation to the clinical question because this may be the only way to limit the radiation dose delivered by the scan.
Prescan Parameters
kVp and mAs.
Tube voltage, measured in kVp, is the value that determines the energy level of the x-ray tube. Higher tube voltage renders better tissue penetration but leads to decreasing relative contrast differences between the various tissues. High kVp settings (120-140) are recommended to allow sufficient photons to reach the detector elements in obese patients but also in regions with high x-ray attenuation (shoulders, abdomen, pelvis). In children or slim patients, low kVp settings (80) should suffice and also produce increased contrast differences.
mAs values describe the tube current time product. The mAs value is linearly related to the duration and amount of radiation. Higher mAs represents more radiation delivered by the x-ray tube and leads to a decrease in image noise because more photons will reach the detector. However, this decreased noise is achieved at the expense of an increased radiation dose to the patient. kVp and mAs settings are closely linked, and a change in one may dictate a change in the other.
Collimation.
Collimation is a method of reducing the thickness of the x-ray beam. Collimation has a direct impact on spatial resolution in the z-axis and determines the smallest possible slice thickness (postscan parameter).
Table Feed and Pitch.
Pitch (P) is defined as the ratio of table feed (the speed at which the table moves during tube rotation) and collimation. Values above 2 will result in undersampling of the region of interest and might result in artifacts. Values below 1 will result in overlapping scans, which might be beneficial for three-dimensional (3D) reconstructions but will also increase the dose significantly if other scanning parameters are kept constant. For multislice CT scanners, pitch calculations are different, depending on whether single collimation of one detector ring or total collimation of the whole detector array is chosen. An asterisk indicates that total collimation of the detector array is being described; for a four-slice scanner, a pitch of 2 corresponds to a P* of 8.


where P = pitch, TF = table feed, N = number of detectors, and SC = single-section collimation.
To give an example for a 64-slice scanner, if pitch is set at 2 and collimation is set at 1 mm, the resulting TF—according to the formula P*= TF/(N × SC)—will be 64 mm/sec.
Scanning time is the maximum duration of a scan that a certain tube allows while not exceeding the maximum permissible heat capacity. Older scanners are limited to approximately 20 seconds, whereas newer scanners allow scan times of up to 100 seconds.
Patient Positioning.
Proper positioning of the patient can significantly improve image quality and decrease radiation dose. A clear example is raising the arms of the patient when scanning the upper part of the chest (Fig. 22-5).
Contrast Protocols.
With the newer scanner types, good timing of the administration of contrast material has become an essential part of the examination. Depending on the indication and parameter settings (pitch), optimization of total volume of contrast, contrast iodine density, volume, and speed of injection is required.
Postscan Parameters
Increment.
The increment or reconstruction index defines the spacing of the reconstructed images from the raw data set. One could, for instance, decide to reconstruct only a 1-mm slice every 3 mm. The main advantage would be the fewer number of reconstructed slices than if a 1-mm slice had been reconstructed for every position. If the raw data are saved, it is possible to obtain reconstructed images at different positions retrospectively.
Slice Width.
Slice width or section collimation defines the thickness of the slice. Slices of various thickness ranging from 0.5 to 10 mm can be calculated from the raw data. The minimum slice thickness, however, is defined by the prescan collimation setting. The main advantage of a thicker slice is a lower noise level and a significant reduction in the data load produced by modern multislice scanners.
Field of View.
As mentioned previously, the size of the display matrix and FOV have a direct impact on axial resolution of the display. By keeping FOV to the minimum necessary, pixel size is decreased. If FOV is 30 cm and the matrix size is 512 × 512, each pixel in the display of axial slices is 0.6 mm. If FOV is reduced to 20 cm, pixel size is improved to 0.4 mm, but the tradeoff is that a higher radiation dose is required because of an increase in detector noise.
In general, a small FOV is important only when detailed measurements are necessary (e.g., in endovascular surgery, calculation of carotid artery stenosis or intracerebral aneurysms). In addition, factors such as contrast density, timing of administration of contrast material, window level, and window width more strongly affect the ability to distinguish different structures and the edges of these structures (see Post Hoc Image Optimization discussion later in this chapter).
Windowing.
Window width (WW) sets the number of gray scales displayed, and window level (WL) defines the middle gray-scale value of the width. Windowing sets the contrast and the brightness of the image.
Reconstruction Algorithms.
Reconstruction algorithms (convolution kernel) are used to reconstruct the raw data. Because these algorithms determine the relationship between spatial resolution and noise and thus contrast resolution, different algorithms can be selected for different indications. If high spatial resolution (bone pathology) is needed, high-resolution convolution kernels are applied (HR kernels). With this algorithm a significant increase in spatial resolution is obtained, but it is achieved at the expense of a significant increase in image noise.
Dynamic CT Scanning
With the increased number of detector rings in the new multislice scanners, dynamic CT scanning has become an option.10 The basic concept is that of obtaining CT images at a fixed location (in other words, without moving the table) during the injection of contrast material. After injection of a contrast agent, imaging at a fixed position with continuous rotation of the CT gantry will provide insight into passage of contrast material through the arterial, capillary, and venous phases, representing tissue perfusion. The anatomic area covered by this type of imaging is determined by the length of the detector area. The 256 and 320 scanners are better suited for this technique and are currently used predominantly for brain and cardiac perfusion studies.
Retrospective electrocardiogram (ECG)–gated CT acquisition is a scanning technique in which the ECG is registered during the scan and coupled to the raw data obtained.11 By partial reconstruction of the images, it is possible to obtain an image at, for instance, eight different phases of the ECG. The technique is now available on almost all 64-slice scanners and is most often used for coronary imaging.12 Because partial reconstructions are used, a major drawback of this technique is that the resulting images are substantially noisier than the full reconstructions. In prospective ECG-gated CT acquisition, the x-ray beams are turned on during preselected phases of the cardiac cycle. The main benefit of this way of sampling is the lower radiation dose, which, in comparison with retrospective gating, proved to be reduced by 52% to 85%. The main disadvantage is that only preselected phases can be reconstructed.
Postprocessing
Multiplanar Reformatting
Another advantage of data acquisition over an entire volume is the ability to reconstruct or reformat the data in arbitrary planes. Reformatting CT data into coronal, sagittal, or other nonaxial planes is often referred to as multiplanar reformatting or multiplanar reconstruction (MPR). A schematic representation of this process is shown in Figure 22-6. The ability of spiral CT to view the data in coronal, sagittal, or arbitrarily defined planes often gives more insight into vascular anatomy than possible with axial views alone.13
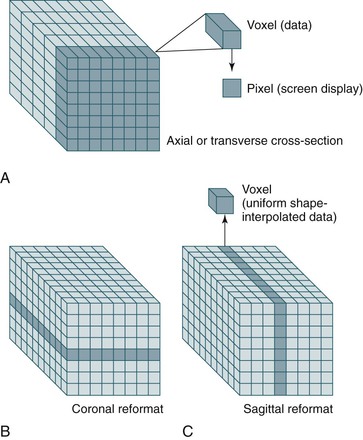
Figure 22-6 A-C, Because spiral CT data are acquired and stored over a continuous volume, they can be used to create axial (A), coronal (B), and sagittal (C) sections. For display purposes, the nonuniform voxel can be interpolated into a cube, but the quality of the data still depends on the length of the original voxel (which is determined by the collimation). Reformatting CT data into coronal, sagittal, or other nonaxial planes is often referred to as multiplanar reformatting.
Measurements
Simple axial CT slices often do not cut through planes perpendicular to the vessel, which results in elliptical cross-sections that can make measurements of diameter difficult (Fig. 22-7). Generally, the narrowest diameter of the elliptical cross-section is the “true” arterial diameter, but this is not always the case because the aorta does not always have a simple cylindrical or conical shape.14 Conventional CT may lead to a slight overestimation of diameter on axial slices, whereas spiral CT slices reconstructed perpendicular to the vessel tend to be more accurate.3,15–18 Simply using sagittal or coronal reconstruction is not always adequate because these sections may not be perpendicular to the vessel or may not cut through the center of the vessel over an adequate length. Curvilinear reformats continue to improve, but they make measurements of length difficult and straighten out angles, which may affect an endovascular repair. Spiral CT with 3D reconstruction and CT reformats perpendicular to the vessel lumen eliminate the diameter measurement problems associated with the other techniques (see Fig. 22-7).3,15–18 CTA with 3D reconstruction offers several other important benefits that are key for imaging before endovascular surgery. In conjunction with spiral CTA and multiplanar reconstruction, 3D reconstruction speeds assimilation of the CT data and makes the extent of an aneurysm rapidly apparent.3,16,17 More important, specialized measurement software and unique aspects of the 3D reconstruction can eliminate most of the measurement problems associated with conventional techniques.3,15–18 Software algorithms can be used to display the centerline of the blood flow channel in the infrarenal aorta and iliac arteries and allow measurements of length along the vessel centerline in tortuous aortic or iliac segments.15 In some systems, graft paths along a line other than the centerline can be also defined by the user, which is necessary because an endovascular graft may not follow the centerline of the blood flow channel throughout its entire course.
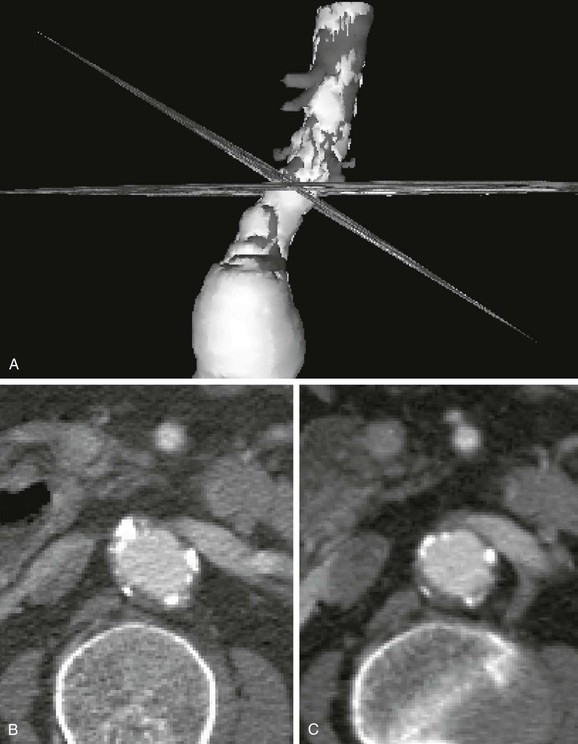
Figure 22-7 Diameter measurement issues and solutions using CT. A, Three-dimensional (3D) reconstruction with simultaneous display of CT slices in 3D space. The CT slices shown here are a standard axial reformat and a reformat perpendicular to the aorta. The 3D model was rotated to show the intersection of the two CT slices at the same location on the aorta. B, The same axial CT slice as shown in A. The axial slice does not intersect the aortic neck perpendicular to its axis, thereby creating an elliptical cross-section. Although the smaller diameter (minor axis of the ellipse) is usually similar to the true diameter, elliptical cross-sections also occur in noncylindrical vessels and at the margins of aneurysms. Viewing multiple cross-sections in sequence can help with this problem, but evaluation is still difficult. C, The CT slice reformatted perpendicular to the aorta (shown in A) accurately depicts the essentially circular lumen and provides a diameter measurement without ambiguity. This cross-section of the aorta also provides a more correct impression of thrombus thickness, which is artifactually enhanced on an elliptical cross-section. The renal vein and vertebrae help verify the magnification, location, and orientation of the slices.
Stay updated, free articles. Join our Telegram channel

Full access? Get Clinical Tree


