In 2002, the United States Preventive Services Task Force and the American Heart Association recommended aspirin for the primary prevention of coronary heart disease in patients with Framingham risk scores ≥6% and ≥10%, respectively. The regular use of aspirin (≥3 days/week) was examined in a cohort of 6,452 White, Black, Hispanic, and Chinese patients without cardiovascular disease in 2000 to 2002 and 5,181 patients from the same cohort in 2005 to 2007. Framingham risk scores were stratified into low (<6%), increased (6% to 9.9%), and high (≥10%) risk. In 2000 to 2002 prevalences of aspirin use were 18% and 27% for those at increased and high risk, respectively. Whites (25%) used aspirin more than Blacks (14%), Hispanics (12%), or Chinese (14%) in the increased-risk group (p <0.001). Corresponding prevalences for the high-risk group were 38%, 25%, 17%, and 21%, respectively (p <0.001). In 2005 to 2007 prevalences of aspirin use were 31% and 44% for those at increased and high risk, respectively. Whites (41%) used aspirin more than Blacks (27%), Hispanics (24%), or Chinese (15%) in the increased-risk group (p <0.001). Corresponding prevalences for the high-risk group were 53%, 43%, 38%, and 28%, respectively (p <0.001). Racial/ethnic differences persisted after adjustment for age, gender, diabetes, income, and education. In conclusion, regular aspirin use in adults at increased and high risk for coronary heart disease remains suboptimal. Important racial/ethnic disparities exist for unclear reasons.
Few studies have examined prevalence of aspirin use in a multiethnic cohort of patients without known cardiovascular disease (CVD), especially since the publication of the United States Preventive Services Task Force (USPSTF) and the American Heart Association (AHA) guidelines for the primary prevention of coronary heart disease (CHD) in 2002. Despite its superior cost effectiveness to other medicines and the proved benefit for decreasing CHD, aspirin appears to be underutilized. Rodondi et al assessed the trend in aspirin use from 1997 through 1998 to 2002 through 2003 in 2,163 adults 68 to 80 years of age and reported increases from 15% to 29% for those with a Framingham risk score of 6% to 9.9%, 18% to 35% for those with a risk of 10% to 20%, and 23% to 37% for those with a risk >20%. An examination of nationwide patient encounters from 1993 to 2003 in adults >21 years old found an increase in aspirin use from 3.6% to 16.3% in nondiabetic “intermediate-risk” patients. Intermediate risk was not defined by Framingham risk score, but rather by age and CVD risk factors. Although these studies included data up to 2003, it is unclear what effect, if any, the national guidelines had on prevalence of aspirin use. There are no recent, nationally representative, multiethnic studies examining the prevalence of aspirin use in patients without known CVD. We used data from the Multi-Ethnic Study of Atherosclerosis (MESA), a population-based multiethnic cohort, to assess prevalence, changes over time, and racial/ethnic disparities in aspirin use by Framingham risk score in patients without known CVD.
Methods
MESA is a multicenter cohort study conducted at 6 United States field centers in Baltimore, Maryland; Chicago, Illinois; Forsyth County, North Carolina; Los Angeles, California; New York, New York; and St. Paul, Minnesota. From July 2000 to September 2002, 6,814 subjects 45 to 84 years of age were recruited into the study. Participants identified themselves as White, Black, Hispanic, or Chinese at the time of enrollment. Subjects with a history of CVD, defined as physician-diagnosed myocardial infarction (MI), angina, stroke or transient ischemic attack, heart failure, resuscitated cardiac arrest, or having undergone procedures related to CVD (coronary artery bypass grafting, angioplasty, valve replacement, pacemaker or defibrillator implantation, or any surgery on the heart or arteries), were excluded. The study was approved by the institutional review boards of each site, and all participants gave written informed consent. Details of the design of MESA have been reported previously.
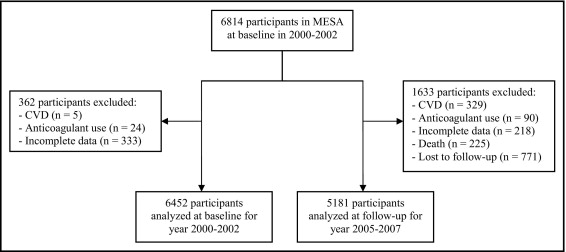
Data from the MESA baseline examination (2000 to 2002) and from a follow-up examination conducted approximately 5 years later (2005 to 2007) were used in these analyses. Of the 6,814 participants at baseline (2000 to 2002), 6,452 participants were included in these analyses ( Figure 1 ). We excluded patients who were subsequently found to have CVD at baseline, users of anticoagulant therapy (because aspirin use for primary prevention in this population is not indicated), and participants with missing data for any variable. Follow-up analyses (2005 to 2007) were based on 5,181 participants ( Figure 1 ). Exclusion criteria included patients who died or were lost to follow-up from baseline to 2005 through 2007, those found to have cardiovascular events during follow-up, users of anticoagulant therapy, and patients with missing data for any variable.
Cardiovascular events during follow-up were defined as MI, resuscitated cardiac arrest, definite or probable angina (if followed by revascularization), stroke, or death due to stroke, CHD, or any other atherosclerotic or CVD. Cardiovascular events were initially identified by interviewers who contacted each participant or a family member by telephone to inquire about interim hospital admissions, outpatient diagnoses of CVD, and deaths. Self-reported diagnoses were verified by 2 physicians and an analysis of medical records. A more detailed description of the MESA follow-up methods is available at http://www.mesa-nhlbi.org .
Gender, race/ethnicity (based on questions modeled on the 2000 census), income, and education were assessed at baseline. Information regarding age and insurance status was obtained at each examination using standardized questionnaires. Age was categorized into 10-year age groups. Subjects with any type of insurance were labeled “insured”; those without any type of insurance were labeled “uninsured”. Information regarding income was collected at baseline and at follow-up in 2004 through 2005. Income was sorted into 4 categories ranging from <$12,000 to ≥$50,000, in concordance with categories established in a previous study. Response categories for highest level of education completed were collapsed into 3 categories: less than high school, high school (or equivalent), or more than high school. The 2003 American Diabetes Association criteria were employed such that diabetes mellitus was defined as a fasting glucose level ≥126 mg/dl and/or self-reported use of insulin and/or oral hypoglycemic agents.
We calculated the 10-year CHD risk for each subject using the National Cholesterol Education Program Framingham risk score, which estimates the risk for hard CHD (nonfatal MI and death from CHD). The Framingham risk score has been validated for use in multiple ethnicities. The only exception was for adults with diabetes, for whom the 10-year CHD risk was assumed to be >20%, making them high risk by definition. Information regarding age, gender, current cigarette use (defined as cigarette use within previous 30 days), and use of antihypertensive medications was acquired using standardized questionnaires. Systolic blood pressure was obtained by taking the average of 2 Dinamap Pro 1000 automated oscillometric sphygmomanometric (Critikon, Tampa, Florida) measurements in millimeters of mercury. Fasting total and high-density lipoprotein cholesterol were directly measured by a central laboratory. Because the Framingham risk score was designed for subjects <80 years of age, we assigned those 80 to 85 years old a risk equivalent to age 79 years. For purposes of analysis, 10-year CHD risk was stratified into 3 mutually exclusive categories based on USPSTF and AHA guidelines from 2002: low risk (<6%), increased risk (6% to 9.9%), and high risk (≥10%).
Information regarding regular aspirin use was obtained by standardized questionnaires at each examination. Regular aspirin use was defined as taking aspirin ≥3 days/week. This definition was intended to capture participants who use aspirin every day or every other day, because studies have shown the 2 dosages effective for preventing CHD. Aspirin use was presumed to be for cardioprotection and no information regarding aspirin allergies or analgesic use of aspirin was available.
Chi-square tests were used to test for differences in prevalence of aspirin use across categories of participant characteristics. Logistic regression models were used to assess the association between aspirin use and each participant characteristic. Models were constructed using a forced entry method whereby all potential confounders were forced into the model. Independent variables were examined for multicollinearity and excluded from analysis if their tolerance value was <0.10. Insurance status was excluded from the models because of concerns for overadjustment and collinearity with income and education. Results are reported as odds ratios with 95% confidence intervals. Analyses were completed separately for baseline examination data from 2000 to 2002 and follow-up data from 2005 to 2007. Results were contrasted. All analyses were conducted with PASW 17.0 (SPSS, Inc., Chicago, Illinois).
Results
Table 1 presents baseline (2000 to 2002) and follow-up (2005 to 2007) sociodemographic characteristics by Framingham risk score. The follow-up sample was older than the baseline sample and more likely to be women. Overall, at the 2 periods, approximately 40% were White, 1/4 were Black, 1/5 were Hispanic, and approximately 10% were Chinese. However, high-risk groups were slightly less likely to be White and more likely to be Black or Hispanic than the lower-risks groups. As expected, there was a clear positive association between age and Framingham risk score at the 2 time points. Male gender was also associated with higher risk scores. Subjects with diabetes constituted about 70% of high-risk groups at the 2 time points. More than 90% of each baseline and follow-up risk group had health insurance. Increasing risk was also associated with lower income and lower educational attainment.
| Variable | Baseline (2000–2002) | Follow-Up (2005–2007) | ||||||
|---|---|---|---|---|---|---|---|---|
| Low Risk | Increased Risk | High Risk | p Value † | Low Risk | Increased Risk | High Risk | p Value | |
| (n = 2,658) | (n = 865) | (n = 2,929) | (n = 1,750) | (n = 615) | (n = 2,816) | |||
| Age (years) | <0.001 | <0.001 | ||||||
| 45-54 | 48% | 30% | 10% | 25% | 20% | 6% | ||
| 55-64 | 30% | 26% | 26% | 42% | 31% | 27% | ||
| 65-74 | 19% | 31% | 39% | 27% | 29% | 34% | ||
| 75-84 ‡ | 2% | 13% | 25% | 7% | 20% | 33% | ||
| Women | 84% | 46% | 26% | <0.001 | 93% | 51% | 30% | <0.001 |
| Men | 16% | 54% | 74% | 7% | 49% | 70% | ||
| Race/ethnicity | ||||||||
| White | 41% | 40% | 35% | <0.001 | 43% | 43% | 37% | <0.001 |
| Black | 27% | 26% | 29% | 25% | 26% | 28% | ||
| Hispanic | 20% | 21% | 24% | 21% | 20% | 23% | ||
| Chinese | 12% | 13% | 12% | 12% | 11% | 12% | ||
| Diabetes mellitus | 0% | 0% | 28% | <0.001 | 0% | 0% | 31% | <0.001 |
| Medical insurance | 90% | 91% | 92% | 0.04 | 93% | 93% | 96% | <0.001 |
| Income ($) | <0.001 | <0.001 | ||||||
| <12,000 | 9% | 11% | 14% | 9% | 11% | 12% | ||
| 12,000-24,999 | 16% | 22% | 23% | 15% | 15% | 20% | ||
| 25,000-49,999 | 30% | 26% | 29% | 29% | 29% | 29% | ||
| ≥50,000 | 45% | 42% | 34% | 47% | 44% | 39% | ||
| Education | <0.001 | <0.001 | ||||||
| Lower than high school | 14% | 18% | 22% | 13% | 15% | 18% | ||
| High school | 18% | 17% | 19% | 18% | 16% | 19% | ||
| Higher than high school | 69% | 65% | 59% | 69% | 70% | 64% | ||
⁎ Framingham risk scores were stratified into 3 mutually exclusive categories based on United States Preventive Services Task Force and American Heart Association guidelines from 2002: low risk (<6%), intermediate risk (6% to 9.9%), and high risk (≥10%).
‡ Age group is 75 to 84 years for baseline data and 75 to 90 years for follow-up data.
Table 2 presents prevalence of aspirin use by selected sociodemographic characteristics at baseline (2000 to 2002). Overall prevalence of aspirin use ranged from 13% for those at low risk to 27% for those at high risk. Older age was associated with a higher prevalence of aspirin use, although there was no clear pattern for those at increased risk. There was no difference in aspirin use between women and men in any risk group. Whites used aspirin more than Blacks, Hispanics, or Chinese in all risk groups. Those with diabetes used aspirin with the same frequency as nondiabetics in the high-risk group. Aspirin use was greater in the insured than in the uninsured for all risk groups. There was also evidence that aspirin use was greater among higher-income and higher-education groups in the high-risk group. In multivariable analyses ( Table 2 ), age was associated with greater aspirin use for all risk groups. Blacks, Hispanics, and Chinese were less likely than Whites to use aspirin in all risk groups. No clear trend can be drawn between aspirin use and income and education in multivariable analyses.
| Variable | Prevalence of Aspirin Use | Adjusted OR of Aspirin Use (95% CI) | ||||||||||
|---|---|---|---|---|---|---|---|---|---|---|---|---|
| Low Risk | p Value † | Increased Risk | p Value | High Risk | p Value | Low Risk | p Value ‡ | Increased Risk | p Value | High Risk | p Value | |
| Overall population | 13% | 18% | 27% | |||||||||
| Age (years) | <0.001 | <0.001 | <0.001 | <0.001 | <0.001 | <0.001 | ||||||
| 45-54 | 8% | 8% | 14% | 1.0 | 1.0 | 1.0 | ||||||
| 55-64 | 17% | 21% | 20% | 3.2 (2.3–4.4) | 3.5 (2.0–6.4) | 1.6 (1.1–2.3) | ||||||
| 65-74 | 18% | 25% | 32% | 3.7 (2.5–5.3) | 9.0 (4.4–18.3) | 3.1 (2.2–4.5) | ||||||
| 75-84 | 37% | 17% | 32% | 8.0 (4.2–15.4) | 6.4 (2.6–15.8) | 3.6 (2.4–5.3) | ||||||
| Women | 13% | 0.76 | 19% | 0.46 | 26% | 0.29 | 1.0 | <0.001 | 1.0 | 0.07 | 1.0 | 0.15 |
| Men | 13% | 17% | 28% | 2.1 (1.4–3.1) | 1.7 (1.0–3.0) | 1.2 (0.9–1.5) | ||||||
| Race/ethnicity | ||||||||||||
| White | 19% | <0.001 | 25% | <0.001 | 38% | <0.001 | 1.0 | <0.001 | 1.0 | 0.01 | 1.0 | <0.001 |
| Black | 11% | 14% | 25% | 0.5 (0.4–0.7) | 0.5 (0.3–0.8) | 0.6 (0.5–0.7) | ||||||
| Hispanic | 8% | 12% | 17% | 0.4 (0.3–0.6) | 0.5 (0.3–0.9) | 0.4 (0.3–0.5) | ||||||
| Chinese | 6% | 14% | 21% | 0.3 (0.2–0.5) | 0.5 (0.3–0.9) | 0.5 (0.4–0.7) | ||||||
| Diabetes mellitus | NA | NA | 0.28 | NA | NA | <0.001 | ||||||
| No | 13% | 18% | 26% | NA | NA | 1.0 | ||||||
| Yes | NA | NA | 28% | NA | NA | 1.6 (1.3–2.0) | ||||||
| Medical insurance | <0.001 | 0.01 | <0.001 | NA | NA | NA | ||||||
| No | 5% | 7% | 13% | NA | NA | NA | ||||||
| Yes | 14% | 19% | 28% | NA | NA | NA | ||||||
| Income ($) | 0.10 | 0.01 | <0.001 | 0.38 | 0.01 | 0.05 | ||||||
| <12,000 | 12% | 21% | 21% | 1.0 | 1.0 | 1.0 | ||||||
| 12,000-24,999 | 9% | 13% | 22% | 0.7 (0.4–1.1) | 0.6 (0.3–1.1) | 1.0 (0.7–1.4) | ||||||
| 25,000-49,999 | 13% | 12% | 29% | 0.9 (0.6–1.5) | 0.5 (0.3–1.1) | 1.4 (1.0–1.9) | ||||||
| ≥50,000 | 14% | 22% | 32% | 0.9 (0.5–1.4) | 1.2 (0.6–2.5) | 1.3 (1.0–1.9) | ||||||
| Education | 0.03 | 0.46 | <0.001 | 0.59 | 0.74 | 0.07 | ||||||
| Lower than high school | 9% | 15% | 20% | 1.0 | 1.0 | 1.0 | ||||||
| High school | 14% | 16% | 24% | 1.1 (0.7–1.9) | 0.9 (0.4–1.7) | 1.1 (0.8–1.6) | ||||||
| Higher than high school | 14% | 19% | 31% | 1.3 (0.8–2.0) | 1.1 (0.6–2.0) | 1.4 (1.0–1.8) | ||||||
⁎ Framingham risk scores were stratified into 3 mutually exclusive categories based on United States Preventive Services Task Force and American Heart Association guidelines from 2002: low risk (<6%), increased risk (6%–9.9%), and high risk (≥10%).
‡ Wald test from logistic regression models (age, gender, race/ethnicity, diabetes mellitus, income, and education included in models).
Stay updated, free articles. Join our Telegram channel

Full access? Get Clinical Tree


