The aim of this study was to investigate the possibility of 64-slice multislice computed tomography (MSCT) to detect vulnerable plaque derived by optical coherence tomography. From September 2007 through December 2009, 122 lesions in 81 patients were evaluated by 64-slice MSCT and optical coherence tomography. Based on optical coherence tomographic findings, lesions were classified as thin-capped fibroatheroma (TCFA; n = 37) and non-TCFA (n = 85). Mean computed tomographic density value of the lesion was lower and remodeling index was larger in the TCFA group (44.9 ± 19.2 vs 78.7 ± 25.0 HU, p <0.0001; 1.14 ± 0.20 vs 0.95 ± 0.16, p <0.0001, respectively). Mean computed tomographic density value was correlated and remodeling index was inversely correlated with fibrous cap thickness (r = 0.605, p <0.0001; r = −0.591, p <0.0001, respectively). Optimal threshold of mean computed tomographic value and remodeling index identified by receiver operating characteristic curve were 62.4 HU and 1.08 (area under the curve 0.859 and 0.781). Signet ringlike appearance was observed more frequently in the TCFA group (65% vs 16%, p <0.0001). In multivariate analysis, independent predictors of TCFA were mean computed tomographic density value ≤62.4 HU (odds ratio 8.20, 95% confidential interval 2.49 to 27.0, p = 0.0005), remodeling index ≥1.08 (odds ratio 6.10, 95% confidential interval 2.04 to 18.2, p = 0.0012), and signet ringlike appearance (odds ratio 6.33, 95% confidential interval 2.03 to 19.7, p = 0.0014). In conclusion, based on comparisons with optical coherence tomographic findings, 64-slice MSCT may have the potential to detect vulnerable plaque.
Disruption of vulnerable plaque characterized by a thin fibrous cap (cap thickness <65 μm), large lipid pool, and macrophage infiltration is a primary culprit in acute coronary syndrome (ACS). Increased detection of rupture-prone vulnerable plaque could be promising for better risk stratification in patients with known or suspected coronary artery disease. Several imaging techniques have been applied for detection of vulnerable plaque. Recently, intravascular optical coherence tomography (OCT) has emerged as an imaging method for plaque characterization in vivo with a high resolution of approximately 10 to 20 μm. A histology-controlled study has shown that OCT can detect a thin-capped fibroatheroma (TCFA) that has a thin fibrous cap and a large lipid core ; thus OCT can serve as a useful technique to assess vulnerable plaque. However, OCT as a diagnostic procedure is invasive and costly, precluding it from being available in everyday clinical settings. Multislice computed tomography (MSCT) has been proposed as a noninvasive imaging technique that can evaluate not only coronary artery stenosis but also detect and classify coronary plaque in vivo. Several studies have suggested that multislice computed tomographic findings such as low computed tomographic density value, positive vessel remodeling, spotty calcification, and signet ringlike appearance are related to plaque instability. However, the potential of MSCT to identify TCFA is controversial. Thus, the purpose of this study was to investigate the possibility of MSCT to detect TCFA derived by optical coherence tomographic imaging.
Methods
From September 2007 through December 2009, 3,320 patients with clinically suspected coronary artery disease underwent MSCT in our institute. Of these, invasive coronary angiography was performed for 528 patients and percutaneous coronary intervention for 330 patients. Of these 330 patients, 90 consecutive hemodynamically stable patients with simple lesion (American Heart Association type A or B1) underwent optical coherence tomographically guided percutaneous coronary intervention after informed consent was obtained. OCT was performed for the target lesions of percutaneous coronary intervention and nontarget lesions identified by MSCT (percent diameter stenosis >50% by visual estimate). All patients underwent MSCT before OCT.
Exclusion criteria for multislice computed tomographic examination were ST-segment elevation myocardial infarction, renal insufficiency (serum creatinine ≥1.5 mg/dl), allergy to contrast media, atrial fibrillation or other rhythm irregularity, or patient inability to perform breath-holding. Research protocols were approved by institutional review boards and all patients provided written informed consent before participation.
Patients were classified as having ACS (non–ST-segment elevation myocardial infarction and unstable angina pectoris) or stable angina pectoris based on their clinical presentation. ACS culprit lesion was identified from electrocardiographic changes and angiographic and transthoracic echocardiographic findings.
Multislice computed tomographic angiography was performed with a 64-slice scanner (SOMATOM Sensation 64 Cardiac, Siemens Medical Solutions, Forchheim, Germany). When heart rate was >60 beats/min, a β blocker (metoprolol 20 to 60 mg orally and/or propranolol 1 to 2 mg intravenously) was administered before the scan. Use of nitroglycerin before scanning was left to the physicians’ discretion. A bolus of contrast medium (iopamidol, iodine 300 or 370 mg/ml, Schering AG, Berlin, Germany; iopromide, idine 300 mg/ml, Shering AG; Omnipaque, iodine 300 or 350 mg/ml, Daiichi, Pharmaceutical Co., Ltd, Tokyo, Japan) was intravenously injected followed by normal saline 20 to 50 ml. We used the iopamidol with iodine 370 mg/ml when patients had never received examination with contrast material. If patients had taken some contrast materials other than iopamidol with iodine 370 mg/ml in a previous examination, the same contrast was used for safety. The start delay was automatically defined using bolus-tracking software equipped with the scanner. The region of interest (ROI) was placed within the ascending aorta, and the scan was started when computed tomographic density levels reached 120 HU higher than baseline computed tomographic density. The scan was performed from the tracheal bifurcation to the diaphragm with the following parameters: collimation width 64 × 0.6 mm, rotation time 330 ms, tube voltage 120 kV, effective tube current 800 mA, table feed 11.5 mm/rotation, and pitch 0.2. Image reconstruction was retrospectively gated to an electrocardiogram, and the optimal cardiac phase showing minimum motion artifacts was individually determined. Computed tomographic images were reconstructed with a smooth kernel (B25f) with a slice thickness of 0.75 mm (increment 0.4 mm). Computed tomographic angiographic datasets were transferred to an off-line workstation (Aquarius NetStation, TeraRecon, Inc., San Mateo, California) for image analysis. The optimal display image setting was adjusted for each patient at a window from 600 to 900 HU and a level from 40 to 250 HU.
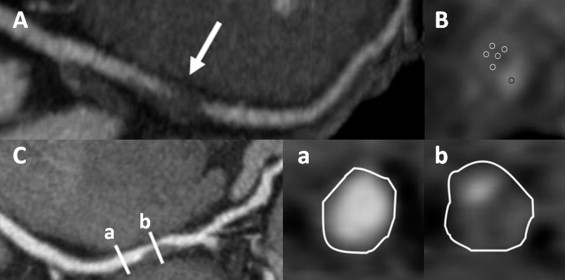
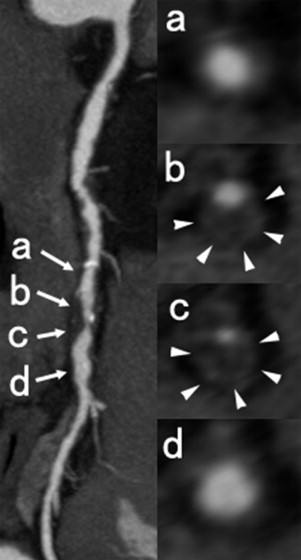
Plaque images were analyzed based on cross-sectional images and multiplanar reconstruction images. For each plaque, 3 cross-sectional slices were evaluated. In each slice, ≥5 rounded ROIs of 0.2 mm 2 were randomly placed within the target plaque and 1 ROI in the center of the lumen. The lowest computed tomographic density values (Hounsfield units) were measured in all ROIs and averaged. For plaque with calcium deposition, ROIs were placed on the noncalcified area. Outer vessel area was manually traced at the 1 cross-sectional image of maximal luminal narrowing of the lesion and the reference segment without detectable plaque proximal to the lesion ( Figure 1 ). Remodeling index was defined as the ratio of the outer vessel area of the lesion to the outer vessel area of the proximal reference site. As reported previously, signet ringlike appearance was defined as a semicircular thin enhancement around the plaque along the outer contour vessel ( Figure 2 ). The threshold of the computed tomographic attenuation of the ring was defined as higher than those of adjacent plaque and ≤130 HU. Size of calcifications was measured and spotty calcification was defined as <3 mm.


Optical coherence tomographic imaging was performed using an optical coherence tomographic imaging system (M2 OCT System, LightLab Imaging, Westford, Massachusetts) with an occlusion-flushing balloon catheter (Helios, LightLab Imaging). The coronary artery was cannulated with a 6 Fr to 8 Fr guide catheter under fluoroscopic guidance. After intracoronary injection of nitroglycerin 100 to 200 μg, baseline coronary angiography was performed and the occlusion-flushing balloon catheter was advanced proximal to the lesion under guidance of a 0.014-inch angioplasty wire, and then the guidewire was exchanged to the optical coherence tomographic imaging wire, which was positioned distal to the lesion. During image acquisition, lactated Ringer solution was continuously flushed through the wire lumen of the occlusion catheter at a rate of 0.5 to 1.0 ml/s by a power injector, and the balloon was inflated to 0.4 to 0.6 atm until blood flow was fully occluded. Motorized pullback optical coherence tomographic imaging was performed at a pullback rate of 1.0 mm/s throughout the lesion. Images were acquired at 15 frames/s and digitally archived.
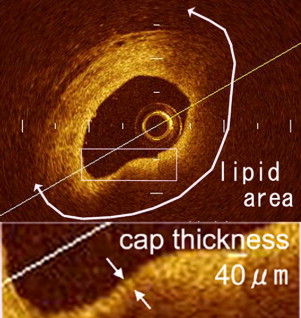
Components of plaque were classified as lipid, fibrous, and fibrocalcific using criteria for plaque characterization. Fibrous cap thickness was measured at the thinnest part of the distance from the coronary artery lumen to the inner border of the lipid pool. When lipid was present in ≥2 quadrants within a plaque, it was defined a lipid-rich plaque and optical coherence tomographically derived TCFA was defined as a lipid-rich plaque whose fibrous cap thickness was <65 μm ( Figure 3 ). Based on optical coherence tomographic findings, lesions were divided into a TCFA group or a non-TCFA group. Plaque rupture was defined as presence of fibrous cap discontinuity and cavity formation of the plaque. Side branches and ostia were used as landmarks to ensure corresponding plaques on multislice computed tomogram as on optical coherence tomogram. Distances from landmarks to the target plaque were measured on curved multiplanar reconstruction images on multislice computed tomogram and corresponding plaque was identified on the longitudinally reconstructed view of optical coherence tomogram.

Computed tomographic and optical coherence tomographic images were analyzed by 2 independent observers, respectively. Observers were blinded to patients’ clinical presentation and the other technique’s findings. For differences in observer readings, a consensus reading was performed and used in the final analysis. To assess intraobserver variability, image analysis was repeated ≥2 weeks later by a single reader.
Quantitative variables are described as mean ± SD. Discrete variables are presented as number and percentage. T tests and 1-way analysis of variance were used to compare quantitative variables, and chi-square test or Fisher’s exact test was performed on discrete variables. Receiver operating characteristic curve was generated to identify optimal cut-off mean computed tomographic value and remodeling index to detect TCFA. Correlation between fibrous cap thickness derived by OCT and mean computed tomographic value and remodeling index was estimated using Pearson correlation coefficient. Multivariate logistic regression was performed to identify potential predictors of TCFA. Computed tomographic findings with significant differences in the univariate model were used in the multivariate model. Sensitivity, specificity, positive predictive value, and negative predictive value were calculated for each predictor of computed tomographic findings in combination to detect TCFA. Interobserver and intraobserver agreements were assessed by linear regression analysis (continuous variables) and kappa test (categorical variables). Statistical significance was defined as a p value <0.05. SPSS (SPSS Japan Inc., Tokyo, Japan) was used for data analysis.
Results
Of 90 included patients, optical coherence tomographic imaging could not be acquired because of unsuccessful crossing of the optical coherence tomographic imaging wire in 3 patients. In the remaining 87 patients, 155 atherosclerotic lesions were detected by MSCT and compared to corresponding lesions by OCT. Of 155 lesions, 24 were excluded because of poor computed tomographic image quality (16 were severe calcification and 8 were motion artifact) and 9 because of incomplete optical coherence tomogram. Thus 122 lesions in 102 vessels of 81 patients were analyzed. Baseline characteristics of patients are presented in Table 1 . Based on optical coherence tomographic findings, 37 lesions were identified as TCFAs and 85 lesions as non-TCFAs. Table 2 lists baseline lesion characteristics. ACS culprit lesion was more common and stable angina pectoris lesion was less common in the TCFA group compared to the non-TCFA group. There was no significant difference in lesion location and angiographic stenosis severity between the 2 groups.
| Age (years) | 65.2 ± 9.6 |
| Men | 66 (81%) |
| Diabetes mellitus | 19 (23%) |
| Hypertension ⁎ | 49 (60%) |
| Hyperlipidemia † | 40 (49%) |
| Smoker | 32 (40%) |
| Body mass index (kg/m 2 ) | 24.3 ± 3.2 |
| Left ventricular ejection fraction (%) | 63.6 ± 11.0 |
| Previous percutaneous coronary intervention | 39 (48%) |
| Previous myocardial infarction | 5 (6%) |
| β-Blocker use | 50 (62%) |
| Nitroglycerin use | 79 (98%) |
| Heart rate during scan (beats/min) | 63.2 ± 10.2 |
| Acute coronary syndrome | 18 (22%) |
| Multivessel coronary disease | 33 (41%) |
| Effective radiation exposure (mSv) | 11.2 ± 3.9 |
| Interval between multislice computed tomography and optical coherence tomography (days) | 23.9 ± 24.2 |
⁎ Systolic blood pressure >140 mm Hg and/or diastolic blood pressure >90 mm Hg or current treatment with antihypertensive medication.
† Total cholesterol >220 mg/dl or use of lipid-lowering therapy.
| Variable | TCFA | Non-TCFA | p Value |
|---|---|---|---|
| Number of lesions | 37 | 85 | |
| Target coronary artery | 0.1 | ||
| Left anterior descending | 12 (32%) | 30 (35%) | |
| Left circumflex | 6 (16%) | 27 (32%) | |
| Right | 19 (51%) | 28 (33%) | |
| Location of coronary narrowing | 0.2 | ||
| Proximal | 25 (68%) | 46 (54%) | |
| Mid | 11 (30%) | 30 (35%) | |
| Distal | 1 (2%) | 9 (11%) | |
| Clinical diagnosis | <0.0001 | ||
| Acute coronary syndrome culprit | 14 (38%) | 4 (5%) | |
| Acute coronary syndrome nonculprit | 7 (19%) | 7 (8%) | |
| Stable angina pectoris | 16 (43%) | 74 (87%) | |
| Percent diameter stenosis on coronary angiogram | 0.26 | ||
| 50∼75% | 9 (24%) | 28 (33%) | |
| 75∼90% | 14 (38%) | 37 (44%) | |
| >90% | 14 (38%) | 20 (23%) | |
| Optical coherence tomographic parameters | |||
| Fibrous cap thickness (μm) | 44.1 ± 12.1 | 123.1 ± 60.0 | N/A |
| Number of quadrants containing lipid | N/A | ||
| <1 | 0 | 61 (72%) | |
| 1∼2 | 0 | 20 (24%) | |
| 2∼3 | 29 (78%) | 3 (3%) | |
| >3 | 8 (22%) | 1 (1%) | |
| Plaque rupture | 7 (19%) | 3 (4%) | 0.009 |
Multislice computed tomographic findings of the 2 groups are presented in Table 3 . Mean computed tomographic density of the lesion was lower in the TCFA group. Remodeling index was significantly larger in the TCFA group. Of 122 lesions, 22 lesions had no lipid content on optical coherence tomogram and thickness of fibrous cap of these lesions could not be measured. Extension of lipid content was associated with lower mean computed tomographic value and larger remodeling index ( Figure 4 ). Mean computed tomographic value was positively correlated and remodeling index was inversely correlated with fibrous cap thickness (r = 0.605, p <0.0001; r = −0.591, p <0.0001, respectively; Figure 5 ). Signet ringlike appearance was more common (62% vs 16%, p <0.0001) in the TCFA group compared to the non-TCFA group. There were no significant differences in mean computed tomographic density of the lumen and rate of spotty calcification ( Table 3 ).
| Variable | TCFA | Non-TCFA | p Value |
|---|---|---|---|
| Number of coronary lesions | 37 | 85 | |
| Vessel area at reference (mm 2 ) | 17.1 | 15.0 | 0.047 |
| Vessel area at minimum lumen diameter (mm 2 ) | 19.3 | 14.4 | <0.0001 |
| Remodeling index | 1.14 ± 0.20 | 0.95 ± 0.16 | <0.0001 |
| Computed tomographic density of plaque (HU) | 44.9 ± 19.2 | 78.7 ± 25.0 | <0.0001 |
| Computed tomographic density of lumen (HU) | 372.7 ± 62.8 | 374.7 ± 61.6 | 0.87 |
| Signet ringlike appearance | 24 (65%) | 14 (16%) | <0.0001 |
| Calcified lesion | |||
| Noncalcified | 24 (65%) | 52 (61%) | 0.70 |
| Spotty calcification | 12 (32%) | 25 (29%) | 0.64 |
| Large calcification | 1 (3%) | 8 (9%) | 0.15 |
Stay updated, free articles. Join our Telegram channel

Full access? Get Clinical Tree


