High-density lipoprotein (HDL) cholesterol and its apolipoproteins each capture unique lipid and cardiometabolic information important to risk quantification. It was hypothesized that metabolic factors, including insulin resistance and type 2 diabetes, would confound the association of HDL cholesterol with coronary artery calcification (CAC) and that apolipoprotein A-I (apoA-I) and/or apolipoprotein A-II (apoA-II) would add to HDL cholesterol in predicting CAC. Two community-based cross-sectional studies of white subjects were analyzed: the Penn Diabetes Heart Study (PDHS; n = 611 subjects with type 2 diabetes, 71.4% men) and the Study of Inherited Risk of Coronary Atherosclerosis (SIRCA; n = 803 subjects without diabetes, 52.8% men) using multivariable analysis of apoA-I, apoA-II, and HDL cholesterol stratified by diabetes status. HDL cholesterol was inversely associated with CAC after adjusting for age and gender in whites with type 2 diabetes (tobit ratio for a 1-SD increase in HDL cholesterol 0.58, 95% confidence interval [CI] 0.44 to 0.77, p <0.001) as well as those without diabetes (tobit ratio 0.72, 95% CI 0.59 to 0.88, p = 0.001). In contrast, apoA-I was a weaker predictor in subjects with (tobit ratio 0.64, 95% CI 0.45 to 0.90, p = 0.010) and without (tobit ratio 0.79, 95% CI 0.66 to 0.94, p = 0.010) diabetes, while apoA-II had no association with CAC. Control for metabolic variables, including triglycerides, waist circumference, and homeostasis model assessment of insulin resistance, attenuated these relations, particularly in subjects without diabetes. In likelihood ratio test analyses, HDL cholesterol added to apoA-I, apoA-II, and atherogenic apolipoprotein B lipoproteins but improved CAC prediction over metabolic factors only in subjects with diabetes. In conclusion, HDL cholesterol outperformed apoA-I and apoA-II in CAC prediction, but its association with CAC was attenuated by measures of insulin resistance.
There is growing interest in alternatives to high-density lipoprotein (HDL) cholesterol measurement, and data indicate that metabolic markers confound the inverse link of HDL parameters to atherosclerotic coronary heart disease (CHD). In studies of subjects with and without type 2 diabetes mellitus (T2DM) and free of clinical CHD, we examined the associations of HDL parameters with coronary artery calcification (CAC), a quantitative index of atherosclerotic burden that strongly correlates with risk for CHD. We addressed the hypotheses that apolipoprotein A-I (apoA-I) and/or apolipoprotein A-II (apoA-II) add to HDL cholesterol in CAC prediction and that metabolic factors, particularly measures of insulin resistance, confound the association of HDL parameters with CAC.
Methods
Details of the Penn Diabetes Heart Study (PDHS) and the Study of Inherited Risk of Coronary Atherosclerosis (SIRCA) have been described previously, including in our report that apolipoprotein B is superior to low-density lipoprotein cholesterol in predicting CAC in T2DM. These community-based cross-sectional studies were coordinated at the University of Pennsylvania using the same research center, staff, computed tomographic scanner, and lipid laboratory. Inclusion criteria included age fourth to eighth decades and a family history of premature CHD in SIRCA or the presence of T2DM in PDHS. Exclusion criteria included a clinical history of CHD (as evidenced by myocardial infarction, coronary revascularization, angiographic disease, or positive stress test results), elevated creatinine in both studies and, in SIRCA only, the presence of T2DM. This report focuses on unrelated white subjects (n = 611 with and n = 803 without T2DM). The studies were approved by the University of Pennsylvania institutional review board, and informed consent was obtained from all participants.
Participants were evaluated at the General Clinical Research Center of the University of Pennsylvania Medical Center after a 12-hour overnight fast. In the University of Pennsylvania’s Centers for Disease Control and Prevention–certified lipid laboratory, standard lipid panels and apolipoproteins were measured enzymatically (Cobas Fara II; Roche Diagnostic Systems, Somerville, New Jersey) in lipoprotein fractions after ultracentrifugation (β-quantification technique) in PDHS and in whole serum in SIRCA. ApoA-I, apoA-II, and high-sensitivity C-reactive protein were assayed by immunoturbidimetric assays. Plasma levels of leptin, adiponectin, and insulin were measured by enzyme-linked immunosorbent assays (Linco Research, St. Charles, Missouri). Laboratory test results were generated by personnel blinded to the clinical characteristics and CAC scores of research subjects.
Clinical parameters, including blood pressure, body mass index, and waist circumference were assessed as previously reported. Framingham risk scores were calculated using low-density lipoprotein cholesterol (similar results were obtained using total cholesterol). Homeostasis model assessment of insulin resistance (HOMA-IR; fasting glucose [mmol/L] × fasting insulin [mU/ml]/22.5) was used as a measure of insulin resistance. Subjects with T2DM taking insulin were excluded for the calculation of HOMA-IR, yielding a sample size of 513. Subjects were classified as having metabolic syndrome using the revised National Cholesterol Education Program definition (glucose cut point 100 mg/dl). All subjects with T2DM were assumed to meet the metabolic syndrome criterion for glycemia. Global Agatston CAC scores were quantified by electron-beam computed tomography, as described.
Data are reported as median (interquartile range) or as mean ± SD for continuous variables and as proportions for categorical variables. Chi-square and Mann-Whitney tests were used to compare variables by T2DM status. The crude association of apolipoproteins and HDL cholesterol with lipid, metabolic, and inflammatory parameters was examined by Spearman’s correlation.
Multivariable analysis of CAC scores was performed using tobit conditional regression to accommodate the unusual distribution of CAC data (many zero scores but also a marked right skew). Tobit regression combines a logistic regression of the presence of CAC (any CAC present vs CAC zero score) with a linear regression (of log-transformed CAC) when CAC is present to produce a single estimate for the relation of risk factors with CAC data. A tobit ratio of 0.80 indicates a 20% reduction in the CAC score for every SD increase in a lipid parameter. Multivariable associations of apoA-I, apoA-II, and HDL cholesterol levels with CAC were assessed in incremental tobit models: model 1 was adjusted for age and gender; model 2 was additionally adjusted for medications (statins, niacin, fibrates, insulin, metformin, thiazolidinediones, sulfonylureas, and, in women, hormone replacement therapy; each medication was adjusted for individually), systolic and diastolic blood pressure, low-density lipoprotein cholesterol, tobacco use, alcohol use, exercise, family history of premature CHD, body mass index, waist circumference, triglycerides, adiponectin, leptin, and high-sensitivity C-reactive protein; model 3 added HOMA-IR (subjects taking insulin were excluded from T2DM analyses). Given significant interaction by T2DM status for HDL cholesterol association with CAC (interaction p = 0.007 in age- and gender-adjusted model, p = 0.035 in fully adjusted model), results are stratified by T2DM status. Non-normal variables were log transformed (triglycerides, leptin, high-sensitivity C-reactive protein, and HOMA-IR).
Interactions of apolipoproteins and HDL cholesterol with T2DM, gender, statin use, and triglycerides in association with CAC were assessed by likelihood ratio testing. We applied likelihood ratio testing in nested models to assess the incremental value of apoA-I, apoA-II, and HDL cholesterol over other lipoprotein parameters as well as measures of insulin resistance and adiposity in predicting CAC scores. Statistical analyses were performed using Stata version 10.0 (StataCorp LP, College Station, Texas).
Results
Table 1 lists study sample characteristics by T2DM status. Subjects with T2DM were older, were more likely male, were more obese, had a greater a prevalence of metabolic syndrome, and had lower insulin sensitivity as assessed by HOMA-IR. Total and low-density lipoprotein cholesterol were lower in those with T2DM, likely because of greater statin use. ApoA-I, apoA-II, and HDL cholesterol levels were significantly lower in patients with T2DM versus subjects without T2DM. In those with T2DM, median glycosylated hemoglobin was 6.8%. A difference in the presence of CAC by T2DM status disappeared after age and gender adjustment in logistic regression (p = 0.79). Referencing subjects aged ≥45 years to Multi-Ethnic Study of Atherosclerosis (MESA) percentiles, our median woman with T2DM was at the 69th percentile, median man with T2DM at the 72nd percentile, median woman without T2DM at the 76th percentile, and median man without T2DM at the 78th percentile, suggesting that family history of premature CAD and T2DM are associated with higher CAC burden.
| Variable | Subjects Without T2DM | Subjects With T2DM | p Value |
|---|---|---|---|
| (n = 803) | (n = 611) | ||
| Age (years) | 48 (42–54) | 60 (54–68) | <0.001 |
| Men | 52.8% | 71.4% | <0.001 |
| Alcohol use | 67.8% | 58.4% | <0.001 |
| Current smoker | 11.3% | 8.4% | 0.07 |
| HDL cholesterol (mg/dl) | 48 (39–59) | 45 (37–53) | <0.001 |
| ApoA-I (mg/dl) | 128 (110–150) | 124 (113–137) | <0.001 |
| ApoA-II (mg/dl) | 34 (31–37) | 32 (29–35) | <0.001 |
| Total cholesterol (mg/dl) | 205 (177–228) | 174 (152–198) | <0.001 |
| Triglycerides (mg/dl) | 117 (87–159) | 134 (92–197) | <0.001 |
| Low-density lipoprotein cholesterol (mg/dl) | 126 (103–148) | 97 (79–119) | <0.001 |
| ApoB (mg/dl) | 98 (84–114) | 82 (71–94) | <0.001 |
| ApoB/apoA-I ratio | 0.76 (0.61–0.94) | 0.66 (0.55–0.77) | <0.001 |
| Blood pressure (mm Hg) | |||
| Systolic | 126 (117–136) | 131 (122–140) | <0.001 |
| Diastolic | 77 (72–84) | 75 (71–81) | <0.001 |
| Body mass index (kg/m 2 ) | 27 (24–30) | 32 (28–36) | <0.001 |
| Waist circumference (cm) | 89 (81–99) | 107 (98–117) | <0.001 |
| Metabolic syndrome | 25.8% | 76.6% | <0.001 |
| Leptin (ng/ml) | 8.4 (4.5–16.4) | 11.7 (6.5–20.9) | <0.001 |
| Adiponectin (μg/ml) | 16.4 (11.6–24.6) | 9.1 (6.1–14.9) | <0.001 |
| HOMA-IR | 1.4 (0.9–2.1) | 4.2 (2.8–6.2) | <0.001 |
| High-sensitivity C-reactive protein (mg/dl) | 1.2 (0.5–2.6) | 1.6 (0.8–3.4) | <0.001 |
| Interleukin-6 (pg/ml) | 1.3 (0.8–1.9) | 1.3 (0.8–2.1) | 0.34 |
| 10-year Framingham risk | 5% (3%–8%) | 13% (8%–20%) | <0.001 |
| Medications | |||
| Statin | 14.0% | 57.5% | <0.001 |
| Niacin | 3.0% | 5.6% | 0.02 |
| Fibrate | 1.1% | 10.0% | <0.001 |
| Insulin | 14.9% | ||
| Metformin | 63.8% | ||
| Thiazolidinedione | 27.3% | ||
| Sulfonylurea | 40.3% | ||
| Hormone replacement therapy (women) | 28.2% | 45.1% | <0.001 |
| CAC | 3 (0–45) | 89 (1–456) | <0.001 |
| >0 | 68.9% | 75.3% | 0.008 |
| >100 | 16.4% | 49.1% | <0.001 |
| ln(CAC) if CAC >0 | 2.8 ± 2.1 | 5.2 ± 1.8 | <0.001 |
Supplementary Appendix : Table A1 lists Spearman’s correlations for the interrelation of HDL cholesterol, apoA-I, and apoA-II and their relations with other CHD risk factors by T2DM status. Correlation of HDL cholesterol was higher with apoA-I compared to apoA-II (p <0.001 in subjects with and without T2DM). Triglycerides, adiposity, and HOMA-IR were inversely correlated with HDL cholesterol and apoA-I and less so with apoA-II in subjects with and without T2DM. HDL cholesterol and its apolipoproteins were correlated modestly, or not at all, with high-sensitivity C-reactive protein.
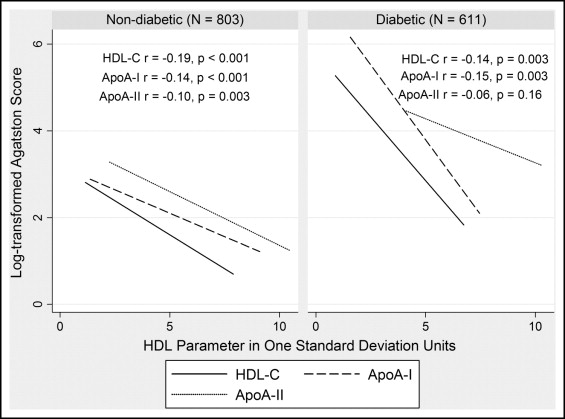
Unadjusted inverse correlations of HDL parameters with CAC are shown in Figure 1 by diabetes status. HDL cholesterol was inversely associated with CAC after adjusting for age and gender in whites with and without T2DM ( Table 2 , model 1). In contrast, apoA-I displayed a weaker inverse relation in subjects with and without T2DM, while apoA-II had no association with CAC. After adjustment for risk factors, the associations of HDL cholesterol and apoA-I with CAC were attenuated ( Table 2 , model 2) with a trend for HDL cholesterol prediction of CAC remaining in those with T2DM but not those without T2DM. This difference was not explained by the higher risk factor milieu in T2DM, as the association of HDL cholesterol with CAC was stronger in subjects with T2DM below the median level of Framingham risk (tobit ratio 0.53, 95% confidence interval 0.29 to 0.95, p = 0.03 in model 2).
| Variables Adjusted for | Ratio in Subjects Without T2DM (95% CI) | Ratio in Subjects With T2DM (95% CI) | ||
|---|---|---|---|---|
| (n = 803) | p Value | (n = 611) | p Value | |
| HDL cholesterol | ||||
| Age, gender | 0.72 (0.59–0.88) | 0.001 | 0.58 (0.44–0.77) | <0.001 |
| Age, gender, medications, BP, LDL-C, tob, EtOH, exercise, FH, RF | 0.89 (0.70–1.11) | 0.30 | 0.72 (0.51–1.02) | 0.07 |
| Age, gender, medications, BP, LDL-C, tob, EtOH, exercise, FH, RF, HOMA-IR | 0.90 (0.72–1.14) | 0.40 | 0.84 (0.58–1.22) | 0.36 |
| ApoA-I | ||||
| Age, gender | 0.79 (0.66–0.94) | 0.01 | 0.64 (0.45–0.90) | 0.01 |
| Age, gender, medications, BP, LDL-C, tob, EtOH, exercise, FH, RF | 0.86 (0.71–1.04) | 0.11 | 0.82 (0.57–1.16) | 0.26 |
| Age, gender, medications, BP, LDL-C, tob, EtOH, exercise, FH, RF, HOMA-IR | 0.88 (0.73–1.07) | 0.19 | 0.92 (0.63–1.32) | 0.64 |
| ApoA-II | ||||
| Age, gender | 0.87 (0.72–1.05) | 0.16 | 0.96 (0.76–1.21) | 0.75 |
| Age, gender, medications, BP, LDL-C, tob, EtOH, exercise, FH, RF | 0.83 (0.68–1.01) | 0.06 | 0.88 (0.68–1.13) | 0.32 |
| Age, gender, medications, BP, LDL-C, tob, EtOH, exercise, FH, RF, HOMA-IR | 0.83 (0.69–1.01) | 0.06 | 0.91 (0.70–1.18) | 0.49 |
The associations of HDL parameters with CAC in T2DM was attenuated further after adjusting for HOMA-IR (analysis excluded subjects taking insulin; Table 2 , model 3). When confounders from Table 2 beyond age and gender were examined individually, metabolic variables, namely, triglycerides, body mass index, waist circumference, and HOMA-IR, most strongly attenuated HDL parameter associations with CAC ( Supplementary Appendix Table A2). In fact, with baseline control for age and gender, further adjustment for any 1 of these 4 metabolic factors led to complete loss of the association of HDL cholesterol with CAC in subjects without T2DM. In contrast, relative to an age- and gender-controlled model of CAC prediction by HDL cholesterol ( Table 2 , model 1), further adjustment for high-sensitivity C-reactive protein did not substantially alter estimates: 0.56 (95% confidence interval 0.42 to 0.74, p <0.001) in subjects with T2DM and 0.75 (95% confidence interval 0.62 to 0.92, p = 0.005) in those without T2DM (similarly, there was no significant attenuation by high-sensitivity C-reactive protein on the association of apoA-I with CAC in model 1).
Table 3 lists findings, stratified by diabetes status, for the incremental value of adding HDL cholesterol, apoA-I, or apoA-II to one another or additional lipid and metabolic parameters. To a greater extent in T2DM, HDL cholesterol improved CAC prediction when added to apoA-I, apoA-II, total cholesterol, low-density lipoprotein cholesterol, and apolipoprotein B. In patients with T2DM, but not in those without, HDL cholesterol added to triglycerides, waist circumference, and HOMA-IR in predicting CAC. In contrast, neither apoA-I nor apoA-II added value to HDL cholesterol, waist circumference, or HOMA-IR. In a CAC model adjusted for age, gender, medications, and diabetes, adding the apolipoprotein B/apoA-I ratio provided essentially the same predictive value as adding apolipoprotein B alone (likelihood ratio test chi-squares 31.7 and 32.9, respectively, p <0.001 for both), whereas when apoA-I was added as an individual variable to apolipoprotein B in this same model, it provided incremental value (chi-square 6.3, p <0.001).
Stay updated, free articles. Join our Telegram channel

Full access? Get Clinical Tree


