We conducted a formal meta-analysis of peer-reviewed, published, randomized studies comparing intravascular ultrasound (IVUS)-guidance and angiographic-guided bare metal stent implantation. A total of 8 studies were identified. Because the Balloon Equivalent to Stent (BEST) study was a noninferiority trial designed to compare 2 very different percutaneous coronary intervention strategies—IVUS-guided aggressive balloon angioplasty (with bail-out stenting) and angiographic-guided deliberate bare metal stent implantation—it was eliminated. An unadjusted random-effects meta-analysis was used to compare the IVUS-guided and non–IVUS-guided stenting in the 7 remaining studies. A total of 2,193 patients were randomized in 5 multicenter and 2 single-center studies. IVUS guidance was associated with a significantly larger postprocedure angiographic minimum lumen diameter. The mean difference was 0.12 mm (95% confidence interval [CI] 0.06 to 0.18, p <0.0001). IVUS guidance was also associated with a significantly lower rate of 6-month angiographic restenosis (22% vs 29%, odds ratio 0.64, 95% CI 0.42 to 0.96, p = 0.02), a significant reduction in the revascularization rate (13% vs 18%, odds ratio 0.66, 95% CI 0.48 to 0.91, p = 0.004), and overall major adverse cardiac events (19% vs. 23%, odds ratio 0.69, 95% CI 0.49 to 0.97, p = 0.03). However, no significant effect was seen for myocardial infarction (p = 0.51) or mortality (p = 0.18). In conclusion, IVUS guidance for bare metal stent implantation improved the acute procedural results (angiographic minimum lumen diameter) and thereby reduced angiographic restenosis and repeat revascularization and major adverse cardiac events, with a neutral effect on death and myocardial infarction during a follow-up period of 6 months to 2.5 years.
The intravascular ultrasound (IVUS) observations of Nakamura et al and Colombo et al fundamentally changed the methods used to implant stents, leading to randomized trials to assess the effect of IVUS guidance on stent implantation, often with conflicting results. Systematic reviews and meta-analyses have integrated the results of independent studies considered combinable to allow an objective appraisal of the evidence, provide a more precise estimate of the treatment effect, and explain the heterogeneity among individual studies. Since the publication of a previous meta-analysis, the Direct Stenting vs Optimal angioplasty (DIPOL) study, Angiography vs Intravascular Ultrasound-Directed (AVID) study, the Gaster study, and a long-term follow-up of the Restenosis after IVUS-Guided Stenting (RESIST) study have been published. This has brought to a close the era of randomized studies comparing IVUS and angiographic guidance of percutaneous coronary intervention (PCI) with bare metal stents (BMSs). It has been estimated that 30% of stents implanted worldwide are BMSs and not drug-eluting stents. Therefore, we report a formal meta-analysis of all peer-reviewed, published, randomized studies comparing IVUS-guided and angiographic-guided PCI in the pre-drug-eluting stent era.
Methods
We performed a MEDLINE search to identify all published, English-language, peer-reviewed studies published through December 31, 2009 that had performed a randomized comparison of IVUS-guided versus angiographic-guided PCI and/or BMS implantation in which the ≥6-month angiographic and/or clinical follow-up data were reported. The most comprehensive results were obtained by searching the term “IVUS+angiography” (n = 940 before 2010), manually reviewing the titles, searching the references cited in the original and review reports, and using the Citations Index to identify newer studies that had cited older publications. Nonrandomized studies and those reporting only acute results were excluded. We found 8 published, randomized IVUS vs angiographic studies. Two investigators (G.S.M. and H.P.) reviewed the studies; disagreements were resolved by consensus. Because the Balloon Equivalent to Stent (BEST) study was a noninferiority trial that compared 2 very different PCI strategies—IVUS-guided aggressive balloon angioplasty (with bail-out stenting) and angiographic-guided deliberate BMS implantation —it was not included.
An unadjusted random-effects meta-analysis was used to compare IVUS- versus non–IVUS-guided stenting. The random effects model took into account the heterogeneity among the studies by assuming that the individual study effects were drawn from a random distribution. The test of heterogeneity using the Q statistic was computed, and the I 2 statistic was calculated to quantify the amount of heterogeneity. The results from the fixed effects model were computed for comparison. The binary variables were summarized as the frequencies or percentages, and continuous variables were summarized as the mean (±SD or range). For binary outcomes, the odds ratio (OR) was used for comparative purposes. For continuous variables, the treatment effect was assessed by way of the differences. The OR and 95% confidence intervals (CIs) were calculated for the clinical outcomes according to the intent to treat and for angiographic binary restenosis according to the patients who returned for angiographic follow-up. Forest plots of the OR for binary outcomes and of the mean differences for continuous variables were constructed, with the sizes of the boxes proportional to the number of patients in the individual studies. The null hypothesis of a nonzero treatment effect was examined using the directional test versus the alternative hypothesis that all effects would be equal to the same nonzero alternative. p Values <0.05 were considered statistically significant. To assess the potential publication bias, funnel plots were constructed by plotting the precision (the inverse of the standard error) against the log OR or the mean difference; and the Begg rank correlation test was computed.
Results
The baseline characteristics of the studies and patients are listed in Tables 1 and 2 , respectively, and were well matched in all 7 studies. A total of 2,193 patients were randomized in 5 multicenter and 2 single-center IVUS- versus angiographic-guided PCI studies.
| Characteristic | DIPOL ⁎ | AVID | Gaster Study | RESIST | TULIP | OPTICUS | SIPS |
|---|---|---|---|---|---|---|---|
| Multicenter | Yes | Yes | No | Yes | No | Yes | No |
| Total study size | 163 | 800 | 108 | 155 | 150 | 548 | 269 |
| Angiographic follow-up | Yes | No | Yes | Yes | Yes | Yes | Yes |
| Duration (mo) | 6 | 6 | 6 | 6 | 6 | 6 | |
| Total follow-up duration | 6 mo | 12 mo | 2.5 yrs † | 18 mo | 12 mo | 12 mo | 2 yrs |
⁎ DIPOL study had 3 groups: group 1, direct stenting guided by quantitative coronary angiography; group 2, direct stenting guided by IVUS; and group 3, optimal balloon angioplasty guided by IVUS; the present analysis only compared groups 1 and 2.
| Variable | DIPOL ⁎ | AVID | Gaster | RESIST | TULIP | OPTICUS | SIPS |
|---|---|---|---|---|---|---|---|
| Patients (n) | |||||||
| Intravascular ultrasound guidance | 83 | 406 | 54 | 79 | 74 | 273 | 121 |
| Nonintravascular ultrasound guidance | 80 | 394 | 54 | 76 | 76 | 275 | 148 |
| Men | |||||||
| Intravascular ultrasound guidance | 71% | 73% | 100% | 86% | 71% | 77% | 82% |
| Nonintravascular ultrasound guidance | 73% | 68% | 100% | 93% | 72% | 78% | 76% |
| Age (years) | |||||||
| Intravascular ultrasound guidance | 56 ± 8 | 62 ± 12 | 57 (40–73) | 57 ± 10 | 61 ± 10 | 60.1 ± 10 | 61.2 ± 8.1 |
| Nonintravascular ultrasound guidance | 54 ± 8 | 63 ± 11 | 57 (33–78) | 56 ± 12 | 63 ± 10 | 61.5 ± 9.5 | 60.7 ± 9.6 |
| Ejection fraction (%) | |||||||
| Intravascular ultrasound guidance | 52 ± 9 | 53 ± 13 | 65 ± 12 | 53 ± 13 | NA | 56.5 ± 14 | NA |
| Nonintravascular ultrasound guidance | 48 ± 10 | 55 ± 13 | 69 ± 12 | 51 ± 9 | NA | 57.7 ± 14.3 | NA |
| Previous myocardial infarction | |||||||
| Intravascular ultrasound guidance | 44% | 35% | 54% | 68% | NA | 32% | 58% |
| Nonintravascular ultrasound guidance | 40% | 29% | 44% | 63% | NA | 32% | 52% |
| Smoker | |||||||
| Intravascular ultrasound guidance | 47% † | NA | 30% ‡ | 55% | 40% | 69% | 47% ‡ |
| Nonintravascular ultrasound guidance | 52% † | NA | 15% ‡ | 51% | 43% | 66% | 45% ‡ |
| Diabetes mellitus | |||||||
| Intravascular ultrasound guidance | 10% | 15% | 4% | 9% | 16% | 17% | 16% |
| Nonintravascular ultrasound guidance | 11% | 17% | 11% | 8% | 21% | 17% | 16% |
| Hypertension | |||||||
| Intravascular ultrasound guidance | NA | 46% | 20% | 24% | 27% | 48% | 64% |
| Nonintravascular ultrasound guidance | NA | 45% | 24% | 26% | 30% | 52% | 56% |
| Dyslipidemia | |||||||
| Intravascular ultrasound guidance | 47% | 40% | 96% | 54% | 61% | 61% | 88% |
| Nonintravascular ultrasound guidance | 40% | 44% | 93% | 52% | 62% | 67% | 87% |
| American College of Cardiology/American Heart Association B2/C lesions | |||||||
| Intravascular ultrasound guidance | 13% | NA | 47% | 43% | 100% | 76% | 51% |
| Nonintravascular ultrasound guidance | 10% | NA | 46% | 48% | 100% | 78% | 42% |
| Left anterior descending artery | |||||||
| Intravascular ultrasound guidance | 41% | 40% | 48% | 48% | 39% | 51% | 38% |
| Nonintravascular ultrasound guidance | 46% | 37% | 46% | 47% | 38% | 50% | 41% |
| Left circumflex artery | |||||||
| Intravascular ultrasound guidance | 26% | 15% | 24% | 11% | 10% | 18% | 27% |
| Nonintravascular ultrasound guidance | 24% | 18% | 26% | 11% | 21% | 14% | 27% |
| Right coronary artery | |||||||
| Intravascular ultrasound guidance | 33% | 35% | 28% | 41% | 51% | 30% | 30% |
| Nonintravascular ultrasound guidance | 30% | 32% | 28% | 42% | 41% | 35% | 30% |
| Saphenous vein graft | |||||||
| Intravascular ultrasound guidance | 10% | 5% | |||||
| Nonintravascular ultrasound guidance | 12% | 3% | |||||
| Left main coronary artery | |||||||
| Intravascular ultrasound guidance | 0.8% | ||||||
| Nonintravascular ultrasound guidance | 0.5% |
⁎ DIPOL study had 3 groups: group 1, direct stenting guided by quantitative coronary angiography; group 2, direct stenting guided by IVUS; and group 3, optimal balloon angioplasty guided by IVUS; the present analysis only compared groups 1 and 2.
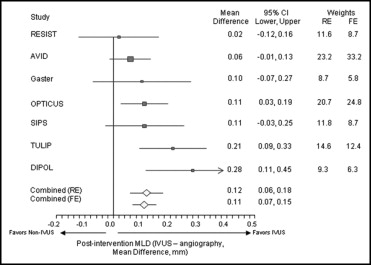
All 7 studies included data on the postprocedure angiographic minimum lumen diameter ( Table 3 ). As shown in Figure 1 , IVUS guidance was associated with a significantly larger postprocedure angiographic minimum lumen diameter; the mean difference was 0.12 mm (95% CI 0.06 to 0.18, p <0.0001).
| Variable | DIPOL ⁎ | AVID † | Gaster ⁎ | RESIST ⁎ | TULIP ⁎ | OPTICUS ⁎ ‡ | SIPS |
|---|---|---|---|---|---|---|---|
| Lesions (n) | |||||||
| Intravascular ultrasound guidance | 83 | 406 | 54 | 79 | 73 | 229 | 166 |
| Nonintravascular ultrasound guidance | 80 | 394 | 54 | 76 | 71 | 228 | 190 |
| Stented | |||||||
| Intravascular ultrasound guidance | 100% | 100% | 87% | 100% | 97% | 97% | 50% |
| Nonintravascular ultrasound guidance | 100% | 100% | 85% | 100% | 96% | 99% | 50% |
| Angiography | |||||||
| Lesion length (mm) | |||||||
| Intravascular ultrasound guidance | NA | 13.0 ± 7.7 | 13.4 ± 11.7 | 7.7 ± 3.5 | 27 ± 9 | 11.9 ± 5.1 | 9.7 ± 6.4 |
| Nonintravascular ultrasound guidance | NA | 13.0 ± 7.8 | 13.3 ± 9.2 | 8.0 ± 4.0 | 29 ± 10 | 11.6 ± 5.5 | 9.7 ± 5.5 |
| Reference diameter (mm) § | |||||||
| Intravascular ultrasound guidance | 3.21 ± 0.64 | 3.05 ± 0.64 | 2.8 ± 0.5 | p: .94 ± 0.57; d: 3.06 ± 0.59 | 2.95 ± 0.57 | 2.97 ± 0.53 | 3.01 ± 0.59 |
| Nonintravascular ultrasound guidance | 3.19 ± 0.59 | 3.00 ± 0.54 | 2.8 ± 0.5 | p: 2.88 ± 0.58; d: 2.90 ± 0.49 | 2.96 ± 0.53 | 3.01 ± 0.51 | 3.00 ± 0.7 |
| Preintervention minimum lumen diameter (mm) | |||||||
| Intravascular ultrasound guidance | 0.97 ± 0.33 | 1.11 ± 0.5 | 1.1 ± 0.6 | 0.96 ± 0.37 | 1.02 ± 0.42 | 0.96 ± 0.35 | 0.64 ± 0.46 |
| Nonintravascular ultrasound guidance | 0.95 ± 0.32 | 1.09 ± 0.47 | 1.0 ± 0.5 | 1.02 ± 0.44 | 0.99 ± 0.41 | 0.99 ± 0.34 | 0.70 ± 0.55 |
| Postintervention minimum lumen diameter (mm) | |||||||
| Intravascular ultrasound guidance | 3.34 ± 0.55 | 2.93 ± 0.55 | 2.3 ± 0.4 | 2.48 ± 0.43 | 3.01 ± 0.40 | 3.02 ± 0.49 | 2.49 ± 0.66 |
| Nonintravascular ultrasound guidance | 3.06 ± 0.52 | 2.87 ± 0.48 | 2.2 ± 0.5 | 2.46 ± 0.46 | 2.80 ± 0.31 | 2.91 ± 0.41 | 2.38 ± 0.67 |
| Preintervention diameter stenosis (%) | |||||||
| Intravascular ultrasound guidance | 69.7 ± 14.2 | 63.4 ± 14.1 | 60 ± 17 | 65 ± 11 | 65 ± 13 | 67.6 ± 11.2 | 79.1 ± 13.8 |
| Nonintravascular ultrasound guidance | 70.2 ± 11.4 | 63.5 ± 14.3 | 64 ± 18 | 64 ± 12 | 65 ± 10 | 66.7 ± 10.1 | 76.8 ± 17.6 |
| Postintervention diameter stenosis (%) | |||||||
| Intravascular ultrasound guidance | 3.4 ± 2.9 | NA | 27 ± 10 | 19 ± 10 | 12 ± 7 | 2.8 ± 7.8 | 18.8 ± 17.3 |
| Nonintravascular ultrasound guidance | 8.9 ± 5.4 | NA | 26 ± 14 | 19 ± 9 | 13 ± 9 | 6.0 ± 8.0 | 22.5 ± 19.7 |
| Intravascular ultrasound | |||||||
| Achievement of intravascular ultrasound criteria | |||||||
| Intravascular ultrasound guidance | NA | 44% | 64% | 80% | NA | 56% | NA |
| Nonintravascular ultrasound guidance | NA | 36% | 16% | 59% | NA | NA | NA |
| Final minimum stent area (mm 2 ) | |||||||
| Intravascular ultrasound guidance | 9.8 ± 2.88 | 7.55 ± 2.82 | 8.7 ± 2.5 | 7.95 ± 2.21 | NA | 8.1 ± 2.3 | 7.95 ± 2.37 |
| Nonintravascular ultrasound guidance | NA | 6.9 ± 2.43 | 6.9 ± 2.1 | 7.16 ± 2.48 | NA | NA | NA |
† Reported for in-stent only, by patient; N = number of patients.
‡ Reported for angiographic follow-up group only in OPTICUS (IVUS n = 229, non-IVUS n = 228).
§ Mean of proximal and distal except for RESIST study, for which proximal (p) and distal (d) were reported separately.
Of the 7 studies, 6 had routine angiographic follow-up data available at 6 months and reported the restenosis rates ( Table 4 ). The exception was AVID that did not include routine angiographic follow-up data. As shown in Figure 2 , IVUS guidance was associated with a significantly lower rate of 6-month angiographic restenosis (22% vs 29%, OR 0.64, 95% CI 0.42 to 0.96, p = 0.02).
| End Point | DIPOL ⁎ | AVID | Gaster | RESIST | TULIP | OPTICUS | SIPS | Overall |
|---|---|---|---|---|---|---|---|---|
| Intention to treat (n) | ||||||||
| Intravascular ultrasound | 83 | 375 | 54 | 79 | 73 | 273 | 121 | 1,058 |
| Nonintravascular ultrasound | 80 | 369 | 54 | 76 | 71 | 275 | 148 | 1,073 |
| Revascularization (n) | TLR | TLR | TVR | Any | TLR | PCI + CABG | Clinically driven TLR | |
| Intravascular ultrasound | 3 (3.6%) | 30 (8.1%) | 10 (19%) | 21 (27%) | 7 (10%) | 41 (15%) | 21 (17%) | 133 (13%) |
| Nonintravascular ultrasound | 6 (7.5%) | 45 (12%) | 18 (33%) | 31 (41%) | 17 (23%) | 38 (14%) | 43 (29%) | 198 (18%) |
| Major adverse cardiac events (n) | Death, MI, repeat coronary revascularization | TLR, death, MI, stent thrombosis, CABG | Death, QMI, repeat PCI, CABG | Cardiac events † | Death, MI, TLR | Death, QMI, NQMI, repeat PCI, CABG | Death, QMI, clinically driven TLR, nonclinically driven revascularization | |
| Intravascular ultrasound | 6 (7.3%) | 68 (18%) | 11 (22%) | 20 (25%) | 9 (12%) | 49 (18%) | 37 (30%) | 201 (19%) |
| Nonintravascular ultrasound | 13 (16%) | 70 (19%) | 22 (41%) | 28 (37%) | 19 (27%) | 42 (15%) | 55 (37%) | 249 (23%) |
| Mortality (n) | ||||||||
| Intravascular ultrasound | 1 (1.2%) | 12 (3.3%) | 0 (0%) | 1 (1.3%) | 2 (2.7%) | 5 (1.8%) | 4 (3.3%) | 25 (2.4%) |
| Nonintravascular ultrasound | 1 (1.25%) | 7 (1.9%) | 2 (3.7%) | 1 (1.3%) | 1 (1.4%) | 1 (0.4%) | 4 (2.7%) | 17 (1.6%) |
| Myocardial infarction (n) | MI | MI | QMI | MI (6 mo) ‡ | MI | MI | ||
| Intravascular ultrasound | 1 (1.2%) | 25 (6.8%) | 1 (2%) | NA | 1 (1%) | 6 (2.2%) | 1 (0.8%) | 35 (3.6%) |
| Nonintravascular ultrasound | 4 (5%) | 19 (5.1%) | 0 (0%) | NA | 5 (7%) | 10 (3.6%) | 6 (3.4%) | 44 (4.4%) |
| Angiographic follow-up (n) | ||||||||
| Intravascular ultrasound | 73 | NA | 51 | 71 | 64 | 229 | 93 | 581 |
| Nonintravascular ultrasound | 67 | NA | 52 | 73 | 61 | 228 | 117 | 598 |
| Restenosis (n) | ||||||||
| Intravascular ultrasound | 7/73 (10%) | NA | 8/51 (16%) | 16/71 (23%) | 15/64 (23%) | 56/229 (25%) | 27/93 (29%) | 129 (22%) |
| Nonintravascular ultrasound | 18/67 (27%) | NA | 13/52 (25%) | 21/73 (29%) | 28/61 (46%) | 52/228 (23%) | 41/117 (35%) | 173 (29%) |
Stay updated, free articles. Join our Telegram channel

Full access? Get Clinical Tree


