A process to identify and target a selected population at risk of heart failure (HF) could facilitate screening and prevention. We sought to develop an effective screening process from clinical characteristics, functional capacity, and electrocardiogram (ECG). Asymptomatic subjects ≥65 years, with ≥1 HF risks were recruited from the community. Subjects with valvular disease, ejection fraction <40%, and atrial fibrillation were excluded. All underwent clinical evaluation including assessment of HF risk using Framingham HF score and Atherosclerosis Risk in Communities (ARIC) score, ECG, echocardiography, and 6-minute walk (6 MW) test. After 14 ± 4 months, new HF was assessed using Framingham criteria. A randomly selected derivation cohort was used to integrate ARIC score and 6 MW in a classification and regression tree (CART) analysis, with the remaining population used for validation. Of the 419 subjects (age 70 ± 5; 48% men), 52 developed HF. ARIC was more effective than the Framingham HF score (area under the curve 0.65 vs 0.53, p = 0.01). CART selected ARIC (>9.5%) and 6 MW (<501 m) as cutoffs to define low-, intermediate-, and high-risk groups. Abnormal ECG further divided the intermediate group into high and low risks. The 134 subjects identified as high risk by a combined clinical and electrocardiographic strategy showed more echocardiographic features of cardiac dysfunction including LV mass, mitral e′, mitral E/e′, and longitudinal strain (p <0.01). New HF was significantly more frequent than in the remaining patients (20% vs 10%, p = 0.003; hazard ratio 2.08, 95% confidence interval 1.21 to 3.57, p = 0.008). Thus, initial clinical risk and electrocardiographic assessment facilitate effective HF screening by identifying a high-risk group.
The prevalence and costs of congestive heart failure (HF) remain high and are predicted to further increase. Previous randomized trials have shown that early intervention can delay or prevent the onset of overt HF in patients with reduced left ventricular ejection fraction (LVEF). However, the epidemiology of HF is changing, with increasing numbers of patients with normal LVEF. In these patients, features of stage B HF (SBHF) may be detected by left ventricular hypertrophy (LVH), abnormal diastolic function, or impaired global longitudinal systolic strain (GLS). However, community-wide screening using echocardiography has not been justified. An alternative would be a selective screening strategy of defining “at-risk” subjects by simple clinical evaluation with subsequent echocardiography. Several community-based HF risk scores have been developed. The Framingham Heart Score (FHS) and Atherosclerosis Risk in Communities (ARIC) scores are based on clinical information that is readily available in primary care settings. Likewise, the 6-minute walk (6 MW) test is a simple and feasible test with previous work showing improved risk assessment in SBHF. As discordance between subjective symptoms and measured exercise capacity is common, we hypothesized that the combination of clinical and functional variables would (1) correlate with the degree of underlying cardiac dysfunction as shown by echocardiography and (2) predict HF better with than without functional capacity. We sought to explore these hypotheses in a community-based study of ≥65-year-old subjects with risk factors but no symptoms of HF.
Methods
Participants were voluntarily enrolled through presentations to local community groups and media advertising. Data were collected prospectively from subjects ≥65 years, living in the community, based on the presence of ≥1 HF risk factors: (1) hypertension (based on systolic blood pressure [SBP] >140 mm Hg and self-report of hypertension including antihypertensive medication, (2) type 2 diabetes mellitus (based on self-report of diagnosis including medical management), (3) obesity (body mass index [BMI] ≥30), (4) previous chemotherapy, (5) family history of HF, and (6) history of heart disease (but not existing HF). We excluded subjects with (1) symptoms or a known history of HF, (2) known coronary artery disease (CAD), (3) more than moderate valvular heart disease, (4) reduced LVEF (<40%) on baseline echo, (5) atrial fibrillation, and (6) inability to acquire interpretable images at baseline. This study was performed in accordance with a research protocol approved by the Tasmanian Human Research Ethics Committee. Individual written informed consent was obtained from participants after explanation of the nature and purpose, complexity, and level of risk of the study.
Data were collected prospectively at facilities in the community, from all participants enrolled in the study. All underwent a physical examination and symptom questionnaire. They also underwent a standard 12-lead electrocardiogram (ECG), a comprehensive transthoracic echocardiogram, and 6 MW test. Blood pressure was measured twice after 10 minutes of rest in the supine position. Data were also collected on socioeconomic indicators, complete medical history, and family history of HF.
The FHS and ARIC risk scores were used to calculate the absolute risk of HF for all subjects. Calculation of FHS score (4-year probability of HF) was performed using 9 common clinical variables including age, gender, prevalence of CAD, diabetes and valve disease, LVH on ECG, SBP, heart rate, and BMI. For the ARIC score, we adopted the on-line ARIC Heart Failure Risk Calculator, which uses the 10 most common clinical variables including age, race, gender, SBP, current use of blood pressure-lowering medication, smoking status, heart rate and BMI, prevalent CAD, and diabetes. We made minor modifications (using open-source code) to permit quantification of risk at 4 years.
Functional capacity was measured in the community using 6 MW following a standardized protocol. A 25-m flat, obstacle-free corridor was used, with visible markers at each meter interval and stop coins placed at either end. Participants were instructed to walk at the best of their effort and walked unaccompanied. Mean peak VO 2 was estimated using an established equation. Age- and gender-adjusted functional capacities were estimated according to nomogram-based metabolic equivalents in men and women.
A standard 12-lead ECG was recorded at 25 mm/s and 1 mV/cm according to standard protocol. Electrocardiographic measurements were performed using MUSE software (GE Healthcare, Milwaukee, Wisconsin). Cornell product, defined as the product of QRS duration times Cornell voltage (R aVL + S V3 , plus 6 mm in women), was measured in all, and the reference value was derived from the seventy-fifth percentile of the study population, analogous to derivation in the Losartan Intervention For Endpoint reduction in hypertension (LIFE) study. In this work, a Cornell product >1,498 mm was deemed abnormal.
Standard transthoracic 2-dimensional and Doppler echocardiographic studies were performed using standard equipment (Siemens ACUSON SC2000; Siemens Healthcare, Mountain View, California) and transducer (4V1c, 1.25 to 4.5 MHz; 4Z1c, 1.5 to 3.5 MHz) in accordance with the American Society of Echocardiography guidelines. LV dimensions during diastole and systole and wall thicknesses were measured from parasternal long-axis views according to the recommended criteria, and LV mass was calculated accordingly. LVH was defined as LV mass index >115 g/m 2 in men and >95 g/m 2 in women. LV and left atrial volumes were calculated by the Simpson biplane method. Left atrial volumes ≥34 ml/m 2 was used as abnormal cutoff. Mitral inflow peak early diastolic velocity (E), peak late diastolic velocity (A), E/A ratio, and E-wave deceleration time were measured for diastolic function assessment. E/A ratio <0.8 was used as cut-off to designate delayed relaxation (stage 1). Tissue Doppler mitral annular early diastolic velocity (e′) was assessed at septal and lateral and averaged for calculation of E/e′; an average E/e′ ≥ 13 was used to designate raised filling pressure. LV peak longitudinal strain measurements were obtained from grayscale-recorded images in the apical 4-chamber, 2-chamber, and long-axis views. Strain was analyzed offline using velocity vector imaging (Syngo VVI; Siemens Medical Solutions, Mountainview, CA). After manual tracing of the LV endocardial border during end-systole, this was automatically tracked throughout the cardiac cycle. LV GLS was obtained by averaging strain from the regional of interest in the apical 4-chamber, 2-chamber, and long-axis views.
Potential HF symptoms were assessed through regular follow-up phone calls, followed by symptom surveillance questionnaires and clinical visits. During the process, information on all-cause hospitalization was monitored and collected. Possible HF signs and symptoms were reviewed by 3 independent cardiologists, and HF diagnosis was confirmed using the Framingham criteria for HF. The primary composite end point was defined as new HF and cardiovascular death.
Data are presented as mean (±SD) after testing for normal distribution (Shapiro-Wilk test). Data deviating from normality are expressed as median (interquartile range [IQR]). Categorical variables are expressed as percentages. For differences among risk groups, the Mann-Whitney U test and the Kruskal-Wallis test were used for continuous variable and chi-square tests for categorical variables. Associations between variables were expressed with Pearson or Spearman correlation coefficients. The area under the receiver operating characteristic (ROC) curve was used to test predictive accuracy of variables, and statistical differences between the areas under the curves (AUCs) were performed with the method suggested by Hanley and McNeil. Survival function was estimated by Kaplan-Meier method and the difference in survival between groups were assessed by the log-rank test.
Classification and regression tree (CART) analysis is a nonparametric and nonlinear method based on the repeated partitioning of a sample into subgroups by predefined criteria. This relatively infrequently used method provides an approach to identify at risk patients without the effects of data distribution, multicollinearity, outliers and/or missing data, and interactions that affect other approaches. The decision tree model based on ARIC score combining 6 MW distance for the prediction of new HF and cardiac death was built as follows. The main study cohort was split into a derivation (1/2) and validation cohort by random selection. The tree model was then built from the derivation cohort, whereby patients were split into binary groups with the highest contrast for outcome. In each level of the tree, the variable with the strongest relation to the end point was selected and the optimal cut-off was used. The McNemar chi-square test was used to test paired data (e.g., discordance in sensitivity and specificity in dichotomous ARIC and 6 MW scores). Subsequent CART validation was performed in the validation cohort, with the expectation of showing a similar proportion of correctly classified cases for each category of outcome for the derivation and validation data sets. Based on risk stratification of CART model, we further tested the discrimination ability to predict the outcome in the entire cohort. The predicted risk groups were related to echocardiographic evidence of cardiac dysfunction.
The CART model was built using commercially available software (DTREG predictive modeling software 10.8.0, Brentwood, Tennessee). Statistical analysis was performed using standard software (SPSS software 22.0; SPSS Inc., Chicago, Illinois), and significance was defined by p <0.05.
Results
Of the 822 subjects from the community who were potentially eligible and volunteered for assessment, 344 were excluded due to failure to meet the clinical inclusion criteria and 42 were excluded after baseline echo screening, leaving 438 patients (median age 70 years [IQR 67 to 74], 52% women) who underwent baseline testing ( Appendix F1 ). HF risk factors were present in all—most commonly hypertension (82%), diabetes mellitus (55%), and obesity (45%); 80% had more than one of the listed risk factors. The FHS and ARIC scores were calculated in all subjects, and the median 4-year FHS and ARIC HF risks were 3.0% (IQR 2.0% to 6.5%) and 5.8% (IQR 3.4% to 10.4%), respectively.
After a median interval of 14 ± 4 months, 19 of 438 participants (4%) were lost to follow-up or alive but unable to attend follow-up. This group was no different from the remaining 419 who completed follow-up ( Appendix T1 ). New HF symptoms developed in 52 patients (2 were admitted to hospital with HF) and 4 died (2 of cardiovascular causes). The primary composite end point (events) of new-onset HF and cardiovascular death occurred in 54 (12.8%) of the entire cohort and annualized event rate of 11%. Participants with events were older and had greater prevalence of diabetes, higher Charlson co-morbidity score, and total number of stage A HF risk factors (p <0.01). Patient report outcome measures showed that the general (EurQoL-5D) and HF-specific health status (Minnesota Living with HF score) were poor (p <0.02), and activity status (Duke Activity Score Index score) was lower (p <0.01).
Compared with those remaining asymptomatic, the 54 subjects who reached the composite end point had higher ARIC score (p <0.01) but did not show significant differences in FHS scores (p = 0.08). ROC analysis showed the AUC of FHS and ARIC were 0.53 (95% CI 0.45 to 0.62, p = 0.415) and 0.65 (0.57 to 0.73, p <0.01), respectively. The difference between AUC was 0.12 (95% CI 0.03 to 0.21, p = 0.01). The discriminative ability of ARIC was significantly better than that of FHS.
Of the 419 subjects, 209 were randomly selected and defined as the derivation cohort for building the decision tree, and the rest of the cohort (n = 210) was defined as validation cohort. Baseline clinical and echocardiographic characteristics of the 2 cohorts are also listed in Table 1 . No difference was observed in clinical and echocardiographic characteristics except for a difference in BMI. There were 25 events (12%) in the derivation cohort and 29 in the validation cohort (14%) (p = 0.57). The decision process was built from the derivation cohort using the ARIC score and 6 MW distance. The score of importance was 100.0 for ARIC and 42.2 for 6 MW. Maximum depth of the full tree was 9 and total number of group splits was 20 with 21 terminal nodes. The relative error value was 1.083 with a standard error of 0.045. From a 3-level tree ( Appendix F2 ), the best cut-point was ARIC risk of 9.5%, which corresponds to the top twenty-nineth percentile of all ARIC levels. The optimal cut-point for 6 MW was 501 m, corresponding to the lower fortieth percentile of all 6 MW distances.
| Variables | Derivation cohort | Validation cohort |
|---|---|---|
| (n=209) | (n=210) | |
| Age (year) | (mean 70) | (mean 70) |
| Male gender | 109 (52%) | 91 (43%) |
| Body Mass Index (g/m 2 ) | 29 (27-33) | 28 (25-32) |
| ARIC risk score (%) | 6.2 (3.6-11.2) | 5.6 (3.2-9.6) |
| FHS risk score (%) | 3.0 (2.3-5.0) | 4.0 (2.0-7.0) |
| Type 2 Diabetes Mellitus | 125 (59%) | 107 (51%) |
| Obesity ∗ | 96 (46%) | 94 (45%) |
| Hypertension † | 166 (79%) | 178 (85%) |
| Previous Chemotherapy | 19 (9%) | 19 (9%) |
| Family history of HF | 81 (39%) | 73 (35%) |
| Previous heart condition | 20 (10%) | 13 (6%) |
| Charlson score | 1 (0-2) | 1 (0-2) |
| LV Ejection fraction (%) | 64 (60-68) | 63 (60-68) |
| Global Longitudinal strain (%) | 18.4 (16.9-20.3) | 18.8 (16.9-20.4) |
| Mitral E/A | 0.79 (0.67-0.92) | 0.75 (0.65-0.91) |
| Mitral e′ (cm/s) (averaged) | 7.6 (6.4-8.5) | 7.5 (6.4-8.9) |
| E/e′ (averaged) | 8.7 (7.2-10.5) | 8.3 (6.9-10.3) |
| Left atrium volume (ml/m2) | 30 (24-36) | 29 (24-36) |
| Left ventricular mass (g/m2) | 83 (72-97) | 80 (69-94) |
| Abnormal E/e′, cutoff 13 | 28 (13%) | 24 (11%) |
| Left ventricular hypertrophy | 31 (15%) | 26 (12%) |
| Dilated left atrium | 68 (33%) | 62 (30%) |
| Abnormal GLS, cutoff 18 | 122 (58%) | 131 (62%) |
| 6 minute walk distance (meters) | 485 (411-531) | 479 (425-529) |
| Adjusted Functional capacity (%) | 0.71 (0.62-0.80) | 0.73 (0.63-0.83) |
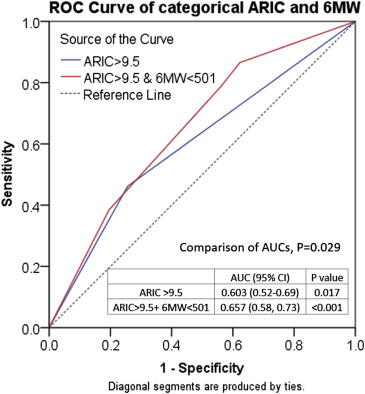
ARIC score and 6 MW distance were modestly correlated (rho = 0.40, p <0.01). As a categorical variable, low risk by ARIC (≤9.5) was associated with preserved exercise capacity (6 MW ≥ 501) in 48% and high risk (ARIC > 9.5) was associated with reduced exercise capacity (6 MW < 501) in 78%. In the 54 patients with events, ARIC was >9.5% in 26 (48%) and 6 MW was <501 m in 43 (80%, p = 0.001). However, in the 365 who remained asymptomatic, ARIC was ≤9.5% in 271 (74%) and 6 MW was ≥501 in 159 (44%, p <0.001). The additional predictive effect of categorical 6 MW to ARIC was further analyzed in the entire cohort using ROC analyses. Figure 1 showed significant improvement with the addition of 6 MW.
The combination of ARIC and 6 MW defined 3 risk groups—low, intermediate, and high—with respective event rates of 4.5%, 14%, and 18%. The validation of the tree (in the validation cohort and entire cohort) is summarized in Figure 2 . For further analysis of appropriate combinations, tables were created by combining low- and intermediate- ( Table 2 a) versus combining intermediate- and high-risk groups ( Table 2 b). The latter showed higher sensitivity (89%), low false-negative rate (11%), and high negative predictive value (96%). The exclusion of low-risk subjects would allow savings in the cost of echocardiography, with a low risk of missing HF. Although restriction of screening to only high-risk subjects ( Table 2 a) would limit the need for echocardiography to a smaller group (<25% of the total) but would miss more than half of the patients developing HF. The exclusion of low-risk subjects and identification of high-risk subjects would facilitate further screening and prevention. Subjects in intermediate-risk group (n = 182) were further assessed by electrocardiographic analysis using the Cornell product cut-off for separation. Of the total 182, 39 were abnormal, which were subsequently combined with CART high risk (n = 95) to form a final 134 subjects as a result of screening by CART and ECG and recommended for further echocardiography. The combination of CART and electrocardiographic strategies showed a 51% sensitivity for HF in the high-risk group and positive predictive value of 20% ( Table 2 c).

| Table 2a (CART) | Entire Cohort (n=419) | total | p=0.002 | |
|---|---|---|---|---|
| Heart Failure (+) | Heart Failure (-) | |||
| High Risk | 21 | 74 | 95 | PPV 22% |
| Low & Intermediate risk | 33 | 291 | 324 | NPV 90% |
| Sensitivity 39% | Specificity 80% | |||
| Table 2b (CART) | Entire Cohort (n=419) | total | p<0.001 | |
|---|---|---|---|---|
| Heart Failure (+) | Heart Failure (-) | |||
| Intermediate & High risk | 48 | 229 | 277 | PPV 17% |
| Low risk | 6 | 136 | 142 | NPV 96% |
| Sensitivity 89% | Specificity 37% | |||
| Table 2c (CART + ECG) | Entire Cohort (n=419) | total | p=0.003 | |
|---|---|---|---|---|
| Heart Failure (+) | Heart Failure (-) | |||
| High risk (CART + ECG) | 27 | 107 | 134 | PPV 20% |
| Low risk (CART+ECG) | 26 | 244 | 270 | NPV 90% |
| Total | 53 | 351 | ||
| Sensitivity 51% | Specificity 70% | |||
Stay updated, free articles. Join our Telegram channel

Full access? Get Clinical Tree


