A spiral phenomenon is sometimes noted in the plots of CO 2 output (VCO 2 ) against O 2 uptake (VO 2 ) measured during cardiopulmonary exercise testing (CPX) in patients with heart failure with oscillatory breathing. However, few data are available that elucidate the clinical significance of this phenomenon. Our group studied the prevalence of this phenomenon and its relation to cardiac and cardiopulmonary function. Of 2,263 cardiac patients who underwent CPX, 126 patients with a clear pattern of oscillatory breathing were identified. Cardiopulmonary indexes were compared between patients who showed the spiral phenomenon (n = 49) and those who did not (n = 77). The amplitudes of VO 2 and VCO 2 oscillations were greater and the phase difference between VO 2 and VCO 2 oscillations was longer in the patients with the spiral phenomenon than in those without it. Patients with the spiral phenomenon also had a lower left ventricular ejection fraction (43.4 ± 21.4% vs 57.1 ± 16.8%, p <0.001) and a higher level of brain natriuretic peptide (637.2 ± 698.3 vs 228.3 ± 351.4 pg/ml, p = 0.002). The peak VO 2 was lower (14.5 ± 5.6 vs 18.1 ± 6.3, p = 0.002), the slope of the increase in ventilation versus VCO 2 was higher (39.8 ± 9.5 vs 33.6 ± 6.8, p <0.001), and end-tidal PCO 2 both at rest and at peak exercise was lower in the patients with the spiral phenomenon than in those without it. In conclusion, the spiral phenomenon in the VCO 2 -versus-VO 2 plot arising from the phase difference between VCO 2 and VO 2 oscillations reflects more advanced cardiopulmonary dysfunction in cardiac patients with oscillatory breathing.
Oscillatory breathing in cardiac patients, a characteristic breathing pattern alternating between hyperpnea and hypopnea, can be evaluated in detail by cardiopulmonary exercise testing (CPX). Several valuable indexes are obtained from CPX, including the peak O 2 uptake (VO 2 ), the slope of the increase in ventilation (VE) versus the increase in CO 2 output (VCO 2 ) (VE–VCO 2 slope), and the anaerobic threshold (AT). During incremental exercise below the AT, VCO 2 increases approximately linearly with VO 2 , and its slope is theoretically 1.0 or slightly less. The slope above the AT becomes >1.0 because lactic acid is buffered by bicarbonate, resulting in the formation of carbonic acid, which dissociates to water and CO 2 . A peculiar spiral (vortex) phenomenon progressing in a counterclockwise direction is sometimes recognized in the plot of VCO 2 against VO 2 during CPX in patients with heart failure with oscillatory breathing. In the present study, we determined how frequently the spiral phenomenon can be observed during CPX in cardiac patients with oscillatory breathing and evaluated whether this phenomenon is related to impaired cardiopulmonary function.
Methods
The subjects for this study were 2,263 consecutive cardiac patients who underwent CPX at the Cardiovascular Institute for the evaluation of exercise capacity and/or severity of heart failure from January 2010 to December 2013. By visual observation, we identified all subjects who manifested at least 3 consecutive cycles of clear ventilatory oscillations during the period from the beginning of warm-up exercise until the end of incremental exercise. After determining the amplitude (difference between the peak and nadir) of each VE oscillation, we calculated the percentage amplitude by dividing the amplitude by the mean VE during each oscillation and then calculated the mean value of all oscillations. Thereafter, we selected 126 subjects whose amplitudes were >25% of the mean VE, on the basis of the report from Murphy et al. The research protocol was approved by the human subjects committee of the Cardiovascular Institute. The patients were apprised of the purposes and risks of the study, and all of them gave their informed consent.
A symptom-limited incremental exercise test was performed using an upright, electromagnetically braked cycle ergometer (Strength Ergo 8; Mitsubishi Electric Engineering Co., Ltd., Tokyo, Japan). The exercise test began with a 4-minute rest on the ergometer followed by a 4-minute warm-up at 0 or 20 W at 60 rpm. The load was then increased incrementally by 1 W every 6 seconds (10 W/min). VO 2 , VCO 2 , and VE were measured throughout the test using an Aeromonitor AE-300s (Minato Medical Science, Osaka, Japan), as previously described. Before the parameters from the respiratory gas analysis were calculated, breath-by-breath data were interpolated to give second-by-second values. These second-by-second values were then calculated as successive 3-second averages, and the averages were translated into a 5-point moving average.
The peak VO 2 was calculated as the average values obtained during the last 15 seconds of incremental exercise. The percentage of peak VO 2 was calculated by dividing the measured peak VO 2 by the predicted peak VO 2 . The predicted peak VO 2 was determined on the basis of a normal Japanese population. The gas exchange ratio, which is equal to VCO 2 /VO 2 , was calculated during the last 15 seconds of incremental exercise. The VE–VCO 2 slope during incremental exercise was calculated by a method previously reported. The end-tidal PCO 2 (PETCO 2 ) at rest was calculated as the average values obtained during the 4 minutes of rest. The PETCO 2 at peak exercise was calculated as the average of values obtained during the last 15 seconds of incremental exercise.
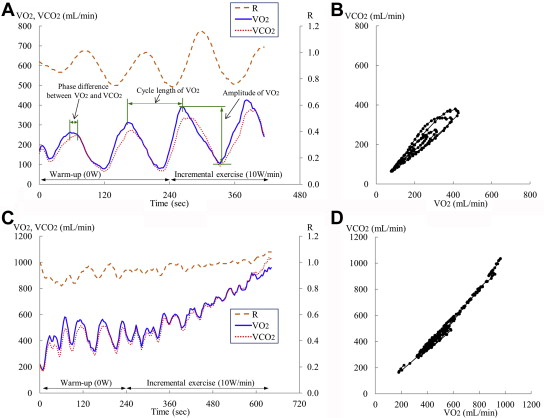
The amplitude of the oscillating VE was calculated as the difference between the peak and nadir of the oscillating VE for each of the cycles noted from the beginning of warm-up exercise until the end of incremental exercise and expressed as a mean value. The percentage amplitude was calculated by dividing the amplitude by the mean VE during each oscillation and expressed as a mean value of all oscillations. The cycle length of the oscillating VE was calculated as the interval from the peak to the following peak of the oscillating VE for each of the cycles and expressed as a mean value. The amplitude and cycle length of the oscillating VO 2 and VCO 2 were calculated by a similar approach. The oscillatory pattern of VO 2 usually precedes VCO 2 ( Figure 1 ). Thus, the time difference between the peak of the oscillating VO 2 and the corresponding peak of the oscillating VCO 2 (time from the peak of the oscillating VCO 2 − time of the corresponding peak of the oscillating VO 2 ) was calculated for each of the cycles and expressed as a mean value. A spiral phenomenon, defined as at least 3 consecutive counterclockwise changes in the VCO 2 -versus-VO 2 plot (i.e., a movement from a left lower side to a right upper side, then slightly to a left upper side, and back to the left lower side, forming an ellipse), was visually identified ( Figure 1 , for an example of the spiral pattern in a representative subject). The cardiopulmonary indexes were compared between patients who manifested the spiral phenomenon and those who did not.
Data are presented as the mean ± SD. Intergroup differences for variables were compared by the unpaired t test or the Fisher’s exact test where appropriate. Linear regression analysis was used to correlate the measured variables. All analyses were performed using SPSS version 19.0 software (SPSS Inc., Chicago, Illinois) for Windows (Microsoft Corporation, Redmond, Washington). A p value of <0.05 was considered statistically significant for all comparisons.
Results
The peculiar spiral phenomenon was noted in the plots of VCO 2 versus VO 2 during CPX in 39% of the cardiac patients with oscillatory breathing. There were no significant differences in gender, age, height, weight, body mass index, or cardiac disease cause between the patients with and without the spiral phenomenon, although idiopathic dilated cardiomyopathy was more frequent in the former ( Table 1 ).
| Characteristics | All patients (n = 126) | A Spiral Phenomenon | p value | |
|---|---|---|---|---|
| YES (n = 49) | NO (n = 77) | |||
| Male/female | 103 / 23 | 42 / 7 | 61 / 16 | NS |
| Age (years) | 63 ± 12 | 65 ± 11 | 61 ± 13 | NS |
| Height (cm) | 166 ± 8 | 165 ± 8 | 167 ± 9 | NS |
| Weight (kg) | 65 ± 13 | 65 ± 13 | 65 ± 12 | NS |
| Body mass index (kg/m 2 ) | 24 ± 4 | 24 ± 4 | 23 ± 4 | NS |
| Etiology | ||||
| Valvular disease | 35 (28%) | 14 (29%) | 21 (27%) | NS |
| Coronary artery disease | 35 (28%) | 12 (24%) | 23 (30%) | NS |
| Idiopathic dilated cardiomyopathy | 20 (16%) | 12 (24%) | 8 (10%) | 0.035 |
| Hypertrophic cardiomyopathy | 10 (8%) | 2 (4%) | 8 (10%) | NS |
| Other cardiac disease | 26 (21%) | 9 (18%) | 17 (22%) | NS |
| Medication | ||||
| β-blockers | 82 (65%) | 40 (82%) | 42 (55%) | 0.002 |
| ACEI/ARB | 67 (53%) | 26 (53%) | 41 (53%) | NS |
| Diuretics | 62 (49%) | 32 (65%) | 30 (39%) | 0.004 |
| Ca-channel blockers | 33 (26%) | 10 (20%) | 23 (30%) | NS |
| Nitrates | 20 (16%) | 9 (18%) | 11 (14%) | NS |
| Digitalis | 7 (6%) | 7 (14%) | 0 | 0.001 |
Similar to the oscillating VE, clear oscillatory changes were noted in both the VO 2 and the VCO 2 in the study population overall. The amplitudes and cycle lengths of the VE, VO 2 , and VCO 2 oscillations were all greater in the patients with the spiral phenomenon than in those without it ( Table 2 ). The VO 2 oscillations were found to precede the VCO 2 oscillations in 95 of the 126 subjects. The VCO 2 oscillations preceded the VO 2 oscillations in only 1 subject and only by a slight degree. No phase difference between the VO 2 and VCO 2 oscillations was observed in the remaining 30 patients. The mean phase difference between the VO 2 and VCO 2 oscillations was 2.2 ± 2.7 seconds in both groups combined and was significantly greater in the patients with the spiral phenomenon than in those without it (4.4 ± 3.0 vs 0.7 ± 0.8 seconds, p <0.001). The phase difference between the VCO 2 and VE oscillations was 0.8 ± 1.0 seconds in both groups combined and did not differ between the 2 groups.
| Characteristics | All patients (n = 126) | A Spiral Phenomenon | p value | |
|---|---|---|---|---|
| YES (n = 49) | NO (n = 77) | |||
| At rest | ||||
| Creatinine (mg/dL) | 1.1 ± 0.8 | 1.3 ± 1.2 | 0.9 ± 0.3 | 0.039 |
| Brain natriuretic peptide (pg/mL) | 398 ± 558 | 637 ± 698 | 228 ± 351 | 0.002 |
| Left ventricular ejection fraction (%) | 52 ± 20 | 43 ± 21 | 57 ± 17 | <0.001 |
| Left ventricular diastolic dimension (mm) | 54 ± 12 | 59 ± 14 | 51 ± 9 | 0.001 |
| Left ventricular systolic dimension (mm) | 40 ± 15 | 47 ± 17 | 36 ± 12 | <0.001 |
| Heart rate (beats/min) | 75 ± 16 | 76 ± 16 | 75 ± 15 | NS |
| Systolic blood pressure (mmHg) | 115 ± 24 | 109 ± 26 | 119 ± 22 | 0.018 |
| Diastolic blood pressure (mmHg) | 73 ± 15 | 71 ± 16 | 75 ± 14 | NS |
| End-tidal PCO 2 (mmHg) | 32 ± 4 | 31 ± 4 | 33 ± 4 | 0.007 |
| At peak exercise | ||||
| Heart rate (beats/min) | 125 ± 33 | 117 ± 29 | 130 ± 35 | 0.026 |
| Systolic blood pressure (mmHg) | 163 ± 38 | 149 ± 42 | 172 ± 33 | 0.001 |
| Diastolic blood pressure (mmHg) | 81 ± 20 | 80 ± 21 | 82 ± 19 | NS |
| End-tidal PCO 2 (mmHg) | 35 ± 5 | 33 ± 5 | 36 ± 5 | 0.001 |
| Gas exchange ratio | 1.10 ± 0.10 | 1.09 ± 0.11 | 1.11 ± 0.09 | NS |
| Peak VO 2 (mL/min/kg) | 16.7 ± 6.3 | 14.5 ± 5.6 | 18.1 ± 6.3 | 0.002 |
| Peak VO 2 (%) | 67 ± 23 | 60 ± 23 | 72 ± 21 | 0.006 |
| VE-VCO 2 slope | 36 ± 9 | 40 ± 10 | 34 ± 7 | <0.001 |
| Amplitude of VE (L/min) | 6.3 ± 2.2 | 7.5 ± 2.5 | 5.6 ± 1.7 | <0.001 |
| Amplitude of VE (%) | 38 ± 13 | 45 ± 15 | 34 ± 10 | <0.001 |
| Cycle length of VE (sec) | 57 ± 16 | 65 ± 19 | 51 ± 12 | <0.001 |
| Amplitude of VO 2 (mL/min) | 186 ± 64 | 203 ± 70 | 176 ± 58 | 0.023 |
| Amplitude of VO 2 (%) | 46 ± 16 | 52 ± 19 | 42 ± 13 | 0.002 |
| Cycle length of VO 2 (sec) | 56 ± 16 | 65 ± 17 | 51 ± 11 | <0.001 |
| Amplitude of VCO 2 (mL/min) | 168 ± 56 | 187 ± 57 | 155 ± 52 | 0.002 |
| Amplitude of VCO 2 (%) | 46 ± 16 | 53 ± 18 | 41 ± 14 | <0.001 |
| Cycle length of VCO 2 (sec) | 56 ± 17 | 65 ± 19 | 51 ± 11 | <0.001 |
| Phase difference between VO 2 and VCO 2 (sec) | 2.2 ± 2.7 | 4.4 ± 3.0 | 0.7 ± 0.8 | <0.001 |
Stay updated, free articles. Join our Telegram channel

Full access? Get Clinical Tree


