The advantages of triple-site ventricular pacing (Tri-V) compared to conventional biventricular site pacing (Bi-V) have been reported. We sought to identify the predictors of acute hemodynamic Tri-V responders. Acute hemodynamic studies were performed in 32 patients with advanced heart failure during Tri-V implantation. After the right ventricular (RV) and left ventricular (LV) leads were implanted for a conventional Bi-V system, an additional pacing lead was implanted in the RV outflow tract for Tri-V. The LV peak +dP/dt and tau were measured during AAI, Bi-V, and Tri-V pacing. A Tri-V responder was defined as a patient whose percentage of increase in the peak +dP/dt during Tri-V was >10% compared to of that during Bi-V. The baseline clinical variables and RV outflow tract lead location were analyzed to identify the characteristics of the Tri-V responders. Of the 32 patients, 10 (31%) were classified as Tri-V responders. The LV end-diastolic volume was greater (246 ± 48 vs 173 ± 53 ml, p <0.01), and the RV outflow tract lead was implanted at a greater outflow tract portion (p <0.05) in the Tri-V responders. Multivariate analysis revealed that only the baseline LV end-diastolic volume (per 50-ml greater) predicted the Tri-V response (odds ratio 2.87, 95% confidence interval 1.03 to 8.00, p <0.05). The area under the receiver operating characteristic curve for the LV end-diastolic volume was 0.84 (p <0.01) and an LV end-diastolic volume of >212 ml had a sensitivity of 80% and specificity of 77% to distinguish Tri-V responders. In conclusion, Tri-V provides greater hemodynamic effect for patients with a larger LV end-diastolic volume owing to its resynchronization effects on the LV anterior wall.
Cardiac resynchronization therapy using biventricular pacing (Bi-V) is becoming an adjunctive nonpharmacologic therapy for patients with drug-refractory heart failure. However, even though patients were selected on the basis of the QRS duration and echocardiographic parameters, 20% to 30% of the patients failed to improve, especially in patients with New York Heart Association functional class IV. To overcome the inconsistent effects of Bi-V, multisite pacing techniques have recently been introduced to stimulate a wider area of the myocardium, thus enabling a simultaneous left ventricular (LV) contraction. We previously reported the novel technique of “‘triple-site ventricular pacing’” (Tri-V) with a “double-right and single-left” method. However, it is unclear whether the Tri-V is more effective than Bi-V in all cardiac resynchronization therapy recipients. The purpose of the present study was to clarify these points from acute hemodynamic studies.
Methods
Patients with New York Heart Association functional class III or IV heart failure despite maximum pharmacologic therapy, LV ejection fraction of <35%, and QRS interval of >120 ms without right bundle branch block were scheduled to receive cardiac resynchronization therapy in our institution. The patients with atrial fibrillation (n = 6), and upgrading from right ventricular (RV) apical pacing (n = 7) were excluded from the present study. Finally, 32 patients who provided written informed consent were enrolled in the present study and underwent Tri-V as the de novo cardiac resynchronization therapy. The institutional ethics review committee of our hospital provided ethical approval for our study.
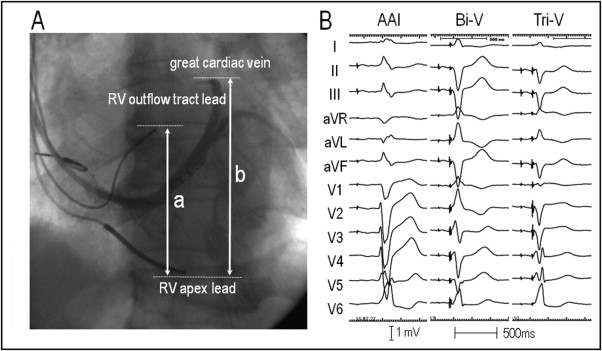
The RV and LV leads (11 stylet-driven leads and 21 over-the-wire leads) were implanted in the RV apex and anterolateral, posterolateral, or lateral cardiac vein, respectively, for a conventional Bi-V system using the standard transvenous approach. Furthermore, for Tri-V, an additional pacing lead was implanted in the RV outflow tract ( Figure 1 ). This lead was positioned on the RV septum under fluoroscopic guidance in the left anterior oblique projection to pace the opposite side of the basal/anteroseptal wall of the left ventricle to stimulate the left anterior bundle branch area.
A Y-adapter (5866−38M, Medtronic, Minneapolis, Minnesota) was connected to the RV channel of the cardiac resynchronization therapy pacemaker (Insync 8040, Insync 8042, Medtronic) and the LV channel of the cardiac resynchronization therapy defibrillator (Insync III Marquis, Concerto, Concerto AT, Medtronic, and Epic HF, Atlas+HF, St. Jude Medical, Sylmar, California). The Y-adapter bifurcated the anode port for the RV apical lead and cathode port for the RV outflow tract lead in the cardiac resynchronization therapy pacemaker and bifurcated the anode port for the RV outflow tract lead and cathode port for the LV lead in the cardiac resynchronization therapy defibrillator to use the RV tip-ring electrode as a bipolar pacing and sensing port. When the output of the pacemaker was set at a level greater than the anodal threshold, the ventricle was depolarized simultaneously from either the RV apex and RV outflow tract or the RV outflow tract and left ventricle. A right atrial lead was implanted in the right atrial appendage in all patients.
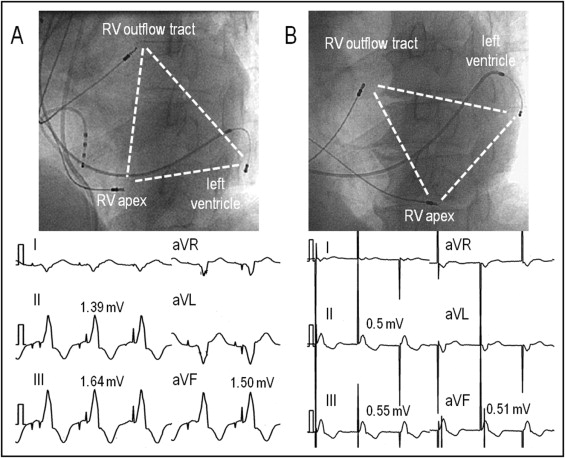
The relative anatomic location (height) of the RV outflow tract lead to the left ventricle was obtained by the ratio of the longitudinal distance between the tip of the RV apical lead and that of the RV outflow tract lead to the longitudinal diameter of the left ventricle, defined as the longitudinal distance between the tip of the RV apical lead and the superior edge of the venogram of the great cardiac vein in the left anterior oblique projection ( Figure 1 ). The QRS complex in leads I and V 1 and the R-wave amplitudes in the inferior leads during RV outflow tract pacing were also measured for the assessment of the electrophysiologic characteristics of the RV outflow tract lead ( Figure 2 ) . The RV outflow tract lead was considered to be placed in the anteroseptal, midseptal, or posteroseptal area when the QRS complex in lead I demonstrated a negative, isoelectric or biphasic, and positive polarity, respectively.
With the cardiac resynchronization therapy pacemaker devices, the acute hemodynamic data of the Bi-V was measured under a standard Bi-V setting connecting the RV apical lead directly to the device. After the hemodynamic data were obtained with the Bi-V, the RV apical lead was disconnected from the device and connected to the anodal port of the Y-adapter and provided Tri-V with the cathode RV outflow tract lead, and the hemodynamic data were obtained. With the cardiac resynchronization therapy defibrillator devices, the hemodynamic data were obtained after the leads were connected to the Y-adapter. Initially, the LV lead was used as the cathode for unipolar pacing, so that Bi-V pacing was achieved by RV apical bipolar pacing and LV unipolar pacing. Subsequently, the LV pacing was switch to a bipolar pacing mode, so anodal capture of the RV outflow tract and cathode capture of the left ventricle could be obtained.
After the operation, the peak positive dP/dt (+dP/dt Max ) as the index of the systolic function and tau as the index of the diastolic function were obtained during baseline (AAI pacing), Bi-V, and Tri-V with a pacing rate of 20 beats/min greater than the baseline rate using a micromanometer-tipped pigtail catheter (SPC-464D, Millar Instruments, Houston, Texas). The cardiac output was also measured in the latter 19 consecutive patients using a Swan-Ganz catheter (Baxter Healthcare, Irvine, California). Each pacing session was continued for 5 minutes, with an interval between each pacing configuration of 3 minutes. In the Bi-V and Tri-V, the atrioventricular delay was optimized for each configuration tested, as previously reported, to provide the longest transmitral filling time based on a Doppler analysis of the LV filling. Because we adopted 2 different Y-adapter settings for cardiac resynchronization therapy pacemaker, and cardiac resynchronization therapy defibrillator to provide Tri-V, all hemodynamic data were obtained under Bi-V simultaneous pacing, and no adjustments were made to the ventricular-ventricular intervals for the Bi-V and Tri-V to avoid any different left ventricle activation patterns. Any change in the pacing configuration was confirmed by the change in the paced QRS morphology ( Figure 1 ). Acute hemodynamic responders were defined as patients whose percentage of increase in the +dP/dt Max was >10% from AAI pacing to Bi-V (Bi-V responders) or from Bi-V to Tri-V (Tri-V responders).
Baseline echocardiography was performed with a Vivid 7 system (GE, Vingmed Ultrasound, Horten, Norway) before the procedure. The LV end-diastolic and end-systolic volumes, and ejection fraction were assessed by a biplane Simpson’s equation using the apical 4- and 2-chamber views. The severity of the mitral regurgitation was graded from color flow Doppler images as none, mild (jet area/left atrial area, <20%), moderate (20% to 45%), and severe (>45%). Myocardial tissue velocity curves using color-coded tissue Doppler images were obtained, placing the sample volume on 12 LV segments, the basal and midventricular segments of the anteroseptal, anterior, lateral, posterior, inferior, and inferoseptal walls. Intraventricular dyssynchrony was identified, with a parameter derived from the tissue Doppler images. The standard deviation of the interval to peak myocardial systolic velocity (Ts) for the 12 LV segments (Ts-SD).
Continuous variables are expressed as the mean ± SD. Analysis of variance was used when comparisons involved >2 groups. When group differences were found, one-way analysis of variance was followed by Scheffe’s method to test the significance of the difference among the mean values in all groups. The categorical variables were compared using a chi-square analysis and Yates’ correction, if necessary. Univariate and multivariate logistic regression analyses were used to identify the predictors of Tri-V responders. All parameters with a significance of p <0.05 on univariate analysis were entered into the multivariate model. A receiver operating characteristic curve analysis was used to determine the ability of the LV end-diastolic volume to predict Tri-V responders. A p value <0.05 was considered significant.
Results
A transvenous Tri-V system was successfully implanted in all patients ( Table 1 ). When the pacing mode was changed from AAI pacing to Bi-V and from Bi-V to Tri-V, the changes in the paced QRS morphologies were detected on the 12-lead electrocardiogram in all patients ( Figure 1 ). During the change from Bi-V to Tri-V, and a reduction in the S-wave amplitude of ≥0.2 mV (n = 29) or increase in the R-wave amplitude of ≥0.2 mV (n = 1) in any of the inferior leads was observed in 30 patients (94%). Furthermore, a reduction in the R-wave amplitude of ≥0.2 mV (n = 2) or appearance of an S wave from the R wave or increase in the S-wave amplitude of ≥0.2 mV (n = 21) in any of the leads V 1 to V 3 was observed in 23 patients (72%). Because the pacing thresholds obtained after connecting the leads to the Y-adapter have greater thresholds compared to the unipolar configuration, the thresholds were measured after the lead was connected to the Y-adapter. The mean threshold was 1.49 ± 0.97 V at a 0.56 ± 0.37-ms pulse width for the RV apical lead, 1.81 ± 1.01 V at a 0.52 ± 0.37-ms pulse width for the RV outflow tract lead, and 2.90 ± 1.65 V at a 0.56 ± 0.34-ms pulse width for the LV lead, respectively.
| Variable | All Patients (n = 32) | Responders (n = 10) | Nonresponders (n = 22) | p Value |
|---|---|---|---|---|
| Age (years) | 65 ± 13 | 71 ± 9 | 63 ± 15 | 0.2 |
| Men | 27 (84%) | 9 (90%) | 14 (64%) | 0.2 |
| New York Heart Association class III/IV | 18/14 | 6/4 | 12/10 | 0.8 |
| Ischemic/nonischemic | 4/28 | 2/8 | 2/20 | 0.4 |
| Systolic blood pressure (mm Hg) | 96 ± 11 | 98 ± 7 | 95 ± 13 | 0.6 |
| Heart rate (beats/min) | 72 ± 16 | 69 ± 15 | 63 ± 17 | 0.5 |
| Concomitant disease and general condition | ||||
| Chronic kidney disease | 28 (88%) | 10 (100%) | 18 (82%) | 0.3 |
| Chronic hepatic failure | 5 (16%) | 1 (10%) | 4 (18%) | 0.9 |
| Mechanical ventilation | 7 (22%) | 2 (20%) | 5 (23%) | 0.9 |
| Inotropic support | 8 (25%) | 2 (20%) | 6 (27%) | 0.9 |
| Heart failure hospitalization within 1 month | 24 (75%) | 8 (80%) | 16 (73%) | 0.9 |
| Medications | ||||
| β Blockers | 20 (63%) | 5 (50%) | 15 (68%) | 0.3 |
| Angiotensin-converting enzyme inhibitor/receptor blocker | 17 (53%) | 5 (50%) | 12 (55%) | 0.8 |
| Amiodarone | 22 (69%) | 6 (60%) | 16 (73%) | 0.5 |
| QRS duration at baseline (ms) | 167 ± 35 | 180 ± 40 | 162 ± 31 | 0.6 |
| Left ventricular ejection fraction (%) | 25 ± 8.2 | 25 ± 8.3 | 25 ± 8.4 | 0.9 |
| Left ventricular end-diastolic volume (ml) | 195 ± 61 | 246 ± 48 | 173 ± 53 | <0.001 |
| Moderate to severe mitral regurgitation | 7 (22%) | 2 (20%) | 5 (23%) | 0.9 |
| Ratio of longitudinal distance ⁎ | 0.80 ± 0.12 | 0.88 ± 0.06 | 0.76 ± 0.13 | <0.05 |
| Polarity of QRS complex in lead I during pacing from right ventricular outflow tract | 0.8 | |||
| Negative | 15 (47%) | 11 (50%) | 4 (40%) | |
| Isoelectric or biphasic | 15 (47%) | 10 (45%) | 5 (50%) | |
| Positive | 2 (6%) | 1 (5%) | 1 (10%) | |
| R-wave amplitude during pacing from right ventricular outflow tract lead (mV) | ||||
| Lead II | 1.04 ± 0.51 | 1.29 ± 0.59 | 0.93 ± 0.44 | 0.09 |
| Lead III | 1.18 ± 0.56 | 1.36 ± 0.71 | 1.09 ± 0.48 | 0.2 |
| Lead aVF | 1.10 ± 0.53 | 1.31 ± 0.64 | 1.01 ± 0.46 | 0.1 |
| Left ventricular lead position | 0.2 | |||
| Lateral or posterolateral | 29 (91%) | 8 (80%) | 21 (95%) | |
| Anterolateral | 3 (9%) | 2 (20%) | 1 (5%) | |
| Standard deviation of interval to peak myocardial systolic velocity † | 39.0 ± 15.0 | 38.4 ± 14.0 | 39.0 ± 15.8 | 0.9 |
⁎ Ratio of longitudinal distance between tip of right ventricular apex lead and that of right ventricular outflow tract lead to longitudinal diameter of left ventricle, defined as longitudinal distance between tip of right ventricular apex lead and superior edge of venogram of great cardiac vein in left anterior oblique projection.
In patients undergoing cardiac resynchronization therapy pacemaker placement (n = 20), the threshold of the anodal RV apical lead was 1.83 ± 1.15 V at a 0.64 ± 0.42-ms pulse width and that of the cathode RV outflow tract lead was 1.66 ± 0.93 V at 0.62 ± 0.44 ms. In contrast, in 12 patients undergoing cardiac resynchronization therapy defibrillator, the threshold of the anodal RV outflow tract lead was 2.04 ± 1.21 V at a 0.35 ± 0.15-ms pulse width and that of the cathode LV lead was 2.93 ± 0.74 V at 0.39 ± 0.11 ms. In 7 patients undergoing cardiac resynchronization therapy defibrillator, the threshold of the cathode LV lead was greater compared to that of the anodal RV outflow tract lead. Regarding the short refractoriness of anodal pacing, pacing-induced ventricular tachyarrhythmias were not observed in any patients. The procedure and fluoroscopy time was 176 ± 47 minutes and 36.7 ± 19.1 minutes, respectively.
The +dP/dt Max increased more during Bi-V than during AAI pacing (p <0.01), and it further increased when changed from Bi-V to Tri-V (p <0.05; Figure 3 ) . In contrast, the tau improved in the order of AAI pacing, Bi-V, and Tri-V, and there was a significant difference between the AAI pacing and Tri-V (p <0.01; Figure 3 ). The total QRS duration during Tri-V was the shortest and cardiac output was the greatest among the 3 different pacing configurations ( Figure 3 ).


