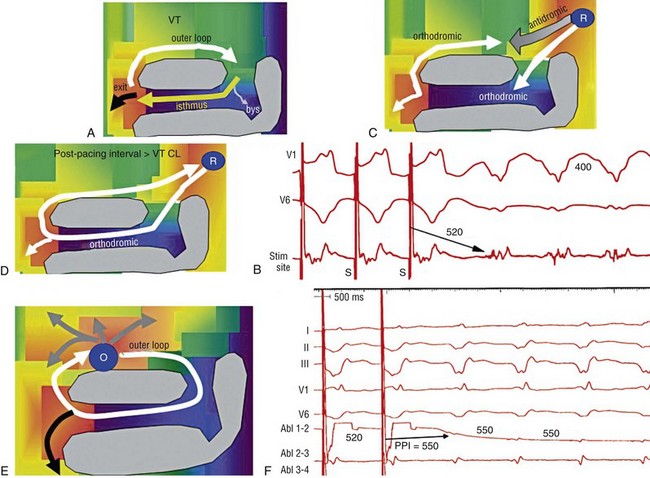
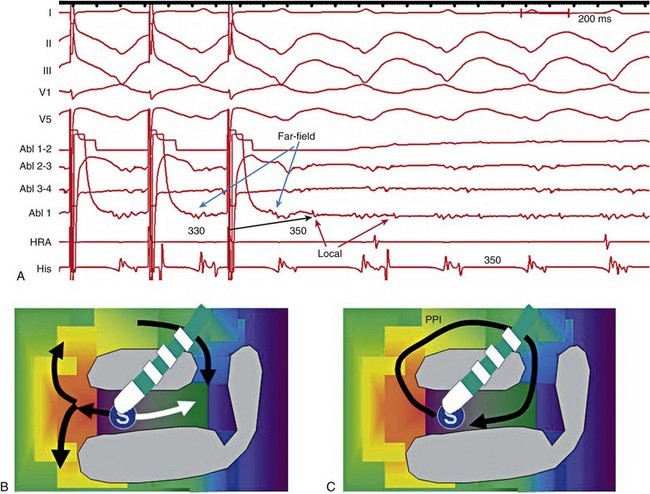
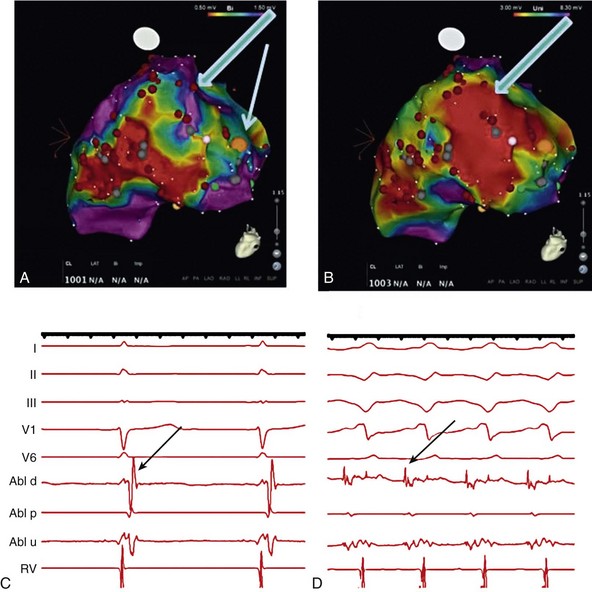
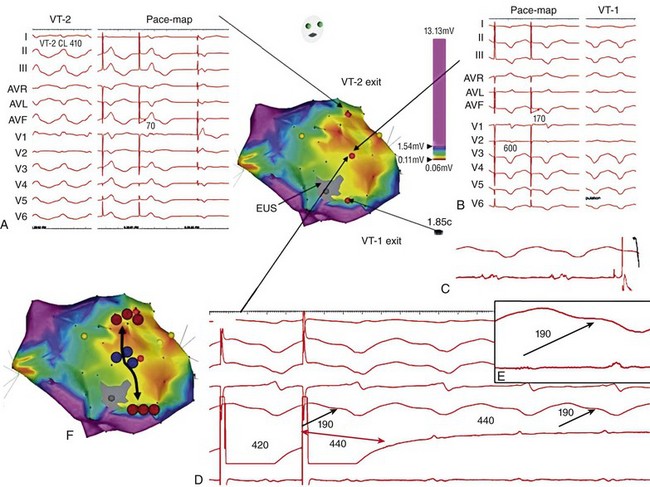
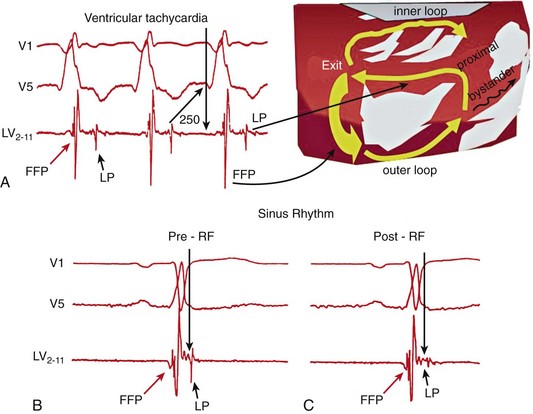
124 Catheter ablation has an important role in reducing or preventing episodes of ventricular tachycardia (VT). The optimal ablation approach and its efficacy are determined by the characteristics of the arrhythmia and the anatomy and location of the arrhythmia substrate, which can often be anticipated from the electrocardiographic characteristics of the arrhythmia and any underlying heart disease. Most VTs that are considered for ablation are monomorphic, with the same QRS complex from beat to beat indicating repetitive ventricular activation from a structural substrate or a focus that can be targeted for ablation. In patients with heart disease, more than one morphology of sustained monomorphic VT is often inducible. VT that has the same electrocardiogram (ECG) QRS morphology and cycle length as one that has been observed to occur spontaneously is designated a “clinical VT.”1 Often the ECG morphology of VT is not known a priori, because the arrhythmia is clinically terminated by an implantable cardioverter defibrillator (ICD), and only the cycle length and intracardiac electrograms are known. VTs that are then induced and are similar in cycle length and morphology in available ECG leads or recordings are designated “presumed clinical VTs.”1 Inducible VTs that have not been documented to occur spontaneously are designated as having uncertain clinical significance or “undocumented VT.” Ablation can be used to control recurrent polymorphic VT or VF in selected patients when the triggering foci or substrate for the arrhythmia can be identified.2,3 Mortality is rare in patients without structural heart disease, but perforation, tamponade, coronary injury, and AV block can occur. In patients with structural heart disease, procedure-related mortality is approximately 2%, with most deaths being related to uncontrollable VT with hemodynamic deterioration in patients with severe disease when the procedure fails.1,4 Preprocedure planning is important to minimize risks. Underlying heart disease should be defined. The potential for myocardial ischemia should be assessed. Although ischemia is not usually the cause of monomorphic VT, it can contribute to hemodynamic instability and increase the risk of the procedure if not addressed. It is important to consider fluid balance, electrolyte abnormalities, anemia, and metabolic abnormalities, such as hyperthyroidism, that might contribute to hemodynamic deterioration or development of uncontrollable arrhythmias during the procedure. The use of external irrigation ablation catheters administers intravascular volume that requires attention to fluid balance and diuresis to avoid development of pulmonary edema or aggravation of heart failure if extensive ablation is needed. Cerebral or systemic embolism is reported in 0.0% to 2.7% of patients.4,5 If endocardial left ventricular mapping is planned, then echocardiography should be performed. A mobile left ventricular (LV) thrombus is a contraindication to LV mapping. If laminated thrombus is suspected, a period anticoagulation therapy with warfarin may be considered with the hope of stabilizing potentially friable thrombus, although the efficacy of this approach is not known. During LV mapping and ablation, systemic anticoagulation is achieved with heparin. After ablation, continued anticoagulation with aspirin or warfarin is recommended depending on the extent of ablation performed. LV access is usually achieved with a retrograde aortic approach across the aortic valve. Damage to the valve or coronary artery ostia is possible, but rare. Significant vascular access complications, including significant bleeding, arterial dissection, and femoral AV fistulas, occur in 2.1% of patients.4,5 A transseptal approach via the left atrium allows access to the LV through the mitral valve for patients with peripheral vascular disease or a mechanical aortic valve or when insertion of multiple mapping catheters is desired. In nonischemic cardiomyopathy, an epicardial origin is suggested by a VT QRS with a relatively long QRS duration and slow QRS upstroke, producing a pseudo–delta waves; these findings could be due to delayed activation of the endocardial Purkinje system compared with endocardial VTs.6,7 A QS complex with the absence of initial R waves in leads reflecting the region of initial activation in VT, such as lead I in the presence of posterobasal scar and the inferior leads in the presence of inferior wall scar, often indicates an epicardial VT origin.7,8 In patients with prior myocardial infarction, the VT QRS morphology does not reliably identify which VTs require epicardial ablation.9 Recordings from the His bundle region and RV apex are usually obtained. A His bundle potential before each QRS onset suggests the possibility of bundle branch reentry (see Chapter 83), although one-to-one passive conduction into the Purkinje system is also possible. Pacing is often performed from the RV apex to entrain or terminate VT. Entrainment from the RV apex with a postpacing interval of 30 ms or less further suggests bundle branch reentry or a VT circuit close to the apex.10 Activation recorded from the RV catheters provides some limited mapping data. Relatively early ventricular activation at the basal septum (His bundle region) or apical septum indicates a septal origin of VT. Further mapping is based on whether VT is likely focal or scar-related reentry. Focal-origin VTs should be suspected in patients without structural heart disease, who have typical QRS morphologies for outflow tract (see Chapter 81) or papillary muscle VT sites (see Chapter 80), and for repetitive monomorphic and nonsustained VTs and PVCs. A focal origin is confirmed by activation mapping that shows spread away in all directions from the focus. Automaticity or small reentry circuits are possible mechanisms. The VT origin is identified as the site of earliest ventricular activation relative to the QRS onset. Pacing at the site of origin will produce a QRS morphology replicating that produced by the arrhythmia focus, provided that pacing captures the small area at the focus and not the surrounding myocardium, but is not as accurate as activation mapping and is sometimes misleading.1 Focal VTs are often found along the valve annuli (pulmonic, aortic, mitral, and tricuspid). The complex anatomy in some of these locations can render the QRS morphology and pacemapping particularly unreliable for guiding ablation.11 VT that originates in sleeves of myocardium extending along the aorta or pulmonary artery must be identified from sites of earliest activation before the QRS onset during the arrhythmia (see Chapter 81). Inability to induce the VT is a common problem that limits mapping. Immediately on arrival in the electrophysiology laboratory, attention should be directed to recording a 12-lead ECG of any spontaneous arrhythmia that can provide a template to guide pacemapping if the arrhythmia is not inducible after placement of catheters. Minimizing sedation and avoiding excess administration of local lidocaine anesthesia, which can be absorbed and result in systemic levels, are important considerations. Administration of β-agonists, such as isoproterenol, or epinephrine boluses may be effective. The arrhythmia can emerge as heart rate slows during washout from the effect of a β-agonist. There are also anatomical obstacles. The VT focus can be located deep within the myocardium, or at the summit of the LV, where it is not approachable with standard ablation.12 Epicardial foci may be under a coronary artery (see Chapter 127) where ablation risks damaging the artery.13 Electroanatomical mapping systems, imaging with intracardiac ultrasound, angiography, and incorporation of preprocedure cardiac computed tomography or magnetic resonance imaging (MRI) can be helpful in clarifying anatomic complexities.14,15 Ablation of focal PVCs that trigger polymorphic VT and ventricular fibrillation can be used to control frequent episodes of these arrhythmias (see Chapter 97). Arrhythmia in this case can occur in the absence of structural heart disease, in areas of infarction, or associated with a myopathic processes.16–18 The origin is most often found in the Purkinje system or RV outflow tract. Scar-related reentry is the most common cause of sustained monomorphic VT in structural heart disease.1 Scars can be due to prior myocardial infarction, cardiomyopathies, or surgical incisions. The location of the scar as indicated by wall motion abnormalities, or delayed gadolinium enhancement on MRI suggests the region likely to contain the VT substrate.19–22 Regions of dense fibrosis that create conduction block combined with surviving myocytes bundles with interstitial fibrosis and diminished coupling produces circuitous conduction paths for slow conduction that is the substrate for reentry. Stable circuits can be modeled as having an isthmus or channel composed of a small mass of tissue that does not contribute to the surface ECG (Figures 124-1, 124-2). The QRS onset occurs when the excitation wavefront emerges from an exit along the border of the scar and spreads across the ventricles. Reentry circuit configurations and locations are variable. Scars related to VT often border a valve annulus that forms a border segment for part of the circuit.23–25 Slow, stable VTs are often due to relatively large macroreentry circuits spanning several centimeters.26 Multiple VTs with different QRS morphologies can be due to multiple exits from the same region of scar, or changes in activation remote from the circuit because of functional regions of block.26–29 Ablation at one region could abolish more than one VT.25,29–31 Multiple reentry circuits from widely separated areas also occur. The location of the scar that provides the arrhythmia substrate is a major determinant of the mapping approach and likely success of ablation. The substrate and reentry circuits locations can be subendocardial, subepicardial, or intramural, and vary with the type of heart disease, being most commonly endocardial in prior infarcts, epicardial in arrhythmogenic RV cardiomyopathy, and variable in other cardiomyopathies. Figure 124-1 Entrainment of reentrant ventricular tachycardia (VT). A, C, D, and E show schematics of a theoretic reentry circuit with areas of dense scar (gray) defining the circuit. Activation sequence is indicated by arrows and colors proceeding from red to yellow to green to blue to purple. A, The VT circuit with an isthmus (yellow arrow), outer loop along the border of the scar (white arrow), and bystander region (bys; gray arrow). The QRS onset would occur when the wavefront emerged from the exit region. B, Entrainment from a remote bystander site and the findings are shown schematically in the VT circuits in C and D. VT with a cycle length of 400 ms is present. The last three stimuli of a pacing train accelerate the QRS complexes and electrograms to the pacing cycle length with a change in QRS morphology compared to VT. The postpacing interval (PPI) is 520 ms, exceeding the VT cycle length by 120 ms. C, The stimulated wavefronts divide into antidromic wavefronts (gray arrow), which alters the ventricular activation sequence compared with tachycardia changing the QRS morphology. The stimulated orthodromic wave front resets the tachycardia circuit. D, After the last stimulus, the stimulated orthodromic wavefront propagates through the circuit and back to the pacing site, such that the PPI is equal to the tachycardia cycle length plus the conduction time from the pacing site to the circuit and from the circuit back to the pacing site. In E and F, the effects of pacing at an outer loop site along the border of the scar. F, Pacing accelerates the QRS complexes and electrograms. The PPI of 550 ms matches the VT cycle length, indicating that the site is in the circuit as shown schematically by the white arrow in E. Subtle QRS fusion is evident in the change in QRS morphology in lead I during pacing. Absence of any delay between stimulus and QRS also indicates that the site is not in an isthmus. Figure 124-2 Entrainment from an epicardial isthmus site (A) from the patient shown in Figure 124-1 and schematics (B and C) are shown. From the top of A are surface electrocardiogram (ECG) and cardiac recordings from the epicardial ablation catheter (Abl) with bipolar records from distal (1-2), mid (2-3), and proximal (3-4) electrodes and a high-pass–filtered unipolar recording from electrode 1 (Abl 1), high right atrium (HRA), and His bundle region (His). Ventricular tachycardia (VT) with a cycle length of 350 ms is present. Unipolar pacing at 330 ms from the distal electrode of the ablation catheter accelerates the QRS complexes and electrograms to the pacing rate. Measurement of the postpacing interval (PPI) requires assessment of which electrogram most likely indicates the local potential. During pacing, a broad fractionated potential is visible, indicating that this is a far-field potential (blue arrows). The potential that is not visible during pacing is the likely local potential (red arrow). The PPI measured to the local potential is 350 ms, matching the VT cycle length. The QRS during pacing is identical to that of VT (also confirmed in the 12-lead ECG that is not shown). These findings are consistent with pacing from an isthmus in the reentry circuit as shown schematically in B and C. Stimulated orthodromic wave fronts are indicated by black arrows. The stimulated antidromic wave front is the white arrow in B. Areas of scar can often be identified during stable sinus rhythm, along with potential exits and channels, facilitating ablation in patients with multiple and unstable VTs.27,28,32,33 Electroanatomical mapping systems recreate the geometry of the ventricles from point by point mapping, intracardiac ultrasound images, or registration of pre-acquired computed tomography or MRI images and allow electrophysiological features to be displayed in relation to the anatomy (see Chapter 60. EP Mapping and Navigation19,21,34 Scar associated with myocyte loss and fibrosis are characterized by low amplitude electrograms. Voltage maps are plots of peak to peak electrogram amplitude (Figure 124-3).28,33 In normal ventricular myocardium > 95% of sites have a bipolar electrogram amplitude exceeding 1.5 mV (recorded with an ablation catheter with large tip electrode, 1 mm interelectrode spacing and filtered at 10 to 400 Hz). Recent studies correlating voltage maps with regions of delayed gadolinium enhancement in MRIs of infarct regions have found that areas with bipolar electrograms less than 1.5 mV in amplitude are associated with fibrosis typically occupying at least 75% of the ventricular wall,19,35 and that less extensive fibrosis is present at surrounding regions. Bipolar electrogram amplitude thresholds for 95% of normal sites are slightly lower for the right ventricle (< 1.44 mV).28 During epicardial mapping, bipolar electrogram amplitude exceeds 1 mV at 95% of normal sites; however, lower-amplitude signals are recorded normally over a thick region of fat along the AV groove and coronary arteries.36,37 Electrograms recorded over fat do not display fractionation or long durations; therefore, these features are often useful in distinguishing clearly abnormal regions from normal myocardium with overlying fat. Figure 124-3 Electroanatomic voltage mapping in a patient with prior posterolateral infarction viewed from an inferolateral angulation. A, A bipolar voltage map where purple (normal) areas are indicated by an electrogram amplitude of 1.5 mV or greater. B, A unipolar voltage map where purple (normal) areas are indicated by an electrogram amplitude of 8.3 mV or greater. Note the larger area subtended by abnormal voltage in the unipolar map (heavy blue arrow); this likely indicates intramural or epicardial scar beyond that appreciated on the bipolar voltage map. C and D, Electrograms recorded from the orange dot at the inferior mitral annulus (thin blue arrow in A) in sinus rhythm and in VT, respectively. C, The terminal portion of the ablation signal (thin black arrow) is a late potential occurring after the terminal portion of the QRS, fused with the far-field electrogram. During VT (D), this electrogram is fractionated with a large presystolic component. An endocardial region of bipolar electrograms less than 1.5 mV is specific for subendocardial scar, but it does not identify epicardial or intramural scar.19,35 Epicardial and intramural scars can potentially be identified from unipolar recordings.38 Unipolar recordings filtered at 1 to 250 Hz contain substantial far-field signal. Endocardial unipolar signals less than 8.3 mV in the LV and less than 5.5 mV in the RV have been shown to be associated with epicardial or intramural scar despite endocardial bipolar electrogram amplitude greater than 1.5 mV (see Figure 124-3).38–40 The low voltage region is likely to contain the reentry circuit but is often large, exceeding 20 cm in circumference in many patients with infarct.27 Additional analyses of electrograms, voltage, or pacemapping are used to refine selection of target sites.41,42 Exit regions are typically located along the scar border (Figure 124-4). Pacing in the exit region replicates the QRS morphology of VT.42,43 The interval between the stimulus and QRS onset is typically short, which is consistent with its location in the infarct border. Figure 124-4 Findings from mapping in a patient with a prior anterior wall infarction are shown. The center and panel F show a voltage map viewed from the right anterior projection. Purple indicates an electrogram amplitude of 1.5 mV or greater. A gray region of electrically unexcitable scar is present. A, Ventricular tachycardia (VT)-2 that has a right bundle branch block configuration inferior axis configuration. Pacing at the superior aspect of the infarct (arrow) reproduces the VT-2 QRS morphology indicating that the exit for VT-2 is near the pacing site. B, Pacing at a site in the middle of the infarct. There is a delay of 170 ms from the pacing stimulus to the QRS, indicating slow conduction through the scar to the margin of the infarct. The paced QRS has a left bundle branch block superior axis configuration that matched VT-1, suggesting that the pacing site was in a channel used by VT-1; this is confirmed by pacing during VT-1 (D). There is entrainment with concealed fusion with a postpacing interval that matches the VT cycle length. Pacing resets tachycardia with a long stimulus to a QRS interval without changing the QRS morphology and with a postpacing interval (measured to the low-amplitude diastolic potential that is enlarged in panel of D) matches the VT cycle length. C, The exit for VT-1 was at the inferior margin of the infarct, where presystolic activity is recorded during VT. F, shows the potential channel (black arrow) with exits at the superior and inferior septal margin of the infarct, that likely used a loop along the border of the infarct. Potential ablation targets are the exits (red circles) or the channel (blue circles). (Modified with permission from Stevenson WG, Soejima K: Catheter ablation for ventricular tachycardia, Circulation 115:2750–2760, 2007.) Potential channels within low-voltage regions can be identified from analysis of electrograms and pacemapping. In some cases, the borders of potential channels are defined by dense fibrosis that has a lower amplitude electrogram than that of the channel (Figure 124-5).44,45 Similarly, if the border is dense fibrosis, it may be electrically unexcitable, such that pacing (10 mA at 2 ms pulse width with unipolar pacing) fails to capture.25 Marking these electrically unexcitable scar (EUS) areas (gray area on the voltage map in Figure 124-4) creates a visual map of potential channels in some patients. Narrow bands of fibrosis likely elude this method of detection. Pacing provides complimentary information to analysis of electrogram amplitude. EUS cannot be detected reliably based on electrogram amplitude alone. Pacing captures at many sites with low electrogram amplitudes of less than 0.25 mV. In contrast, some EUS sites have electrogram amplitude greater than 0.5 mV because of the presence of large far-field potentials from depolarization of a substantial mass of adjacent myocardium in the border area or outside the scar (see Figure 124-5). Figure 124-5 Recordings from a region of scar in patients with prior myocardial infarction and a schematic illustrating the potential reentry circuit location. A, Ventricular tachycardia (VT) is present. An isolated diastolic potential is present at the site (blue arrow). A potential is also inscribed during the QRS comlex, which is a far-field potential from depolarization of surrounding myocardium. Ablation at this site terminated VT (not shown). The recordings during sinus rhythm before (B) and after (C)
Catheter Ablation for Ventricular Tachycardia in Patients With Structural Heart Disease
Preparation and Consideration of Risks
Approach to Mapping and Ablation
QRS Morphology During Ventricular Tachycardia and Pacemapping
Initial Assessment of Induced Ventricular Tachycardia
Focal-Origin Ventricular Tachycardia
Scar-Related Reentry
Substrate Mapping During Sinus or Paced Rhythm
Voltage Maps
Exits and Channels
![]()
Stay updated, free articles. Join our Telegram channel

Full access? Get Clinical Tree


