Fig. 24.1
A single magnetic dipole moment in a static magnetic field of strength, B 0. It is customary to align the z axis of a rectangular coordinate system with the direction of the externally applied static magnetic field, B 0. In this example, the magnetic moment, initially aligned with the applied magnetic field, was tipped away from the z direction by an angle α through application of an oscillating magnetic field (not shown). The oscillating magnetic field is kept on only for the time necessary to tip the magnetic dipole moment by a certain angle, α in this example. After turning the oscillating magnetic field off, the magnetic dipole moment precesses about the B 0 direction at a frequency, νL = γB 0, where γ is a constant, the gyromagnetic ratio, and represents a property of the nucleus. For 1H nuclei, γ equals 42.6 MHz/Tesla. The angle ϕ denotes the phase angle of the magnetization component in the x–y plane, orthogonal to the direction of B 0

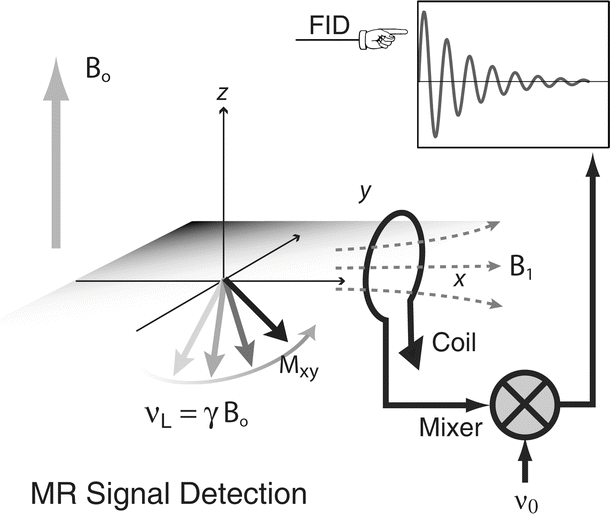
Fig. 24.2
The transverse magnetization component of a nuclear dipole precesses at the Larmor frequency , and produces an oscillating magnetic flux density that can be detected with a wire loop that is part of a resonant circuit. The induced voltage is amplified and mixed with the signal of an oscillator. The low frequency component from the mixer is a free induction decay with frequency, νL − νo. Often two coils, oriented perpendicular to each other, are used to detect the signal from the M x and M y components of the transverse magnetization, which are in quadrature, i.e., they have a relative phase difference of 90°. By detection of the quadrature components, it is possible to determine the sign of the difference νL − νo, and by combination of the two signals, after phase shifting one by 90°, one improves the signal-to-noise by a factor of  . FID free induction decay, MR magnetic resonance
 . FID free induction decay, MR magnetic resonance
Immediately after a radiofrequency excitation, individual magnetic moments that were tipped into the transverse plane become in-phase, i.e., they have the same phase angle. If all magnetic moments were to precess at exactly the same Larmor frequency, this phase coherence would persist. Residual magnetic field inhomogeneities, magnetic dipole interactions between neighboring nuclei, molecule-specific shifts of the precession frequency, and other factors produce a distribution of Larmor frequencies . The frequency shifts relative to a reference frequency can be tissue-specific, as in the case of 1H nuclei in fatty tissue. The spread of Larmor frequencies results in a slow loss of phase coherence of the transverse magnetization, i.e., the sum of all transverse magnetization components decays with time. The decay following a radiofrequency excitation is called free induction decay , and often has the shape of an exponential function with an exponential time constant denoted as T 2, roughly on the order of ~0.1 to ~102 ms for 1H nuclei in biological systems. In the presence of field inhomogeneities and other factors that cause a spread of Larmor frequencies, the transverse magnetization decay is further shortened. To distinguish this latter situation, one introduces a time constant, T 2 *, that is characteristic of the exponential decay of the transverse magnetization in “heterogenous” environments. It follows that T 2 * is always shorter than T 2.
After any radiofrequency excitation that tips the magnetization vectors away from the direction of the applied static magnetic field, B 0, the nuclear spins will, over time, realign themselves with the magnetic field to reach the same alignment as before the radiofrequency excitation. This time constant is denoted as T 1.
24.2.2 The Echo
A loss of phase coherence due to any spread in Larmor frequencies, for example, due to magnetic field inhomogeneities, can be (at least partially) reversed by applying a 180° pulse that flips the magnetization in the x–y plane such that the faster precessing spins now lag behind and the more slowly precessing spins are ahead, compared to spins precessing at the mean Larmor frequency. Once the echo amplitude peaks, the spread of Larmor frequencies again causes a loss of phase coherence. Multiple 180° pulses can be applied to repeatedly reverse the loss of phase coherence and thereby produce a train of spin echoes, referred to as fast spin echo imaging . The decay of the spin echo amplitudes is governed by the decay constant T 2, while a free induction decays with a characteristic time constant T 2 *, with T 2 * < T 2. Importantly, for cardiac imaging applications, it is useful to note that the spin echo (and spin echo trains in particular) provides a method to attenuate the signal from flowing blood, while obtaining “normal” spin echoes from stationary or slow moving tissue.
Spin echoes provide an effective means of refocusing the transverse magnetization for optimal MR signal detection. A similar, but nevertheless different, type of echo-like effect can be achieved by applying two magnetic field gradient pulses of opposite polarity instead of a 180° radiofrequency pulse. The first gradient pulse causes a rapid dephasing of the transverse magnetization; the second gradient pulse, of opposite polarity, can reverse this effect. An echo-type signal is observed, and peaks at the point where the phase wrap produced by the first pulse is . This type of echo is called a gradient echo .
A train of gradient echoes can be created by consecutive pairs of dephasing and rephasing gradient waveforms. The acquisition of multiple phase-encoded gradient echoes after a single radiofrequency excitation is useful for very rapid image acquisition, but is limited by the T 2 * decay of the signal.
A variation of the gradient echo technique that reestablishes phase coherence to the best possible degree before application of the next radiofrequency excitation (i.e., the next phase encoding step) can be used to produce a steady state. This allows the application of radiofrequency pulses with fairly large flip angles. Instead of relying on T 1 relaxation to return the magnetization from the transverse plane to the B 0 direction, the magnetization is toggled back and forth by the radiofrequency pulses between the z axis and the transverse plane. The attainable signal-to-noise ratio with this approach is significantly higher than with “conventional” gradient echo imaging. This type of gradient echo imaging is referred to in the literature by various acronyms—steady-state free precession imaging, true FISP, or balanced fast field echo imaging . In particular, for cardiac cine studies, this technique has led to a marked improvement of image quality. Steady-state free precession (SSFP) works best with very short repetition times which, in turn, impose high demands on the gradient system of the MR scanner in terms of ramping gradients up and down.
24.2.3 Image Contrast
Biological tissues and blood have approximately the same density of 1H nuclei, and spin-density images show poor contrast to differentiate (e.g., tissue from blood or fat from muscle). One of the most appealing aspects of MRI is the ability to manipulate the image contrast, based on differences in the T 1 or T 2 relaxation times. For a gradient echo sequence, the T 1 weighting is determined by the combination of flip angle and repetition time. Reducing repetition time or increasing the flip angle increases the T 1 weighting in the image.
The T 2 * weighting of a gradient echo image is controlled by the time delay between the radiofrequency pulse and the center of the readout window, i.e., the echo time TE. The T 2 weighting the spin echo signal is similarly determined by the echo time. In a fast spin echo sequence, one can use multiple echoes to read out the signal with different phase encodings for each echo. Controlling the T 1 weighting through adjustment of repetition time and the flip angle imposes some limits that can be circumvented by applying an inversion pulse before the image acquisition and performing the image acquisition as rapidly as possible. The time between the inversion pulse and the start of the image acquisition controls the T 1 contrast in this case. The image acquisition after the magnetization inversion is typically performed with a gradient echo sequence that uses small flip angles, i.e., the T 1 contrast is controlled by the prepulse and the delay after the prepulse, instead of the repetition time and the flip angle, α, of the gradient echo image acquisition. Gradient echo imaging with a magnetization preparation in the form of a 180° or 90° radiofrequency pulse is often the method of choice to acquire rapidly T 1-weighted images of the heart.
MR contrast agents , such as gadolinium, provide a further means for controlling the image contrast by injecting a compound with paramagnetic ions that reduce the T 1 of blood and tissue permeated by the agent. The local T 1 reduction depends on: (1) delivery of contrast agent to the tissue region through the blood vessels; (2) the degree to which the contrast agent molecules can cross barriers such as the capillary barrier; and (3) the distribution volume of the contrast agent within the tissue. The contrast seen after the injection of such an agent can be used to determine pathology, such as the breakdown of the cardiac cell membranes and/or an above normal concentration of contrast agent in infarcted myocardium.
24.3 Cardiac MR Techniques and Applications
24.3.1 Cardiac Morphology
The accurate depiction of cardiac morphology is important in most imaging applications. Numerous MR techniques have been developed and they are generally categorized based on the appearance of the intracardiac blood in the image, as either black– blood or bright–blood techniques .
Spin–echo (SE) was the first sequence used for the evaluation of cardiac morphology, however it was not until the advent of ECG-gating that SE imaging became substantially more important by reducing motion artifacts associated with the beating heart. SE images are called black–blood images due to the signal void created by flowing blood, which provides very good contrast between the myocardium and the blood. Slower moving blood, particularly adjacent to the ventricular walls, however, can cause the blood signal to appear brighter, effectively reducing the quality of the image. So, presaturating with a radiofrequency pulse and reducing the echo time (TE) is used to minimize the blood signal and increase the contrast in the image [1]. Although widely available, SE imaging is limited due to its poor temporal resolution and susceptibility to respiratory and other motion artifacts. Nevertheless, these problems have been overcome through the development of sequences with shorter acquisition times, so-called fast (or turbo) SE pulse sequences . Although soft tissue contrast is not as optimal, these sequences have become the frontline sequence for depiction of cardiac morphology (Fig. 24.3).


Fig. 24.3
Cardiac anatomy of a canine heart imaged with a T2-weighted fast spin echo sequence and in-plane resolution of 1.2 mm. Cardiac structures such as the left ventricle (LV), right ventricle (RV), and aorta are labeled. The signal from blood in the ventricular cavities was nulled by a magnetization preparation consisting of radiofrequency inversion pulses. Furthermore, the use of an echo train (with seven spin echoes in this case) and a long effective echo time also causes attenuation of the signal from moving blood. These so-called black–blood imaging techniques are very useful for anatomical imaging to avoid image artifacts from flowing blood
24.3.2 Global Cardiac Function
Global and regional assessments of ventricular function with MRI are very well established and have been shown to be accurate and reproducible compared with other imaging modalities for the calculation of volume, mass, and derived parameters such as stroke volume and ejection fraction [2, 3]. Thus, it is now considered the gold standard for the evaluation of cardiac function and mass in numerous studies comparing different imaging modalities [4].
Cine loops are acquired to follow the changes in ventricular dimensions over the entire cardiac cycle and thus to assess cardiac function. The acquisition of each image in the cine loop is broken up into several “segments,” and the image segments are acquired over consecutive heart beats, as shown in Fig. 24.4. The acquisition of such image segments for each cardiac phase is subsequently synchronized with the heart cycle by gating of the encoding steps with the patient’s electrocardiogram. This technique works well as long as the subject has a regular heart beat. The final result of the segmented acquisition is a series of images, one for each phase of the cardiac cycle. These images can be played as a cine loop, e.g., to assess ventricular function. To increase the sharpness of the quality of images, clinicians ask patients to hold their breath during image acquisition. The segmented data acquisition approach always involves a tradeoff between temporal resolution (i.e., number of frames covering one R-to-R interval) and spatial resolution, as the image acquisition needs to be performed within a time short enough to allow for suspended breathing.
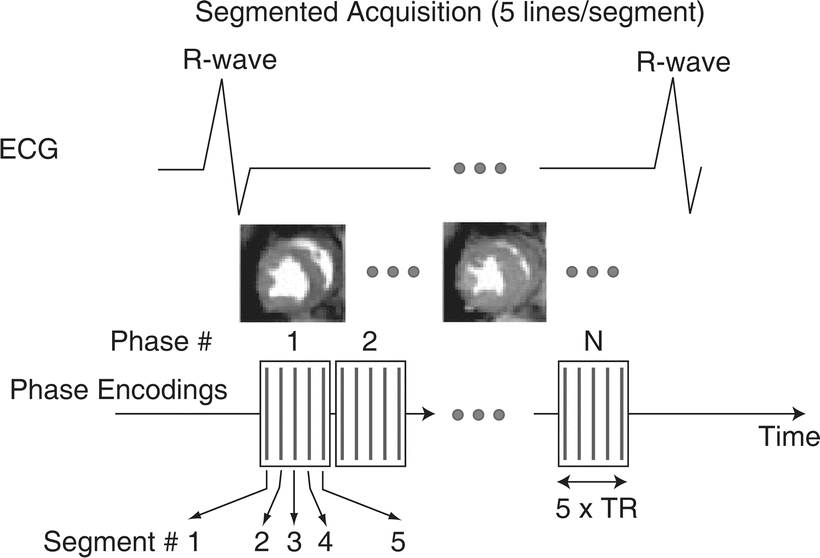

Fig. 24.4
Illustration of the principle of segmented acquisition of data , as that used for imaging multiple phases of the cardiac cycle in ventricular function studies. The image acquisition is synchronized to the cardiac cycle by triggering of the pulse sequence with the R-wave on the ECG. The total number of phase encodings is split into five groups or segments in this example. The same five phase encodings are performed during each phase of one cardiac cycle. During the next R-to-R interval, five other phase encodings are performed for each cardiac phase. The R-wave-triggered acquisition of phase encodings is repeated k number of times to obtain a total of k · 5 phase encodings. The temporal extent of each cardiac phase is shown in the diagram by the boxes that contain the symbolic representations of the phase-encoded lines as vertical lines. The temporal resolution (TR) of the resulting cine loop is determined by the number of lines per segment (five in this example) and the repetition time for each phase encoding step. Typical resolutions are on the order of 40–50 ms for resting heart rates, and higher during inotropic stimulation of the patient’s heart. The image acquisition is performed while the patient holds his/her breath. In this example the required duration of the breath-hold would be k heart beats, with k typically on the order of 10–20, depending on the heart rate
Typically, for the measurement of global cardiac function, bright–blood cine MRI is performed in multiple short-axis views, covering the heart from base to apex, using a multiphase, segmented k-space, gradient echo (GRE) sequence [5–7]. Yet to date, GRE studies have suffered due to saturation effects in areas of low blood velocity, causing reduced contrast between blood and myocardium within the ventricular cavity [8]. In general, this problem causes difficulties in detection of the endocardial border, most dramatically in long-axis views of the heart where there is very minimal motion of blood through the imaging plane, as the majority of blood is moving within the image plane in these views as shown in Fig. 24.5A. Such problems associated with GRE cine imaging have recently been minimized with the advent of SSFP sequences (Fig. 24.5).
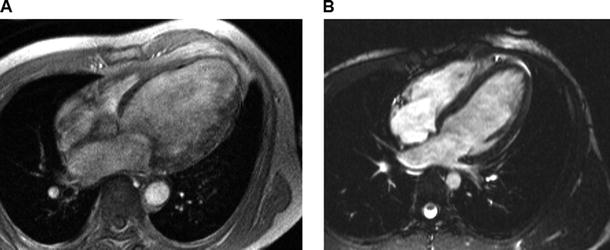

Fig. 24.5
Comparison of end-diastolic long-axis views acquired with a segmented gradient echo sequence (left) and a steady-state free precession (SSFP) sequence (right). The SSFP technique provides significantly higher contrast to noise between intraventricular blood and myocardium, resulting in improved endocardial border definition throughout the cardiac cycle, as compared with the older gradient echo sequence
Although the concept of SSFP imaging has been described in the literature for many years, only recently has MR hardware developed to the point that these techniques have become practical and available on clinical scanners (e.g., those from multiple vendors) [9, 10]. SSFP sequences have dramatically improved contrast-to-noise, shortened acquisition times, and increased both spatial and temporal resolution in comparison with previous GRE techniques [2, 11, 12]. These improvements have enhanced the detection of the epicardial and endocardial surfaces (delineation of trabeculation and papillary muscle), both manually and with automated detection schemes, resulting in improved accuracy and reproducibility for the quantification of cardiac mass and volumes [13, 14]. Scan times have been reduced as well, such that SSFP sequences for an entire 3D data set covering the heart can be acquired within a single breath-hold.
SSFP techniques are also employed in the emerging area of real-time MR imaging. Recently, real-time imaging techniques have been developed and improved such that they will be employed in future cardiac function studies, as well as in the emerging field of interventional imaging with MRI. These real-time sequences continuously acquire images of the heart with sufficiently high temporal resolution similar to fluoroscopy [15] without the need for ECG triggering or breath-holding, therefore making it possible to image patients with severe arrhythmias or heart disease. In the past, these were difficult requirements to fulfill with segmented k-space GRE or SSFP sequences. Furthermore, newly developed sequences implementing image reconstruction techniques with sensitivity encoding (SENSE) and simultaneous acquisition of spatial harmonics (SMASH) have reported imaging temporal resolutions down to 13 ms with a spatial resolution of 4.1 mm [16].
24.3.3 Regional Myocardial Function
Ventricular volumes and derived parameters such as stroke volume and ejection fraction are the most commonly used variables for the assessment of systolic function in the clinical setting, however they have associated limitations related to the measurement of contractile properties of the heart. Furthermore, these descriptors of cardiac performance do not take into consideration the importance of regional contractile dysfunction, the degree and extent of which are important prognostic factors with ischemic heart disease, and/or following myocardial infarction [17–19]. It is generally accepted that quantitative estimates of wall motion and relative changes in wall thickening (expressed as % of end-diastolic wall thickness) are useful for measuring regional function and are also more precise than the subjective visual wall motion scoring system which is commonly used in the clinic today [20, 21]. Wall motion changes and thickening are usually measured along the length of a center line between the segmented endocardial and epicardial borders of the heart. They are further divided into myocardial segments of equal circumferential extent which are positioned relative to the location of an anatomical landmark such as the anterior-septal junction of the left ventricle and right ventricle. Dynamic changes in wall thickening can be considered as the radial component of myocardial strain , defined as the percent change in dimension from a resting state. Such strain analyses have proven very useful for the assessment of regional contractile function in both animals and human patients [22–24].
Circumferential shortening and radial thickening are two components of myocardial strain typically assessed by MRI tagging [25–29]. This approach has a higher sensitivity to the identification of noncontracting regions of the myocardium compared to “conventional” cine MRI. As such, cine imaging of the heart can be combined with a series of magnetization preparation pulses that null the longitudinal magnetization along thin parallel stripes in the slice plane. The stripes or tags appear as black lines on the MR images and can be applied in two directions in a single slice, forming a grid pattern. This grid pattern is created immediately after the R-wave of the EKG and before acquisition of the segmented phase encodings (Fig. 24.4). The grid tags visible in the resulting images are “imbedded” in the tissue and are therefore distorted if any myocardial motion occurs. Thus, intramyocardial displacements and myocardial strain can be tracked through monitoring visible motion and deformation of the tag lines, respectively. Figure 24.6 shows an example of a myocardial grid pattern laid down at end-diastole and, in a second frame, the same pattern is recorded at end-systole with evident distortion of the tag lines due to myocardial contraction. The tag lines, created right after the R-wave, tend to fade during the cardiac cycle due to T 1 relaxation, but for normal resting heart rates (e.g., 60–70 beats/min) the tag lines can persist long enough to allow visualization of cardiac motion over nearly the entire R-to-R interval. Importantly, tag lines in the ventricular blood pool disappear very quickly because of the rapid motion and mixing of blood in the ventricle; this effect is then useful for clearly defining the endocardial borders.
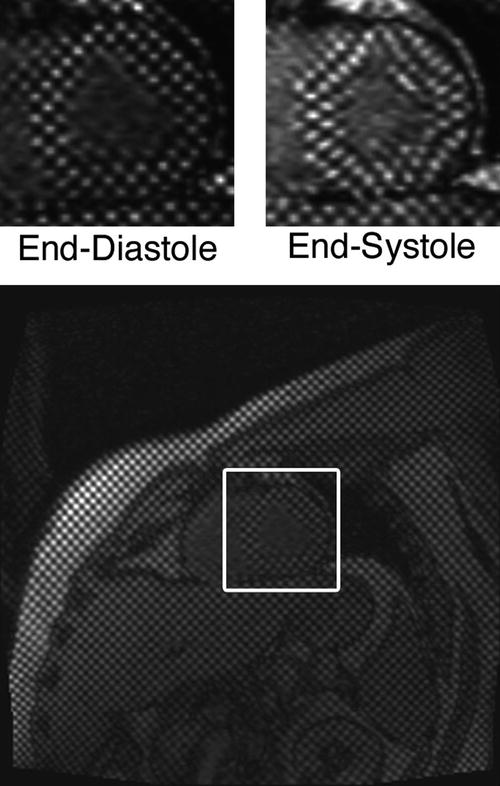

Fig. 24.6
Images with spatial modulation of magnetization in the form of vertical and horizontal stripes in a human volunteer. The grid-tag lines spaced 6 mm apart were created immediately after the R-wave of the ECG. The upper left panel shows a magnified view of the heart during this initial phase. A second image is shown on the upper right for an end-systolic phase, with the distortion of the tag lines due to cardiac contraction clearly apparent. The tagging technique is equivalent to the implantation of intramyocardial markers. Tracking of the tag lines over the cardiac cycle allows determination of myocardial strains, and has been shown to provide a sensitive method for assessing regional wall motion abnormalities
24.3.4 Myocardial Perfusion
Myocardial blood flow is assessed using very rapid MR imaging of the heart during the first passage of an administered contrast agent through the heart. T 1 changes in the myocardium are directly proportional to the contrast agent concentration in the blood or tissue [30, 31], so that through the use of T 1-weighted imaging techniques, myocardial territories affected by a coronary artery lesion can be both qualitatively and quantitatively evaluated. Furthermore, the myocardial territory affected by a coronary artery lesion may or may not show a perfusion deficit under resting conditions; however, during an imposed pharmacological stress, a stenotic vessel cannot respond (dilate) like a healthy vessel resulting in vascular steal , a phenomenon in which increased blood flow to the myocardium is supplied by nonstenotic vessels [32]. Consequently, the relative blood flow is reduced through stenotic vessels resulting in a detectable perfusion deficit in the images; as such, both areas of reversible and nonreversible (scar) defects can be represented [33].
First pass perfusion imaging in typically performed using multislice fast gradient-echo imaging with saturation-recovery magnetization preparation obtained during the rapid administration (7 ml/s) of a small contrast agent dose (approximately 0.04 mmol/kg for the extracellular gadolinium agent Gd-DTPA). A saturation-recovery magnetization preparation consists of a nonslice selective 90° radiofrequency pulse, followed by a gradient crusher pulse designed to dephase the transverse component of the magnetization [34]. This preparation drives the magnetization into a well-defined state, permitting the acquisition of a T 1-weighted GRE signal that is independent of the properties of any previous relaxation delay, thus preventing fluctuations in the image signal intensities due to variations in the heart rate or ECG trace. Nevertheless, imaging is typically performed throughout the duration of 40–50 heart beats to adequately capture the first pass of the injected contrast agent through the heart. With currently employed clinical 1.5 Tesla MRI scanners (with state-of-the-art gradient coils and amplifiers producing gradient field amplitudes of 20–40 mT/m with slew rates up to 150 mT/m/s), this imaging can be done in approximately 3–4 slices for every heart beat, with an in-plane image resolution of 2 mm or better.
Qualitative analyses of perfusion studies can be made by viewing the sequence of images as a movie loop, and then visually grading the rate of contrast enhancement in myocardial segments. However, qualitative assessments are highly observer-dependent and thus are also subjective to misinterpretation based on image artifacts or variations in the image brightness due to the inhomogeneous detection of the MR signal by the surface coils. Therefore, in the future, a more quantitative technique based on the time course of signal intensity in the different myocardial segments of interest can provide an objective and robust method of analysis (Fig. 24.7).
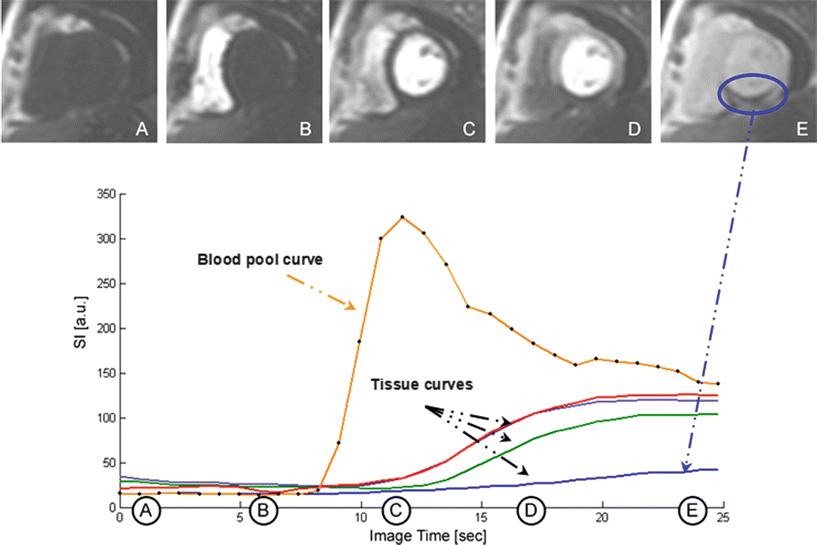

Fig. 24.7
A sample of images acquired using a fast T 1-weighted gradient echo sequence during a bolus injection of 0.04 mmol/kg of the extracellular contrast agent Gd-DTPA is shown, with the resulting signal intensity curves for the left ventricular blood pool and several myocardial segments below. The first image in the series (A) shows a short-axis image of the heart prior to injection of the contrast agent. Following injection, the contrast agent quickly enters the right ventricle (B) and left ventricle (C) and then passes through the coronary and microcirculation (D, E) causing signal enhancement throughout the myocardium. This example shows a clear perfusion defect in the inferior wall of the left ventricle which can be seen in images D and E (circled) and also the corresponding tissue curve immediately following the first pass of the contrast through the left ventricle
24.3.5 Myocardial Viability
The ability to distinguish nonviable myocardium is of critical importance in the management of patients with both acute and chronic coronary artery disease syndromes, yet this is complicated by the presence of reversibly damaged and infarcted myocardium. Until very recently, thalium single proton emission computed tomography (SPECT) and positron emission tomography (PET) were the primary tools for evaluation of myocardial viability. However, with the development of delayed contrast-enhanced MRI (ce-MRI) , the cardiac MRI method has quite dramatically and rapidly ascended into the forefront of viability imaging [35, 36]. In general, this technique has been shown to identify irreversibly damaged myocardium in both acute and chronic settings following a myocardial infarction and, in tandem with cine imaging, can be used to consistently predict reversibly damaged tissue that may benefit from revascularization and/or other therapies [37, 38]. Furthermore, with the availability of substantially higher spatial resolution than nuclear techniques, ce-MRI can detail the transmural extent of irreversibly damaged tissue and detect both small and large subendocardial defects not identified by either SPECT or PET [39, 40].
So-called delayed ce–MRI is performed following the intravenous administration of a gadolinium-chelate contrast agent; typical dosages for imaging viability are on the order of 0.1–0.2 mmol/kg. The contrast agents more readily cross the cell membrane due to the severe myocardial injury and loss of viability [33, 35, 41, 42]. After an appropriate delay (approximately 10–15 min), the contrast agent achieves approximate distribution equilibrium, and loss of functional viability and subsequent leakage of contrast agent result in T 1-weighted signal enhancement because the distribution volume of the contrast agent is larger in the injured tissue compared to normal. Such imaging is typically performed under resting conditions using a breath-hold “inversion recovery” prepared and T 1-weighted segmented GRE sequence. The appropriate inversion delay time following the inversion pulse (approximately 250 ms or less) results in signal nulling of viable myocardium. Note that, for the best results, appropriate inversion delay times are iteratively chosen for each patient. This results in images where the normal viable myocardium is dark, nonviable, fibrotic, or scarred tissue has dramatically increased (hyperenhanced) signal intensity (Fig. 24.8). Typically, one or two signal averages are used with an in-plane image resolution of approximately 1.5 mm; this approach as a 2D sequence requires multiple breath-holds to encompass the left ventricle and can be typically accomplished in less than 10 min. In addition, 3D approaches can also be used which cover the entire ventricle in a single, yet longer breath-hold with comparable, but not as good, image quality.
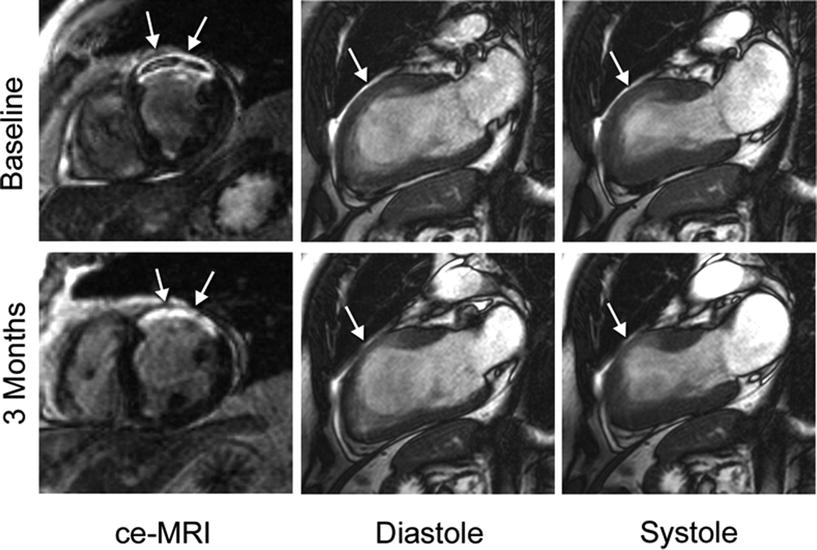

Fig. 24.8
Example of an initial and follow-up MRI exam comparing the region of infarction (arrows) with wall thickness and contractility. The acute study at 2 days (top) shows evidence of microvascular obstruction within the infarct and reduced wall thickening in the anterior region, shown here by long-axis cine images. During the 3-month study (bottom), there is no longer a sign of microvascular obstruction within the infarct territory, diastolic wall thickness has decreased, and contractility has improved in regions adjacent to the infarcted territory
While the delayed ce-MRI sequence is the most widely accepted approach for viability imaging with MRI, there are other less popular techniques that should be mentioned (e.g., imaging with the use of a manganese-based contrast agent). Manganese is a Ca++ analog which is actively taken up by viable cells, thus in obtaining T 1-weighted images, viable tissue is enhanced (bright) while nonviable tissue remains dark [43]. Manganese contrast agents are not currently being used in clinical cardiac imaging; however, this may provide an effective alternative method in the near future. MRI of sodium or potassium are also effective methods with potential for imaging viability, but their use remains strictly a research tool due to the very limited availability of multifrequency MRI scanners for clinical use [44].
24.3.6 Blood Flow Velocity
A recorded MR signal can be represented in terms of a magnitude and a phase component. As such, MRI images can be analyzed to elicit the spatial variations of the signal magnitude, but it is also possible to create maps showing the spatial variations of the signal phases. Furthermore, it has been shown that the phase of the signal is sensitive to the velocity of tissue or blood. The so-called phase contrast MRI technique uses the phases of the signals to measure relative velocities. For an in-depth discussion of these methodologies, we refer the reader to the literature. Yet, an example of a phase contrast flow velocity measurement in an aorta is shown in Fig. 24.9, which has been used to calculate pulse wave velocities for measuring vessel stiffness [45].
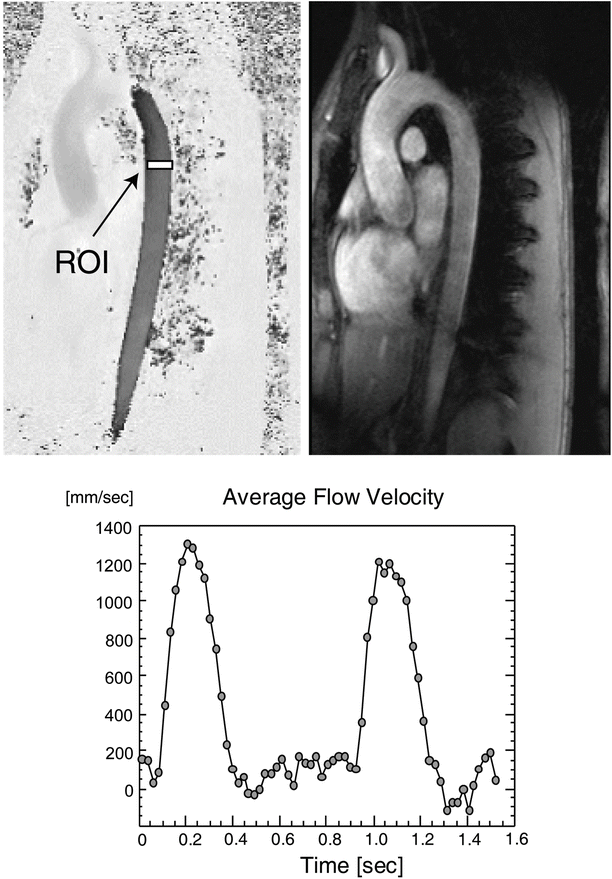

Fig. 24.9
Phase contrast imaging of the aorta in a human volunteer. Both the magnitude and phase images are shown. Images were acquired for X cardiac phases, covering approximately 2.5 heart beats. A region of interest (white box) was placed on the phase images in the thoracic aorta to determine the variation of flow velocity in the vertical direction of the image plane. The variation of the velocity is shown in the graph. ROI region of interest
24.3.7 Fiber Structure
24.3.7.1 Importance of Myofiber Orientation
The analysis of myocardial microstructure continues to be considered an important factor in better understanding underlying pathologies and/or associated arrhythmias. This is due to the fact that structural fiber arrangement is modified over the time course of various cardiomyopathies. In the healthy heart, it is generally accepted that cardiac muscle fibers or myofibers are arranged as counter-wound helices encircling the ventricular cavities and where fiber orientation is a function of their transmural location [46–48]. Further, myofibers are predominantly organized in the base–apex direction at the epicardial and endocardial surfaces, and rotate to a circumferential direction in the mid-wall. This counter-wound helical structure is considered to be responsible for the torsional or wringing motion of the left ventricle which serves three main mechanical functions: (1) equalizing myofiber strain and workload; (2) optimizing the volume of blood ejected during systole (stroke volume); and (3) storing torsional energy in the intracellular and extracellular matrix, and when released, increasing ventricular filling during diastole [49–56]. Therefore, cardiac fiber orientation can also be considered as one of the primary determinants of ventricular pump function.
24.3.7.2 Quantifying Fiber Structure with Diffusion Tensor MRI
More recently, diffusion tensor MRI (DTMRI) has been developed and employed as a nondestructive means to quantify 3D ventricular fiber orientation [46, 57–60]. The underlying principle in determining cardiac fiber orientation by DTMRI is that the fastest direction of water diffusion corresponds to the local myofiber orientation. Therefore, by obtaining a series of diffusion-weighted images, the effective diffusion tensor of water in the myocardium can be estimated using a relationship between the measured echo attenuation in each imaging voxel and the applied diffusion sensitizing gradient [61]. As such, diffusion-weighted pulse sequences are designed such that molecular displacements in the direction of the applied diffusion sensitizing gradients will attenuate the echo signal, thus enabling the estimation of water diffusivity in a given direction. The strength of the diffusion weighting or b-value usually ranges from 500 to 1500 s/mm2 in cardiac DTMRI. The diffusion tensor, which is a symmetric 3 × 3 second rank tensor, is determined for each imaging voxel and represents the net 3D diffusion in the tissue. In order to determine the required six independent parameters of the diffusion tensor, at least seven images must be obtained for a given slice—six diffusion-weighted images applied in six noncolinear directions and one diffusion-independent image. However, it is also common to estimate the diffusion tensor by obtaining many diffusion-weighted images varying in direction (12–16 directions) and b-value, where the best fit for the diffusion tensor can be determined using multilinear regression. Nevertheless, ventricular fiber orientation can be obtained with DTMRI due to the anisotropic nature of water diffusion in the myocardium [62]. The fastest direction of diffusion or primary eigenvector of diffusion has been validated to coincide with the local longitudinal myofiber orientation, as water diffusion in the cross fiber directions is restricted by the cellular borders and laminar sheets in the myocardium [63, 64]. Note that the secondary and tertiary eigenvectors of diffusion correlate with the laminar sheet direction and sheet normal, respectively [58, 65, 66].
< div class='tao-gold-member'>
Only gold members can continue reading. Log In or Register to continue
Stay updated, free articles. Join our Telegram channel

Full access? Get Clinical Tree


