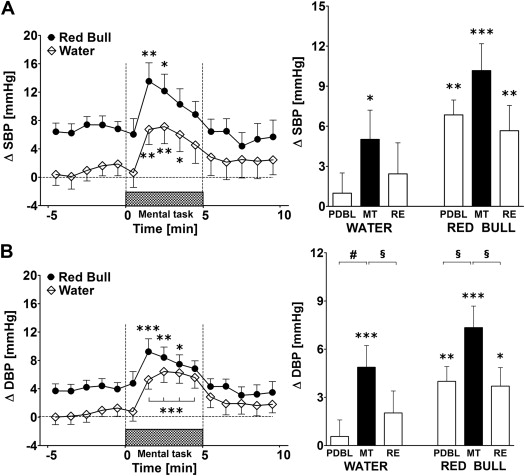
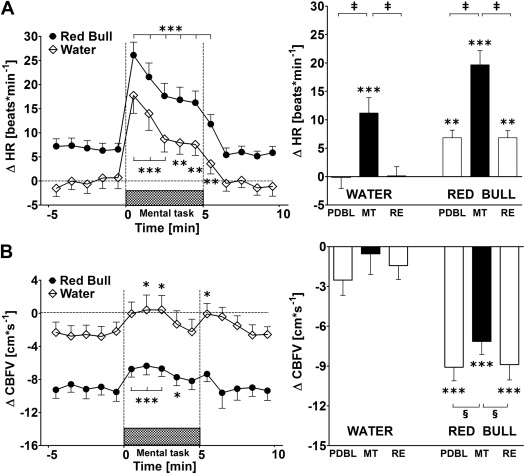
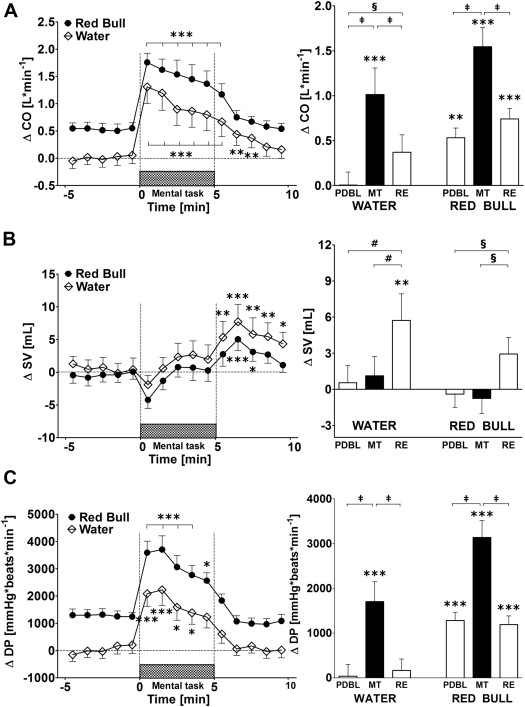
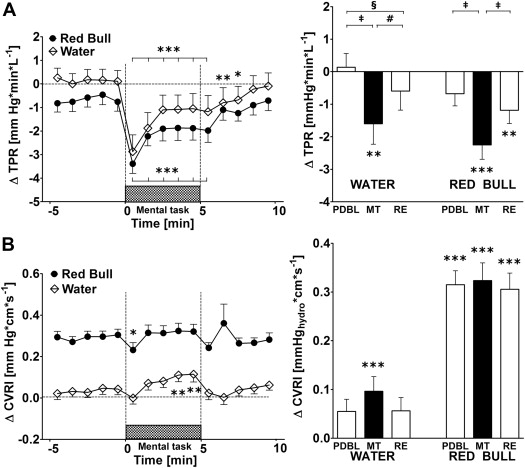
The sale of energy drinks is often accompanied by a comprehensive and intense marketing with claims of benefits during periods of mental stress. As it has been shown that Red Bull negatively impacts human hemodynamics at rest, we investigated the cardiovascular and cerebrovascular consequences when Red Bull is combined with mental stress. In a randomized cross-over study, 20 young healthy humans ingested either 355 ml of a can Red Bull or water and underwent 80 minutes after the respective drink a mental arithmetic test for 5 minutes. Continuous cardiovascular and cerebrovascular recordings were performed for 20 minutes before and up to 90 minutes after drink ingestion. Measurements included beat-to-beat blood pressure (BP), heart rate, stroke volume, and cerebral blood flow velocity. Red Bull increased systolic BP (+7 mm Hg), diastolic BP (+4 mm Hg), and heart rate (+7 beats/min), whereas water drinking had no significant effects. Cerebral blood flow velocity decreased more in response to Red Bull than to water (−9 vs −3 cm/s, p <0.005). Additional mental stress further increased both systolic BP and diastolic BP (+3 mm Hg, p <0.05) and heart rate (+13 beats/min, p <0.005) in response to Red Bull; similar increases were also observed after water ingestion. In combination, Red Bull and mental stress increased systolic BP by about 10 mm Hg, diastolic BP by 7 mm Hg, and heart rate by 20 beats/min and decreased cerebral blood flow velocity by −7 cm/s. In conclusion, the combination of Red Bull and mental stress impose a cumulative cardiovascular load and reduces cerebral blood flow even under a mental challenge.
Recently, we observed an overall negative hemodynamic profile in response to ingestion of 335 ml of Red Bull, but, to date, there are no data available about whether ingesting an energy drink modifies hemodynamic variables associated with a short-term mental task using beat-to-beat cardiovascular and cerebrovascular measurements. Hence, the purpose of the present study was to determine the hemodynamic impact of a simple mental arithmetic task combined with previous ingestion of Red Bull. As a second aim, we investigated whether the perceived stress level and number of mistakes during mental stress were improved in response to previous consumption of Red Bull.
Methods
Twenty healthy young adults (10 women), aged 19 to 29 (22.1 ± 0.5) years, were recruited and paid for their participation. The mean height of the participants was 173.3 ± 2.0 cm, their body weight was 65.7 ± 2.4 kg, and their body mass index was 21.8 ± 0.6 kg m −2 . None of the subjects had any diseases or were taking any medication affecting cardiovascular or autonomic regulation. Based on a questionnaire (daily intake of coffee, energy drinks, and other caffeinated beverages), the estimated daily caffeine intake of study participants ranged from 1 to 4 drinks per day. All participants fasted for ≥12 hours and they were requested to avoid alcohol or caffeine for at least 24 hours before the test. The local ethics committee approved the study, and written informed consent was obtained from each subject.
All experiments took place in a quiet, temperature-controlled (22°C) laboratory and started between 08.00 a.m. and 09.00 a.m. Every subject attended 2 separate experimental sessions (each session separated at least by 2 days) according to a randomized cross-over design. On arrival at the laboratory, subjects were asked to empty their bladders if necessary and to sit in a comfortable armchair. Equipment for cardiovascular and cerebrovascular recordings was then attached. After a variable period for attainment of cardiovascular stability (usually 30 minutes), a baseline recording was made for 20 minutes. Then, the test subjects ingested, not blinded, either 355 ml of a degassed Red Bull drink containing caffeine (114 mg), taurine (1420 mg), and glucuronolactone (84.2 mg), sucrose, and glucose (39.1 g) or 355 ml of tap water at room temperature. Subjects were asked to ingest their drink in a convenient pace for over 4 minutes. After 80 minutes of postdrink cardiovascular recordings, a mental arithmetic task was performed for 5 minutes followed by 5 minutes recovery period.
Subjects subtracted continuously the number 6 or 7 (chosen at random) from a random 3 or 2 digit number for 5 minutes and were instructed to give the answer verbally. Each mental stress task comprised of 60 unique calculations, with 5 seconds interval between each calculation and was presented to the subjects on a monitor. Immediately after the mental task, subjects were asked to rate their perceived stress using a standard 5-point Likert scale.
Cardiovascular and electrocardiographic (cardiac intervals) recordings were performed using a Task Force Monitor (CNSystems, Medizintechnik, Graz, Austria) with data sampled at a rate of 1,000 Hz as described previously. Cerebral blood flow velocity was measured using transcranial Doppler ultrasonography (Doppler-Box, DWL, Sipplingen, Germany). The left and the right middle cerebral artery was insonated at a depth of 40 to 55 mm using a 2 MHz probe, and the probe was fixed in place with an adjustable headset. Beat-to-beat values of systolic, diastolic, and mean velocity were recorded and merged real time with the Task Force Monitor to allow synchronous cardiovascular and cerebrovascular recordings.
Beat-to-beat values of cardiac interval, systolic blood pressure (BP), diastolic BP, cerebral blood flow velocity, and stroke volume were averaged over the 20 minutes predrink baseline period and minute by minute starting 5 minutes before (postdrink baseline), during (mental task for 5 minutes) and after the mental stress (recovery for 5 minutes). Heart rate was calculated by the appropriate RR interval. Cardiac output was computed as the product of stroke volume and heart rate. Mean BP was calculated from diastolic BP and systolic BP, respectively: mean BP = diastolic BP + 1/3 (systolic BP − diastolic BP). Total peripheral resistance was calculated as mean BP divided by cardiac output. Double product was calculated as heart rate × systolic BP and provides valuable information for the oxygen consumption of the myocardium. Cerebrovascular resistance index was calculated as the mean BP at brain level (BP mean_brain ) divided by mean cerebral blood flow velocity. BP mean_brain was calculated as the difference between mean BP at heart level and the hydrostatic pressure (BP hydro ) at the level of transcranial insonation (temporal bone window).
Data are expressed as means ± SEM. Statistical analysis was performed by 2-way analysis of variance for repeated measures with time (6 time points: postdrink baseline, mental task 1 to 5 minutes) and treatment (water or Red Bull) as within-subject factors using statistical software (Statistix version 8.0; Analytical Software, St. Paul, Minnesota). The effects of each drink over time were analyzed by comparing values at each time point over the mental task and recovery period with the averaged postdrink baseline values recorded during the 5 minutes immediately before the mental task ( Figures 1 to 4 ) using repeated measures analysis of variance with Dunnett’s multiple comparison post hoc testing. Changes between postdrink baseline, mental task, and recovery were evaluated using repeated measures analysis of variance with Newman-Keuls post hoc testing ( Figures 1 to 4 ). A Wilcoxon matched pairs test was used to elicit differences in mistakes and stress perception in response to the drink (GraphPad Prism version 5, GraphPad Software, Inc, San Diego, California). All reported p values were 2-sided and the level of statistical significance was set as p <0.05.


Results
Predrink hemodynamic values were similar between the drinks, whereas Red Bull elevated significantly systolic and diastolic BP, heart rate, cardiac output, double product, cerebrovascular resistance, and decreased cerebral blood flow velocity over the postdrink period ( Table 1 and Supplementary Tables 1 and 2 ).
| Treatment | Water | Water | Red Bull | Red Bull | Water | Water | Red Bull | Red Bull | Water | Water | Red Bull | Red Bull |
|---|---|---|---|---|---|---|---|---|---|---|---|---|
| Condition | Pre-drink | Post-drink | Pre-drink | Post-drink | Pre-drink | Post-drink | Pre-drink | Post-drink | Pre-drink | Post-drink | Pre-drink | Post-drink |
| Case | SBP [mmHg] | SBP [mmHg] | SBP [mmHg] | SBP [mmHg] | DBP [mmHg] | DBP [mmHg] | DBP [mmHg] | DBP [mmHg] | HR [bpm] | HR [bpm] | HR [bpm] | HR [bpm] |
| 1 (20 years) | 130 | 130 | 120 | 130 | 80 | 82 | 70 | 77 | 62 | 61 | 64 | 67 |
| 2 (23 years) | 115 | 122 | 108 | 119 | 74 | 77 | 69 | 78 | 63 | 66 | 67 | 72 |
| 3 (29 years) | 129 | 127 | 122 | 132 | 85 | 81 | 80 | 90 | 70 | 68 | 68 | 70 |
| 4 (20 years) | 113 | 117 | 113 | 121 | 76 | 77 | 78 | 84 | 58 | 58 | 65 | 72 |
| 5 (24 years) | 133 | 145 | 146 | 155 | 79 | 81 | 81 | 79 | 67 | 62 | 63 | 59 |
| 6 (22 years) | 114 | 115 | 110 | 129 | 73 | 75 | 71 | 79 | 56 | 74 | 65 | 77 |
| 7 (22 years) | 122 | 119 | 116 | 120 | 85 | 87 | 82 | 86 | 95 | 76 | 81 | 86 |
| 8 (19 years) | 143 | 134 | 133 | 137 | 86 | 82 | 80 | 81 | 69 | 70 | 64 | 82 |
| 9 (23 years) | 117 | 119 | 121 | 122 | 74 | 76 | 81 | 79 | 58 | 65 | 58 | 67 |
| 10 (24 years) | 101 | 116 | 111 | 115 | 69 | 80 | 71 | 76 | 58 | 60 | 62 | 66 |
| 11 (23 years) | 115 | 119 | 120 | 135 | 76 | 75 | 78 | 85 | 53 | 53 | 59 | 66 |
| 12 (20 years) | 104 | 106 | 99 | 105 | 66 | 70 | 63 | 64 | 63 | 53 | 55 | 58 |
| 13 (22 years) | 114 | 115 | 111 | 113 | 68 | 72 | 71 | 72 | 50 | 65 | 47 | 59 |
| 14 (23 years) | 113 | 117 | 124 | 135 | 74 | 76 | 80 | 88 | 61 | 62 | 66 | 68 |
| 15 (20 years) | 116 | 124 | 117 | 128 | 79 | 80 | 81 | 93 | 69 | 78 | 71 | 89 |
| 16 (20 years) | 112 | 115 | 107 | 111 | 67 | 70 | 66 | 68 | 60 | 61 | 56 | 61 |
| 17 (21 years) | 105 | 95 | 109 | 114 | 65 | 59 | 69 | 72 | 73 | 65 | 69 | 71 |
| 18 (22 years) | 112 | 106 | 120 | 125 | 77 | 75 | 87 | 86 | 64 | 66 | 68 | 69 |
| 19 (21 years) | 120 | 108 | 116 | 116 | 76 | 64 | 67 | 70 | 64 | 55 | 68 | 77 |
| 20 (23 years) | 111 | 110 | 120 | 120 | 74 | 72 | 86 | 84 | 80 | 72 | 74 | 89 |
| Average | 117 | 118 | 117 | 124* | 75 | 76 | 76 | 80* | 65 | 64 | 65 | 71 * |
| SEM | 2 | 2 | 2 | 3 | 1 | 1 | 1 | 2 | 2 | 2 | 2 | 2 |
Stay updated, free articles. Join our Telegram channel

Full access? Get Clinical Tree


