Fig. 34.2 Ventricular fibrillation. Sinus rhythm, giving way to a high frequency ventricular rhythm, whose amplitude falls quickly.

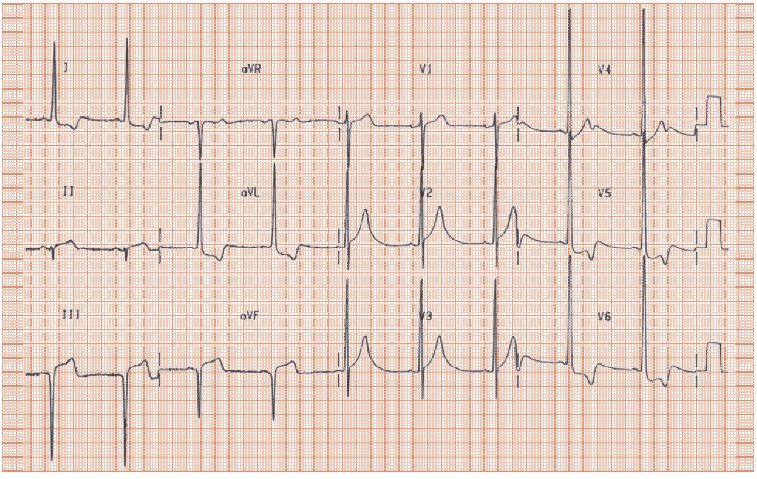
Fig. 34.3 Hypertrophic cardiomyopathy (HCM). Grossly abnormal ECG. Sinus rhythm, heart rate 58 b/min. Borderline abnormal P wave, broad in lead II, negative in lead V1, suggesting left atrial enlargement. QRS complex greatly increased in the left-sided leads (aVL = 29 mm, normal ≤ 11 mm; S wave in lead V2 = 8 mm, R wave in lead V5 = 41 mm, total 49 mm, normal = 35 mm), implying gross left ventricular hypertrophy (LVH). Left axis deviation (negative QRS in lead II, III, positive in lead I). Lateral leads show inverted T waves (I, aVL, V5/6), termed ‘left ventricular (LV) strain’/‘repolarization changes’. Gross inferior lead Q waves (leads III, aVF). This ECG could come from gross hypertensive heart disease or aortic valve disease, but the LVH changes are so gross as to strongly suggest HCM. The inferior lead Q waves might reflect an old inferior wall Q wave myocardial infarction (MI), but in the presence of such severe hypertrophy do not have to, and probably just reflect the LVH.

Cardiomyopathy is ‘heart muscle disease’, classified by ultrasound appearance and aetiology, though often first suspected from the ECG.
Hypertrophic cardiomyopathy
Stay updated, free articles. Join our Telegram channel

Full access? Get Clinical Tree


