6 Cardiac valves
VALVULAR STENOSES
Echocardiographic diagnosis of valvular stenoses, such as mitral stenosis (MS) or aortic stenosis (AS), is based on the study of:
PITFALLS WHEN STUDYING THE CONDITION OF THE STENOTIC VALVE
These echocardiographic pitfalls comprise:
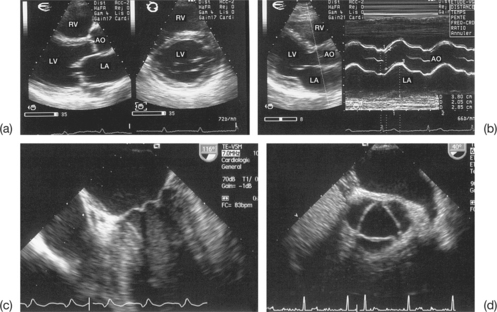
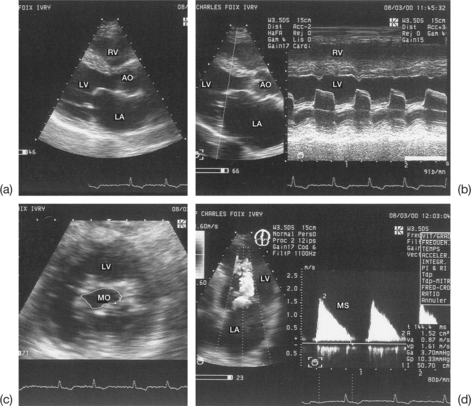
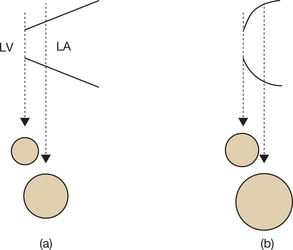
Incomplete visualization of the valves (Fig. 6.1)
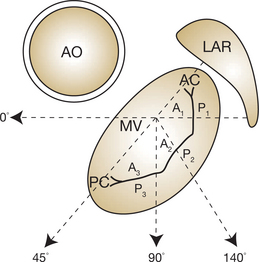
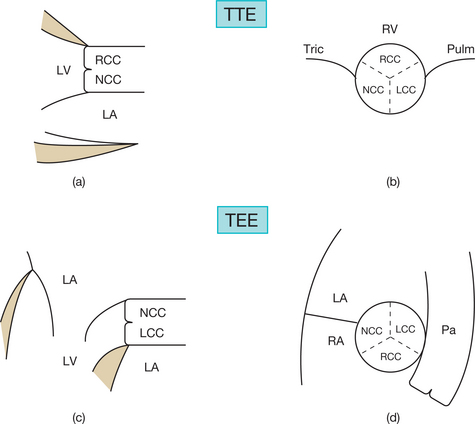
In order to assess correctly the condition of the stenotic valve, it is necessary to visualize:
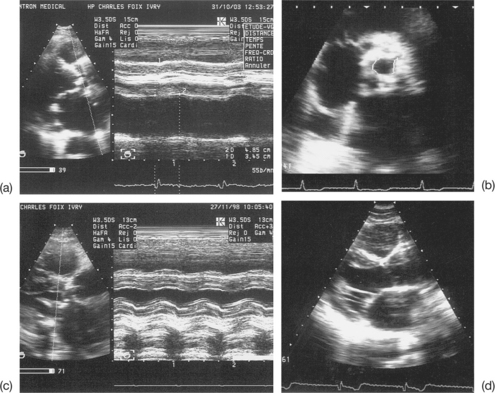
Imprecise evaluation of the degree of valvular and/or subvalvular remodelling (Fig. 6.4)
The differential diagnosis between calcifications and fibrous nodules is not always simple. Generally, calcifications are manifested as dense and bright echoes that persist after reducing the gain settings. They are definite in the presence of an adjacent shadow cone. However, they are nonetheless quite frequently overestimated in echocardiograms.
Particular cases
Failure to identify subvalvular mitral stenosis
This difficulty is due to the fusion and/or retraction of the chordae as well as fibrosis of the papillary muscles responsible for a subvalvular MS. In fact, the study of the subvalvular apparatus is more difficult than that of the valves, probably because subvalvular lesions are more complex and are often not easily picked up by transthoracic echocardiography (TTE). Identification of such lesions is much more precise in TEE.
PITFALLS WHEN STUDYING THE DEGREE OF VALVULAR STENOSIS
The echocardiographic measurements that enable the quantification of valvular stenosis are:
Each echo Doppler method has preferential indications and its own limitations. The elements that distinguish between the aortic surface area measured using echocardiography and that calculated using echo Doppler are summarized in Table 6.1.
Table 6.1 Parameters that differ between the aortic surface area measured using echocardiography and that calculated using Doppler
| Echocardiographic surface area | Doppler surface area | |
|---|---|---|
| Type of surface | Anatomical | Functional |
| Measurement mode | Planimetry | Continuity equation |
| Measurement site | Upstream of the vena contracta | At the level of the vena contracta |
| Relation to cardiac output | Independent of output | Dependent on output |
| Modification under Dobutamine | Fixed | Increased |
Pitfalls when measuring the trans-stenotic pressure gradient (Box 6.1)
Absence of mean pressure gradient measurement
The mean pressure gradient better reflects the severity of the valvular stenosis than does the maximuml gradient. The mean value represents the integration of the instantaneous gradient over the entire duration of the diastole (MS) or systole (AS). To calculate the mean gradient requires the maximum velocities in the central and proximal parts of the stenotic jet must be recorded. These measurements can be done using TEE, but TTE is generally adequate.
Incomplete recording of the stenotic jet when using continuous Doppler
Incomplete recording of the stenotic jet when using continuous Doppler can arise due to:
Failure to interpret the stenotic gradient according to the blood output through the stenotic orifice and the heart rate
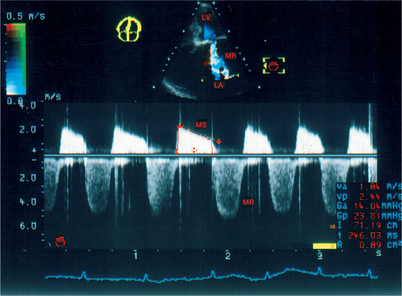
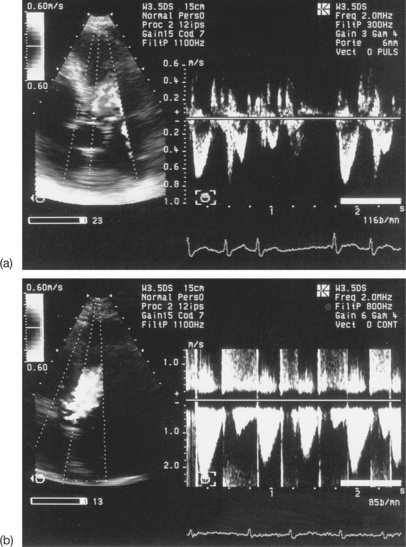
The severity of stenosis may be overestimated (increased gradient) due to a high cardiac output (anaemia, hyperthyroidism) or an associated valvular leak, or may be underestimated (reduced gradient) due to a low cardiac output linked to a systolic dysfunction of the left ventricle (LV). For example, a moderate mean gradient does not allow a tight valvular stenosis to be ruled out in a case of low cardiac output. Finally, for patients in atrial fibrillation, the averaging of several cycles is vital, taking into account the wide variability of the gradient according to the length of the cycles (Fig. 6.6).
Inappropriate use of the simplified Bernoulli equation in calculating the transvalvular gradient
The simplified Bernoulli equation (4V22) is only valid if the velocity upstream of the stenosis (V1) is insignificant compared with the velocity at the level of the stenosis (V2). Otherwise (e.g. when the subaortic velocity is above 1.5 m/s) the use of the simplified equation leads to an overestimation of the gradient. The ‘complete’ Bernoulli formula 4(V22 – V12) should be used in this case.
Pitfalls when maesuring the surface area of the stenotic orifice
Pitfalls when using planimetry (Box 6.2)
Planimetry of the stenotic aortic orifice
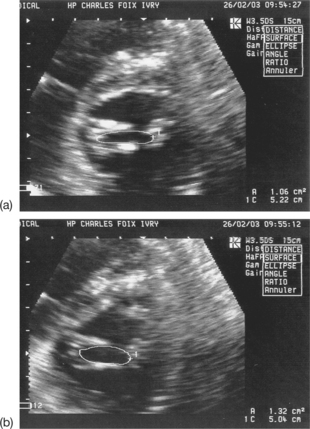
Planimetry of the aortic orifice using two-dimensional (2D) TTE and the fundamental imaging method is practically impossible (small, irregular, ill-defined orifice, hyperechoic valves). Harmonic imaging can be useful in better identifying the limits of the orifice (see Fig. 6.4(b)). Multiplanar TEE can be used to measure the aortic orifice by planimetry with good reliability. However, this method should be reserved for cases where the continuity equation cannot be used or where there is a discrepancy between the results obtained with different quantification methods.
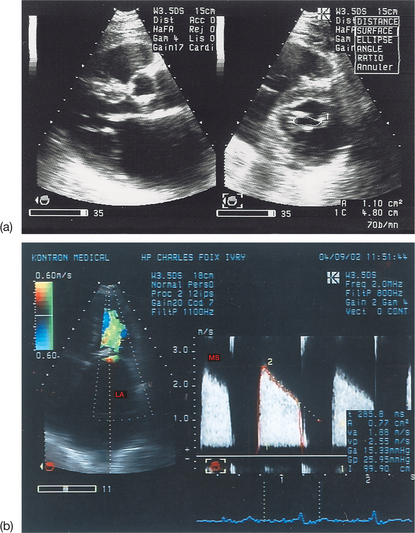
Planimetry of the stenotic mitral orifice
Pitfalls when using Hatle’s method
This method may be used with TTE or TEE, but the transthoracic approach is generally sufficient.
Hatle’s method is useful because it gives information about both valvular obstructions (commissural fusion) and subvalvular obstructions (lesions of the subvalvular apparatus), whereas planimetry gives information only about valvular obstructions. When the PHT is carefully measured, the reliability of Hatle’s method is excellent. Nevertheless, this method is not without several pitfalls (Box 6.3), which are described below.
Box 6.3 Pitfalls when using Hatle’s method to measure the mitral surface area
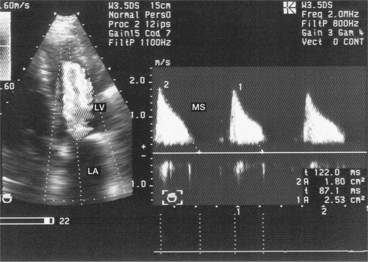
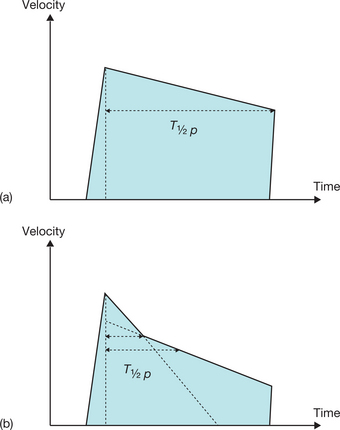
Non-linear decrease in velocity in mitral stenosis
This is a particular morphology of the Doppler curve: a biphasic slope with a steep, brief initial period, followed by a slower phase (Fig. 6.12). Given this ambiguity regarding which slope should be used, it is recommended that the PHT measurement is made using the second slope (Fig. 6.13). However, in the majority of patients, the deceleration slope is a straight line.
Flutters
Flutters may present pitfalls when using Hatle’s method:
Associated haemodynamic conditions
In practice
Planimetry is the preferred method in cases where there is satisfactory imaging, and Hatle’s method is preferred in cases of a severely calcified mitral orifice, subvalvular stenosis or poor quality imaging. When there is a discrepancy between the results obtained using mitral planimetry and Hatle’s method, it is necessary to resort to a third method (continuity equation). Finally, colour Doppler has a secondary role in assessing the tightness of the MS. It helps to position the Doppler beam in the central laminar part of the stenotic jet (the central core of the stenosis). Finally, Hatle’s method is no longer considered valid for native mitral valves.
Pitfalls when using the continuity equation (Box 6.4)
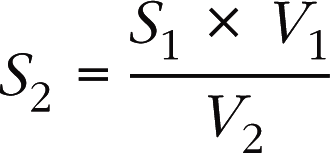
The continuity equation uses the principle of conservation of mass, with the formula:
Box 6.4 Pitfalls of the continuity equation when measuring the aortic surface area
Doppler TTE makes it possible to calculate the functional surface area of the stenotic orifice (mitral or aortic), which is equal to the output in the left ventricular outflow chamber divided by the velocity–time integral (VTI) of the trans-stenotic flow:
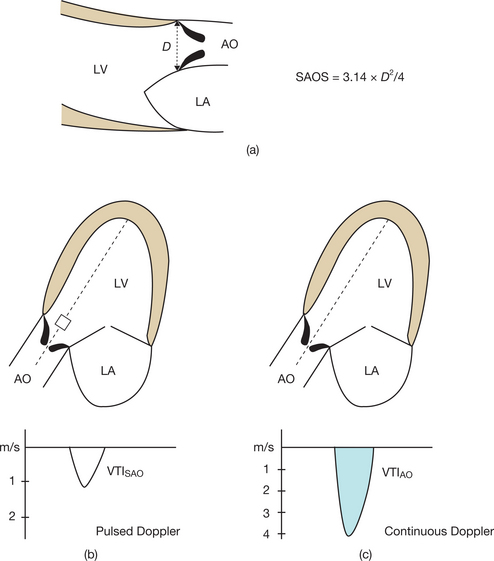
The following measurements are involved (Fig. 6.14):
Pitfalls when measuring the subaortic diameter
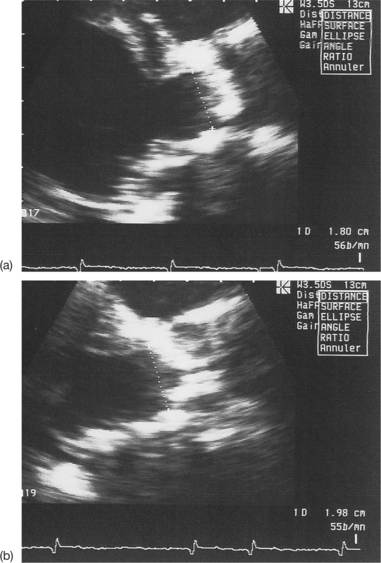
Poor visibility of the points of insertion of the aortic cusps
This problem is most often due either to insufficient patient echogenicity, or to valvular or annular calcifications masking the insertion of the semilunar cusps (Fig. 6.15).
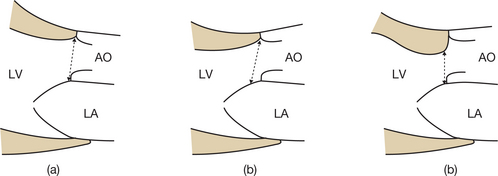
Imprecise measurement of the subaortic diameter
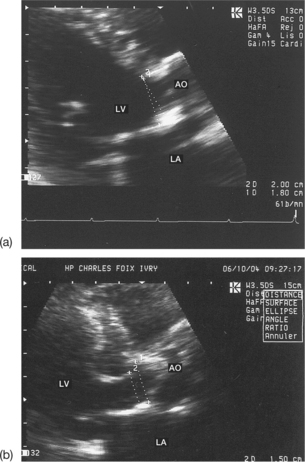
Normally, this measurement should be carried out between the two points of insertion of the aortic cusps and in parallel with the plane of the valve. Care must be taken to measure the subaortic diameter with the greatest possible precision, since, if a mistake is made, the squaring of the diameter will modify the calculated valve surface area by the same amount. The following situations may be responsible for errors in measuring the subaortic diameter (Figs 6.16 and 6.17):
In practice, the measurement of the left ventricular outflow chamber diameter should be repeated at least three times and the mean value calculated; any extreme, non-reproducible values should be eliminated.
Values of D calculated using this formula are relatively reliable. However, use of the fixed value of 2 cm for the subaortic diameter should be avoided, as this is a major source of errors. An incorrectly enlarged subaortic diameter will lead to an overestimation of the valve surface area (mitral or aortic) calculated using the continuity equation (Box 6.5). Conversely, a value for the subaortic diameter that is falsely too low will lead to an underestimation of the valve surface area.
Finally, in cases of AS where the measurement of the subaortic diameter is not possible via the transthoracic route, it is possible to quantify the stenosis using the permeability index. This may be done using the VTI ratio: subaortic VTI/transaortic VTI. This easily calculated parameter is independent of the cardiac output and its sensitivity is satisfactory, but its specificity remains poor. In fact, a ratio of £ 0.25 identifies an aortic surface area of £ 0.75 cm2 with a sensitivity of 92% and a specificity of 68%.
Pitfalls when recording subaortic flows
Normally, these flows should be recorded using pulsed Doppler across the apical cross-section passing through the aortic root. It is important to be aware of the potential pitfalls of this technique (see Box 6.4).
Incorrect positioning of the Doppler sample volume in the left ventricular outflow chamber
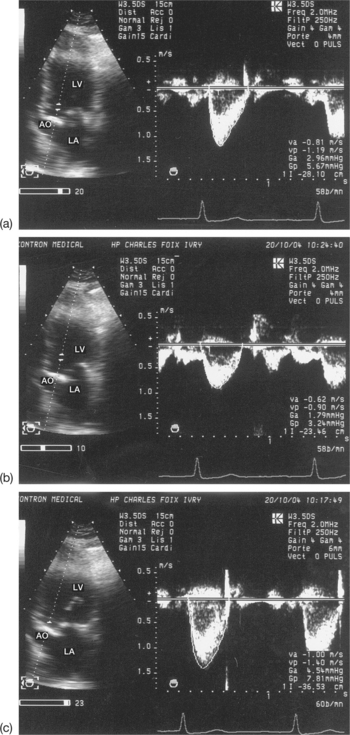
In practice, the small Doppler sample volume (4–6 mm) should be positioned in the middle of the left ventricular outflow chamber, approximately 5 mm upstream of the aortic cusps, a position that corresponds fairly well with the level used for measuring the subaortic diameter in the parasternal view. Colour Doppler may make it easier to locate the site of collection of the subaortic flow. This site usually corresponds to the small first aliasing zone (passage from blue to red) in the absence of low output. By modifying slightly the position of the Doppler sample volume in the outflow chamber, it is possible to optimize the collection of subaortic velocities. This process enables the operator to record subaortic flows integrally within the exclusively laminar zone, at the level of the vena contracta.
An underestimation of the subaortic velocities is due to the Doppler sample volume being too distant from the aortic valve. This leads to an underestimation of the valve surface area calculated using the continuity equation. Bringing the Doppler sample volume too close to the aortic orifice leads to a sharp enlargement of the spectrum linked to the entry into the acceleration zone of the ejection flow. This in turn leads to an overestimation of the subaortic velocities, and therefore to an erroneous increase in the valve surface area calculated using the continuity equation (Fig. 6.18).
Poor quality of the subaortic spectrum recorded using pulsed Doppler
The poor quality of the subaortic spectrum recorded using pulsed Doppler renders the subaortic VTI measurement using planimetry imprecise. It is important to obtain a clear spectral envelope of the subaortic flows, with well-defined and homogenous contours, and without echoes within the spectrum. The presence of the aortic closing click is not a required condition for recording; this click is often muffled in the case of a tight AS. Finally, the measurement of the subaortic VTI should be done over at least three cycles and the mean value calculated.
Associated pathologies
Associated pathologies that render the recording of subaortic flows less reliable are:
Pitfalls when recording the stenotic flow
The transvalvular stenotic flow (mitral or aortic) is recorded using continuous Doppler. It is important to understand the pitfalls of this type of recording in order to avoid incorrect results (see Box 6.4).
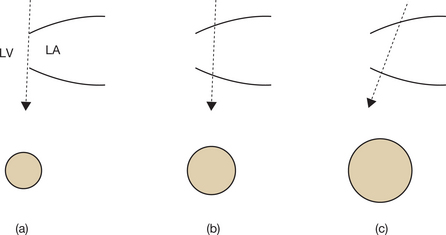
Poor alignment of the Doppler beam with the stenotic flow
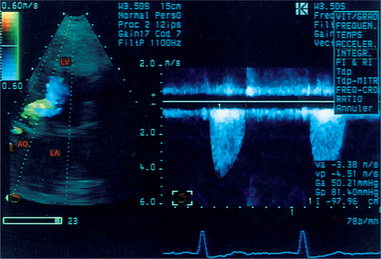
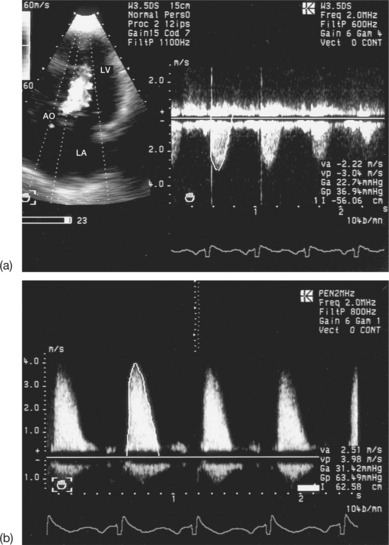
Poor alignment of the Doppler beam with the stenotic flow leads to an incomplete recording of the stenotic jet and a ‘hoarse’ and vibrant Doppler sound. It is therefore necessary to increase the number of echocardiographic views, especially when exploring AS. When done with care, it is possible to achieve correct alignment and to capture the maximum velocity of the stenosis. The pure and sharp acoustic signal indicates proper alignment. Prior localization of the stenotic flow using colour Doppler, wherein it is seen in the form of a mosaic, enables precise adjustment of the Doppler beam angle (Fig. 6.20).
Failure to use the 2 MHz, Pedoff-type, continuous, stand-alone Doppler probe (pen-shaped probe) without 2D imaging (‘blind’)
The great ease of manipulating of this probe allows for optimal alignment of the beam with the central jet of the stenosis. Poor alignment (above 20°) leads to a clear underestimation of the transvalvular VTI (Fig. 6.21), which leads to an overestimation of the valve surface area as calculated using the continuity equation (see Box 6.5).
Failure to average the transvalvular velocity–time integral measurements
As with subaortic flows, it is recommended that at least three cardiac cycles in sinus rhythm are recorded, avoiding post-extrasystolic complexes, and the mean VTI value calculated. In the case of atrial fibrillation, VTI values from a minimum of five cycles should be averaged, due to the variability in the VTI of the stenotic flow during continuous arrhythmia (see Fig. 6.19).
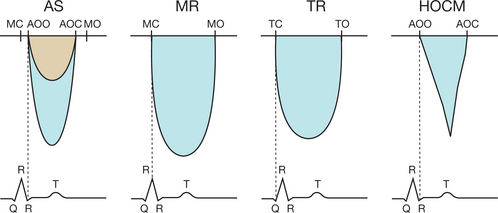
Confusion between the flow in aortic stenosis and the flow in mitral regurgitation when using the Pedoff probe (Fig. 6.22)
Successive recording of one flow after another makes it possible to differentiate easily between the AS and MR flows. Other elements may help to identify the aortic ejection flow, which:
Confusion between the flow in aortic stenosis and the flow in tricuspid regurgitation when using the Pedoff probe (see Fig. 6.22)
Confusion between the flow in aortic stenosis and the flow in left ventricular dynamic obstruction
In order to differentiate between these flows, the operator must make use of echocardiographic imaging and continuous Doppler. The obstructive subaortic flow shows an acceleration crescendo during the systole, which has a characteristic sabre-shaped appearance (see Fig. 6.22). However, in cases of subvalvular obstruction associated with AS, the continuity equation is invalid, as the upstream velocity is no longer insignificant. The only usable method in this situation is planimetry of the aortic orifice.

