7 Cardiac walls
The echocardiographic pitfalls relating to imaging of the cardiac walls are concerned with the diagnosis of:
PITFALLS WHEN DIAGNOSING WALL HYPERTROPHY
Pitfalls in measuring the wall thicknesses
M-mode measurements of the LV are vital in the diagnosis of left ventricular wall hypertrophy. The interpretation of the measured values (end-diastolic thickness of the septum and of the posterior wall of the LV) is only reliable if the strict quality criteria for M-mode recording are applied (Box 7.1). Conventionally, the M-mode examination is guided by the two-dimensional (2D) mode and begins in the left parasternal window. This makes it possible to obtain M-mode measurements of the base of the longitudinal cross-section. Other echocardiographic projections may be used (the short-axis parasternal view at the level of the papillary muscles below the mitral valve, or the subcostal view) if the parasternal long-axis view is not usable.
Box 7.1 Conditions for the echocardiographic measurement of left ventricular wall thicknesses
The causes of errors in the measurement of wall thicknesses are summarized in Box 7.2.
Box 7.2 Causes of error in the M-mode measurement of wall thicknesses
Imprecise detection of end-diastole
The detection of end-diastole affects the measurement of the wall thicknesses. End-diastole is identified according to the convention applied, whether this be the start of the Q wave of the QRS complex, or the peak of the R wave (Figs 7.1 and 7.2). Thus it is necessary to record the electrocardiogram (ECG) in parallel with the echocardiogram. This cannot be used when there is left bundle branch block.
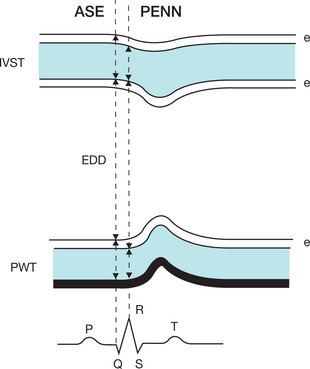
Figure 7.1 Two M-mode echocardiographic techniques for measuring the interventricular septal thickness (IVST), the ventricular end-diastolic diameter (EDD) and the posterior wall thickness (PWT) in end-diastole according to (Box 7.3):
Oblique M-mode angle in relation to the ventricular walls
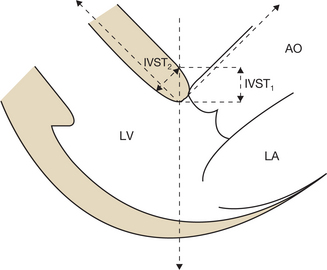
If the M-mode angle is oblique in relation to the ventricular walls, the wall thicknesses will be overestimated (Fig. 7.3).
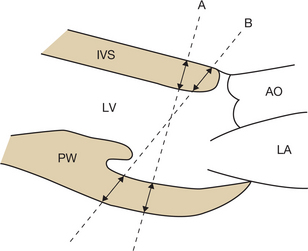
Normally, the M-mode line should be positioned perpendicular to the major or minor left ventricular axis and just below the free edge of the mitral valve. In practice, however, obtaining orthogonal cross-sections is sometimes difficult. In certain cases, this may be achieved by:
A new M-mode technique, called ‘anatomical M-mode’, is particularly useful in the case of oblique ventricular M-mode projections. It allows the overestimated M-mode measurements of the LV to be corrected (Fig. 7.4).

Inclusion of the tricuspid apparatus, mitral chordae or false septal tendon in the measurement of the wall thicknesses (Fig. 7.5)
When measuring the septum, care must be taken to distinguish between the tricuspid subvalvular apparatus and the anterior septal endocardial border. Between these two structures there is normally a clear, echo-free space. Likewise, the inclusion of the mitral chordae may lead to incorrect positioning of the measuring cursor when detecting the anterior border of the posterior wall of the LV. However, the M-mode slope of the posterior wall is greater than that of the chordae.
The presence of a false septal tendon may be responsible for an overestimation of the septal thickness. A false tendon, which is composed of muscular tissue, is transformed in 2D echocardiography into a linear structure attached to the left surface of the septum in the form of a bridge. It should be identified by careful echocardiographic examination of the septum in order to exclude it from the M-mode measurement of the septal thickness. In order to eliminate these anatomical sources of error, it is imperative to use multiple echocardiographic projections (lower left parasternal, minor axis, apical, subcostal) in order to obtain a clear, measurable and interpretable M-mode trace.
Presence of a subaortic septal rim or a muscular band
The subaortic septal rim is defined as a hypertrophy located exclusively on the basal part of the interventricular septum, the diastolic thickness of which is > 13 mm. This rim is identifiable in the 2D parasternal, long-axis or apical cross-section (the two left chambers and the aorta). The rim may lead to an overestimation of the septal thickness because of the use of an inappropriate M-mode projection. In order to avoid this pitfall, the M-mode line should be positioned below the septal rim (Figs 7.6 and 7.7). Use of the subcostal projection is sometimes preferred. A subaortic septal rim should be distinguished from a septal hypertrophy arising from hypertrophic obstructive cardiomyopathy (HOCM), which is an echocardiographic diagnostic pitfall to beware of (see Table 7.4).
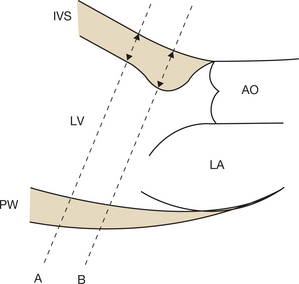
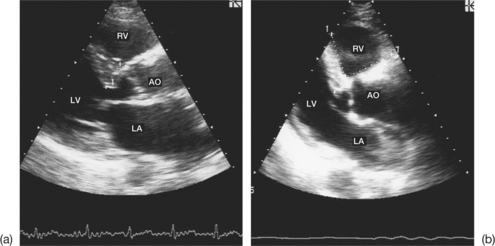
Table 7.4 Differential diagnosis between the subaortic septal rim and hypertrophic obstructive cardiomyopathy (HOCM)
| Parameter | Septal rim | HOCM |
|---|---|---|
| Clinical context | Older, often hypertensive subject | Younger subject, familial primary HOCM |
| Septal hypertrophy | Located on the basal septum | More diffuse, surrounding the middle segment of the septum |
| Diastolic septal thickness | 13–20 mm | Often > 20 mm |
| Septal echostructure | Normal | Hyperechoic, dense appearance |
| Septal motion | Normal | Hypokinetic |
| Left ventricle | Normal size | Small, deformed |
| Dynamic obstruction | Rare (around 18% of cases) | Frequent (> 50% of cases) |
| Diastolic function | Conserved | Altered |
Presence of septal kinking (angulation)
Septal kinking is a particular morphology of the septum that is identifiable in the parasternal, long-axis cross-section (see Fig. 7.7). Normally, the angulation of the septum in relation to the axis of the aorta falls between 140° and 125°. In the case of septal kinking (aortoseptal angle £ 90°), a poorly directed ultrasound beam approaches the septum obliquely, giving an appearance of false septal hypertrophy (Fig. 7.8).
Thus it is often the case that the probe has to be repositioned in order to avoid the septal kinking that may lead to overestimation of the thickness of the septum. As far as possible, the M-mode line should be perpendicular to the septum and the posterior wall. In certain cases, the presence of septal kinking can invalidate the measurements.
Pitfalls when calculating the left ventricular mass
LVH translates anatomically into an increase in the left ventricular mass (LVM). The LVM may be calculated using echocardiography:
Box 7.3 The ASE and PENN formulae for calculating the left ventricular mass (LVM) based on the M-mode measurement of the diameter of the left ventricle (EDD), the interventricular septal thickness (IVST) and the posterior wall thickness (PWT) at end-diastole (see Fig. 7.1)
American Society of Echocardiography (ASE) formula:
LVM = 0.8[1.04 × (EDD + IVST + PWT)3 – EDD3] + 0.6
Pennsylvania (PENN)/Devereux formula:
Two formulae are commonly used to calculate the LVH in M-mode echocardiography: the ASE formula and the PENN/Devereux formula (see Box 7.3). These formulae are based on the common hypothesis of a LV that is geometrically a rotational ellipsoid truncated at one of its poles, and the major axis of which is double the length of the minor axis. In order to calculate the LVM, mathematical formulae based on the principle of cubes are used. It is nonetheless vital to match the chosen formula with the corresponding measurement convention being used.
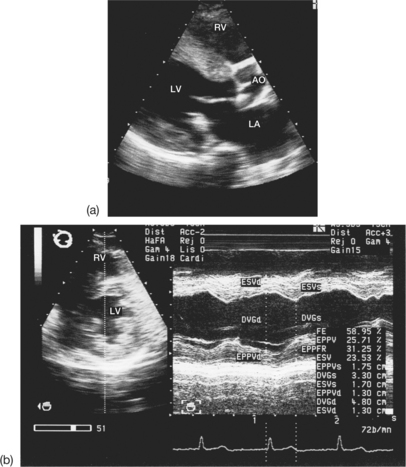
In order to be reliable, the measurement of the M-mode parameters (thicknesses and diameter) used in calculating the mass must be rigorous and precise (see Fig. 7.2). However, echocardiographic measurement of the LVM may run into technical and methodological difficulties, and the examiner should be familiar with these in order to make an informed view of the final result (Box 7.4).
Box 7.4 Principal limitations in the calculation of the left ventricular mass using M-mode echocardiography
The pitfalls involved in calculating the LVM using M-mode echocardiography are described below.
Incorrect calculation of the myocardial mass
When the examination conditions are difficult, or in certain pathological situations, the elliptical model of the LV becomes inapplicable (see Box 7.4). The technical difficulties associated with obtaining a high-quality M-mode trace in patients who have a low echogenicity constitute an overwhelming limitation on the precise measurement of the wall thicknesses.
Failure to respect the conditions of M-mode measurements (see Box 7.1)
In short, an echocardiographic methodology that is not rigorous gives rise to an unreliable result.
Variability of threshold values used for the diagnosis of left ventricular hypertrophy
The parameters that significantly modify the LVM are the gender and the body habitus of the patient. As a matter of routine, the LVM is corrected according to the patient’s body surface area, with an average threshold of 134 g/m2 for men and 110 g/m2 for women usually being applied. However, the threshold values proposed in the literature are somewhat variable: 110–134 g/m2 for men and 100–125 g/m2 for women.
Uncertainty over the choice of the threshold value has major consequences for the final diagnosis of LVH. By applying low thresholds, the overall prevalence of LVH is increased considerably. Therefore the choice of the thresholds for defining LVH has a significant influence on the estimated value of this prevalence. In contrast, an underestimation of LVH is observed in obese patients when relating the LVM to the body surface area. For this reason, indexing the LVM by patient size, preferably raised to the power of 2.7, has been proposed. In a normal subject, this index of the LVM should be lower than 50 g/m2.7 in men and 47 g/m2.7 in women. Generally, the thresholds determining the LVH are lower in women (Table 7.1).
Table 7.1 Normal values of the left ventricular mass (LVM) indexed according to the body surface area and size of the patient
| Indexed LVM | Men | Women |
|---|---|---|
| To body surface area (g/m2) | < 134 | < 110 |
| To size (g/m2.7) | < 50 | < 47 |

This echocardiographic parameter, interpreted according to the corrected LVM, makes it possible to specify the concentric or eccentric character of the LVH, which is often a source of confusion (Table 7.2 and Fig. 7.9). In fact, even if the LVM is normal, an RWT of > 0.45 makes it possible to identify concentric remodelling of the LV. The advantage of a morphological analysis of the geometry of the LV lies in its prognostic implications (stratification of the cardiovascular risk in hypertensive patients).
Table 7.2 Three morphological types of abnormal left ventricular geometry
| Abnormal geometry | Left ventricular mass (LVM) | Relative wall thickness (RWT) |
|---|---|---|
| Concentric remodelling | Normal | > 0.45 |
| Eccentric LVH | Increased (↑) | < 0.45 |
| Concentric LVH | Increased (↑↑) | > 0.45 |
LVH, left ventricular hypertrophy.
DISTINCTION BETWEEN PHYSIOLOGICAL AND PATHOLOGICAL LEFT VENTRICULAR HYPERTROPHY
The regular practice of a sustained sporting activity is accompanied by morphological modifications of the LV, in particular an increase in the wall thicknesses. It is sometimes difficult to trace the exact border between ‘physiological’ hypertrophy linked to sport and pathological hypertrophy. The echocardiographic data that make it possible to distinguish between these two types of LVH are summarized in Table 7.3, where measurements of the heart of an athlete are compared with measurements found in hypertrophic cardiomyopathy (HCM). The application of DTI is very useful in this differential diagnosis.
Table 7.3 Differential diagnosis between physiological hypertrophy (athlete’s heart) and pathological hypertrophy (hypertrophic cardiomyopathy (HCM))
| Parameter | Athlete’s heart | HCM |
|---|---|---|
| Wall thickness | < 13 mm (13–15 mm in 5% of cases) | ≥ 13 mm |
| IVST/PWT | < 1.3 | > 1.3 |
| RWT | Variable | > 0.45 |
| Left ventricular mass | Increased (↑) | Increased (↑↑) |
| EDD of the LV | ≥ 55 mm (> 60 mm in 14% of cases) | < 50 mm |
| LV systolic function | Normal | Normal |
| Left ventricular diastolic function | ||
| Mitral flow | E/A > 1 DT > 150 ms IVRT ≥ 90 ms | E/A < 1 or > 1 DT > 220 ms, IVRT > 90 ms |
| PV (colour M-mode) | > 45 cm/s | < 45 cm/s |
| Ea (annular DTI) | > 8 cm/s | < 8 cm/s |
| Filling pressure | Normal | Normal or increased |
| Myocardial DTI | ||
| Myocardial velocities | Normal | Reduced |
| Transparietal gradient | Normal | Increased |
| Intra-LV dynamic obstruction | Absent | Often present |
| Mitral regurgitation | Absent or small | Moderate |
| Pulmonary arterial pressures | Normal | Normal or increased |
| Evolution | Regression of the hypertrophy with loss of fitness | Persistence of hypertrophy |
DT, deceleration time; DTI, Doppler tissue imaging; Ea, velocity of the E wave in DTI applied to the mitral annulus; E/A, ratio of the E and A waves of the mitral flow; IVRT, isovolumic relaxation time; IVST/PWT, ratio of the septal diastolic thicknesses to the posterior wall thickness; LV, left ventricle; PV, propagation velocity of the mitral flow in colour M-mode; RWT, relative wall thickness; EDD, end-diastolic diameter of the LV.
PITFALLS WHEN DIAGNOSING PRIMARY HYPERTROPHIC CARDIOMYOPATHY
Hypertrophic cardiomyopathy (HCM) is the most frequently occurring of the monogenic hereditary cardiopathies. Typically it is characterized by a disproportionate hypertrophy of the LV with or without dynamic outflow back obstruction. Doppler echocardiography is considered to be the diagnostic method of choice for HCM, but the results are is sometimes difficult to interpret, and all the more so if the condition is highly heterogeneous.
The diagnostic difficulties and potential pitfalls when using the Doppler technique relate to:
Stay updated, free articles. Join our Telegram channel

Full access? Get Clinical Tree


