Fig. 32.1
Image illustrating fluoroscopy’s poor soft tissue contrast
32.3 Recent Developments
In an effort to overcome the limitations associated with conventional EP mapping techniques, considerable advances have been made with both invasive and noninvasive imaging of cardiac electrical activity. More specifically, several high-resolution mapping technologies have been developed that can function in a complementary role to conventional mapping techniques, or they can be used independently. Moreover, it is now possible to integrate these techniques with imaging modalities such as magnetic resonance imaging, computed tomography, and real-time 3D ultrasound. These techniques can broadly be categorized into two primary technologies, each possessing unique advantages and disadvantages: sequential mapping and continuous mapping.
There are two distinct technologies that primarily comprise the first category (sequential mapping systems ) including electroanatomical mapping systems such as the CARTO3® System (Biosense Webster, Diamond Bar, CA, USA), the EnSite Velocity™ System (St. Jude Medical, St. Paul, MN, USA), and the LocaLisa® system (Medtronic, Inc., Minneapolis, MN, USA). Common to each system is the capability to collect 3D locations as well as their respective electrogram recordings in the target cardiac chamber, to create an accurate picture of the heart’s electrical sequence. A third mapping system that is ultrasound-based (Real-Time Position Management System, Boston Scientific Corporation, Natick, MA, USA) was previously marketed but is not readily available, and will therefore not be described in this review.
Continuous mapping systems represent the second major mapping technology category, and typically consist of either basket or noncontact catheter mapping (NCM) . Such systems allow for the recording of global data so that the rhythm can be characterized with a minimal number of cardiac beats. In general, basket catheter mapping technologies necessitate electrode contact with the chamber’s walls in order to obtain sufficiently accurate reconstructed electrograms, whereas NCM simply needs to be placed in the blood pool of the chamber of interest. Yet, both methodologies overcome some of the limitations of fluoroscopy by allowing for the creation of accurate 3D intracardiac maps, hence providing new and unique insights on the specific diagnosis and treatment of complex arrhythmias. Examples of this technology category include the EnSite™ Array™ noncontact mapping catheter and system (St. Jude Medical) and the Rhythmia mapping system (Boston Scientific Corporation).
Recently, exciting advancements have been made in the field of noninvasive imaging such that cardiac electrical activities are spatially represented over the 3D space of the heart. He and coworkers have pioneered the development of 3D cardiac electrical activity from bioelectric recordings [17–19]. The goal of such cardiac electrical imaging, also known as the inverse problem of electrocardiography , is to noninvasively image and visualize the electrical activity of the heart from BSPMs. Due to the high temporal resolution inherent in these bioelectric measurements, the availability of bioelectric source imaging modalities provides much needed high temporal resolution in mapping functional status of the heart and, in turn, aids clinical diagnosis and treatment. In a series of studies, He and colleagues have developed data-driven 3D cardiac electrical imaging techniques that are based upon the fundamental biophysics of cardiac activation, to image activation sequences throughout the heart [20]; they further validated such an imaging approach in animal models using intracardiac mapping [21–24]. These rigorously conducted experiments demonstrate the ability to map transmural cardiac activation throughout the entire heart from noninvasive BSPMs. CardioInsight, Inc. has developed a revolutionary noninvasive electrocardiographic mapping platform (ECVUE™ , Cleveland, OH, USA) that gathers information about the heart using a proprietary, multi-sensor electrode “vest” placed upon the patient’s body. The system combines this electrical information with images from the patient’s CT scan, to provide 3D maps of the electrical activity of the heart. Unlike conventional catheter-based mapping methods, the ECVUE system is noninvasive and provides a view of the entire heart’s electrical activity during a single beat.
32.3.1 Sequential Mapping Systems
32.3.1.1 Electroanatomical Mapping Technologies
Principally, electroanatomical mapping (EAM) refers to the integration of spatial data and temporal electrical data collected by catheters in contact with either the endocardial or epicardial surfaces of the heart. One such technology utilizes ultra-low magnetic field technology in order to localize the relative positions of mapping catheters in space and then to reconstruct 3D maps and activation sequences of the chamber of interest [25–27]. In short, the CARTO3® system uses one reference catheter (RefStar™), one mapping catheter (NaviStar™), and a pad that transmits three ultra-low magnetic fields (Fig. 32.2). Further, the amplifiers for the system are separate pieces of equipment that extract the information from the catheters and location pad, and then these data are sent to the workstation.
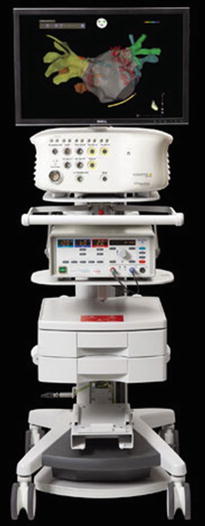

Fig. 32.2
CARTO® sequential mapping system (Biosense Webster, Inc.). Image from www.biosensewebster.com
More specifically, three ultra-low magnetic fields are generated by coils in the locator pad positioned under the patient’s bed. These ultra-low fields are detected by sensors in the distal tips of the mapping catheters, which are then positioned into the heart chamber(s) to be mapped under fluoroscopic guidance. Information within the magnetic fields such as amplitude, frequency, and phase of the field is subsequently used to determine the instantaneous spatial 3D position (x, y, and z axes) and temporal characteristics (pitch, yaw, and roll) of the catheter’s distal tip location within a chamber. Catheters are then strategically placed at major anatomical landmarks (i.e., superior and inferior vena cava, tricuspid valve annulus, coronary sinus ostium, crista terminalis, and His bundle for a right atrium map) to serve as reference points for the subsequently derived electroanatomic map. Recordings of the 3D locations of the catheter tips (via a triangulation calculation) and correlating local electrical information from a multitude of points within the chamber are then sequentially recorded and used to reconstruct a 3D representation of the chamber.
After completion of the 3D reconstruction of the chamber’s endocardial geometry, the timing of unipolar and bipolar electrogram signals, related to the fiducial point of the reference electrogram, allows for collection and display of activation times on the map in relation to the location of the catheter in the heart. To create the activation map, reconstructed locations on the map are typically color-coded, with red and purple representing the regions of earliest and latest electrical activation, respectively, and yellow and green showing the intermediate activated areas. Local activation times are then represented on a normal color scale sequence, where red is the earliest signal and purple is the latest recorded signal in reference to the chosen fiducial point. As a result, the sequential recording of different points by dragging the catheter along the endocardial walls of the chamber provides real-time, color-coded 3D activation maps.
A relative voltage map displaying the peak-to-peak amplitude of the electrogram sampled at each site may also be produced and superimposed on the reconstructed chamber. Using custom software, all maps can be shown in single or multiple views concurrently, with the capability to be rotated in virtually any direction. As described, a second catheter equipped with a sensor in its distal tip is also positioned in the chamber of interest, and is used to identify small changes in the mapping catheter’s relative position that may have been caused by respiration and/or patient movement. Movement of the patient relative to the coils is continuously monitored by the system and the operator is notified to the need for repositioning, if the system detects relative motions beyond a set threshold. The most recent version (CARTO-3) allows the position of non-proprietary diagnostic catheters to be displayed on the system. For each specific magnetic location in space, the CARTO-3 system® registers the corresponding electrical current pattern emitted by the magnetic sensor-equipped mapping catheter. The position of conventional catheters can then be determined based on the detection of the current pattern emitted from each intracardiac electrode on the diagnostic catheter. However, it is still not possible to process electrical information from these catheters for display on the virtual geometry.
Such EAM has experienced relatively widespread clinical use, and has also been utilized for the study of a variety of cardiac arrhythmias including: atrial fibrillation [28], atrial flutter [29–32], ventricular tachycardia [33, 34], and atrial tachycardia [35, 36]. One of the primary reasons for the success of this method lies in its capability to return an ablation catheter to any endocardial location on a previous map of the chamber without relying on fluoroscopy, i.e., with in vivo validation studies demonstrating that the location of the catheter can be determined with a high degree of accuracy using the system with mean distance error <1 mm. In most cases, the ablation catheter and mapping catheter are one and the same. This enables potential ablation target sites to be analyzed and treated in a single procedure, and provides the ability to precisely register the location of individual and/or linear lesions.
The reconstruction process using such a system can be generated in real time; however, due to the fact that this approach must sequentially acquire points, the process can be somewhat time-consuming [36, 37]; timing is governed by the number of points collected. Nevertheless, in practical use, the amount of the time required to reconstruct a chamber’s geometry relies on the comfort level of the physician manipulating the catheter and the knowledge of the individual participating at the workstation. It should be noted that other potential limitations associated with EAM include the inability to simultaneously acquire maps of different heart rhythms [37], as well as the potential for inaccurate mapping due to movement of the patient and/or catheter. As a direct result, an unstable rhythm may prove too complicated to delineate and, therefore, may not be a primary indication for this technology.
32.3.1.2 LocaLisa® Technologies
Although no longer commercially available, the first technology developed for real-time 3D localization of intracardiac catheter electrodes within the chambers of the heart worked on the principle that when an electrical current is externally applied through the thorax, a voltage drop occurs across the internal organs, including the heart. This particular voltage drop can then be recorded via standard catheter electrodes and subsequently used to determine electrode positions within a given 3D space.
Using similar physical properties, the LocaLisa® system (Fig. 32.3) delivers an external electrical field that is detected via standard catheter electrodes. This is achieved by sensing impedance changes between the catheter and reference points. Analogous to the Frank lead system, the electric field is applied in three orthogonal directions (x, y, and z) with different frequencies (~30 kHz) via three applied skin electrode pairs. This system then records the voltage potentials detected by the catheter’s electrodes within the three electric fields, thus allowing for a defined coordinate system to be created.
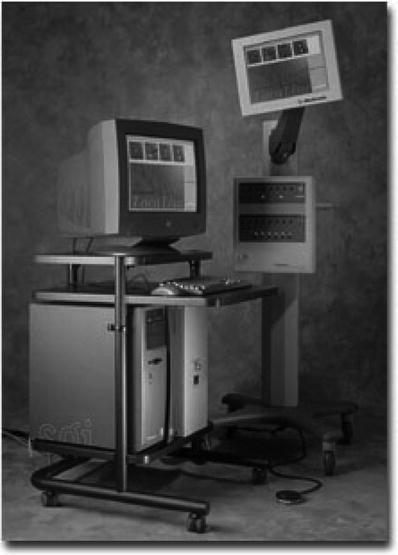

Fig. 32.3
The LocaLisa® mapping system (Medtronic, Inc.). Image courtesy of Medtronic, Inc.
These voltage potentials are next translated into a measure of distance relative to a fixed reference catheter, giving the user a 3D representation of the catheter location within the heart’s chamber. Important catheter locations are subsequently recorded and represented as color-coded spots on a 3D grid, a process that requires a skilled operator’s interpretation (Fig. 32.4). Individual catheter locations can be saved, annotated, and revisited later in the procedure.
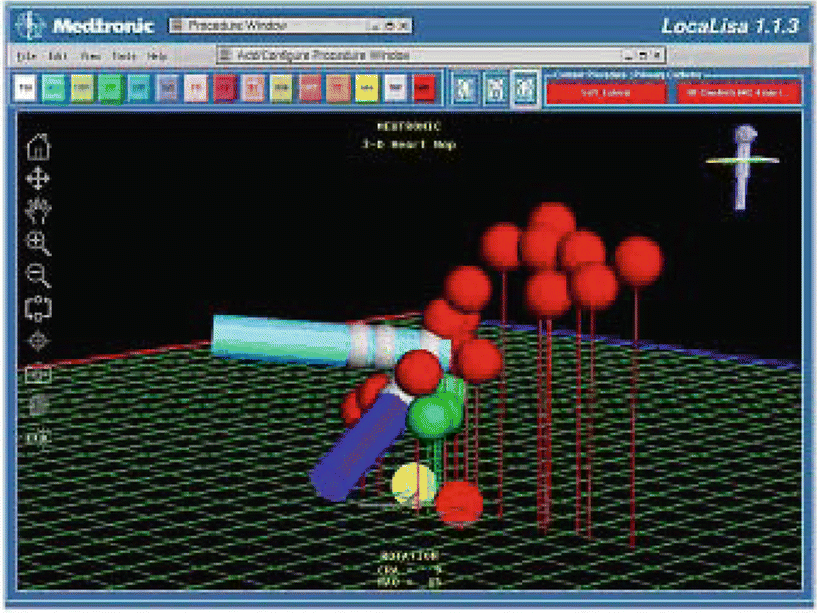

Fig. 32.4
Screen shot of LocaLisa®’s mapping software (Medtronic, Inc.). Image courtesy of Medtronic, Inc.
Due to the fact that the system displays real-time electrode movements, catheter movements due to cardiac and respiratory cycles are similar to those observed with fluoroscopy. In initial human validation studies, the LocaLisa® system was described to provide clinically feasible and accurate catheter locations within the heart [38]. Developers of the system reported successful use in over 250 complex ablation procedures for both ventricular and supraventricular tachyarrhythmias. The novel capabilities of this system included: (1) its ability to use any general catheter to collect data; (2) relative improvements in the visualization of catheters in 3D space; and (3) a broad clinical applicability. Finally, this methodology could be applied with complex catheter designs such as multielectrode catheters, irrigated electrode catheters, and/or basket catheters [39–41].
32.3.2 Continuous Mapping Systems
32.3.2.1 Basket Catheter Mapping Technologies
In general, the limited mapping resolution of conventional catheters may be greatly overcome via the use of a multielectrode basket catheter . Initial efforts to place multiple electrodes on a single mapping catheter were limited by electrode size. As such, basket catheter mapping was developed in the 1990s, and typical catheters contain 32–64 nickel, titanium, or platinum electrodes that are 1–2 mm long and 1 mm in diameter (Fig. 32.5) [41, 42]. Depending on the basket catheter shape and radius, the interelectrode distance can vary between 3 and 10 mm. Regardless, the accuracy in reconstruction of the chamber’s geometry and electrical activity created by the basket system relies on: (1) the number of splines on the basket; (2) the number of electrodes on each spline; and (3) the percentage of those electrodes which achieve adequate contact with the endocardial surface. These multielectrode mapping catheters facilitate the creation of high-density maps, i.e., through the simultaneous collection of data from closely spaced electrodes. It should be noted that, due to specific anatomic features of the chambers that do not allow complete endocardial coverage by the basket catheter electrodes, the quality of contact of all the electrodes with the endocardium cannot be ensured, and thus it is common that some anatomic regions cannot be adequately mapped.


Fig. 32.5
Constellation® multielectrode basket catheter (Boston Scientific, Inc.)
The initial use of basket catheters was reported in a number of animal studies which were aimed at characterizing either atrial [41] and/or ventricular arrhythmias [42]. More specifically, Triedman et al. [43] reported studies in which they utilized a Webster-Jenkins catheter (Cordis Webster, Inc., Baldwin Park, CA, USA) and a 5-spoke flexible ellipsoid with 25 bipolar electrode pairs for the mapping of right ventricular activation patterns. Data were obtained from catheters placed into the right atria and ventricles of juvenile sheep which were eliciting either normal sinus rhythm or acute and chronic pathological sequelae [43]. They concluded that employing a basket catheter had the potential to provide rapid, nearly real-time, activation sequence maps which improved their understanding of the mechanisms of complex reentrant tachyarrhythmias. Subsequently, Schalij et al., [44] reported on the first application of a basket catheter and resultant animation programs in 20 human patients with ventricular tachycardia. They reported that percutaneous endocardial mapping with basket catheters was feasible, of clinical value, and reasonably safe. Since then, basket catheter mapping has been employed in the study of numerous cardiac arrhythmias in various human populations [45–47].
Most recently, a novel multielectrode catheter and its integrated mapping system (Rhythmia mapping system, Boston Scientific) have been commercialized. The multielectrode mapping catheter (IntellaMap Orion™) has an 8 Fr profile and is equipped with a mechanism for bidirectional tip deflection. At the tip, there are 64 electrodes distributed on eight splines with an interelectrode spacing of 2.5 mm (Fig. 32.6). Electrodes can be used in either bipolar or unipolar configurations. The catheter is part of an integrated EAM system, which also includes an electronic patient interface unit and a computer workstation that is used to run the mapping software. Advanced front-end technology filters and collects high quality signals with low noise, and its open architecture allows the operator the freedom to choose and visualize most ablation or diagnostic tools. Further, the system’s dynamic review capabilities allow the user to quickly review and edit data points; it also offers automated annotation to help minimize the time required to manually annotate data collected. The position of the multielectrode array is tracked utilizing a combination of magnetic and electrical field information. Initial preclinical feasibility was reported, demonstrating that the multielectrode catheter was capable of producing high-resolution electroanatomical maps of the right atrium and the left ventricle in animal models [48, 49]. Average map acquisition times for the catheter (with continuous data collection) ranged from 5.2 to 9.5 min and these maps contained an average of 2753–3566 points.
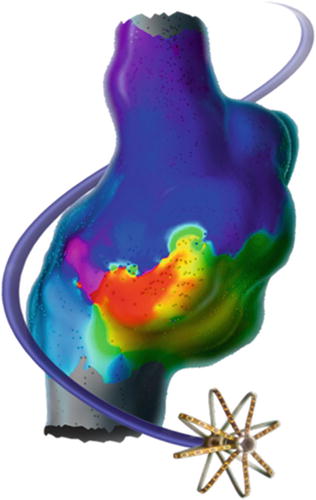

Fig. 32.6
Rhythmia mapping system’s IntellaMap Orion™ high resolution mapping catheter (Boston Scientific, Inc.). Image from http://www.bostonscientific.com/en-US/products/capital-equipment–mapping-and-navigation/rhythmia-mapping-system/redefined.html
Yet another technology has been commercialized that includes a 64 electrode basket (Topera, Inc., Menlo Park, CA, USA). The Topera 3D mapping system consists of the FDA cleared and CE marked RhythmView™ workstation and FIRMap™ panoramic contact-mapping tool, which are used in combination for the identification and localization of the sustaining mechanisms of cardiac arrhythmias such as atrial fibrillation, atrial flutter, atrial tachycardia, and/or ventricular tachycardia. The RhythmView workstation provides a graphical display of the right and left atrial electrical activities to assist in the diagnoses of arrhythmias and also to facilitate patient-specific atrial fibrillation treatment decisions. The FIRMap panoramic contact-mapping tool has been used to capture electrical potentials from the endocardium, which can then be used in conjunction with RhythmView to create activation maps to aid in the diagnosis of complex cardiac arrhythmias. The diagnostic tool (“basket”) consists of 64 evenly spaced electrodes distributed among 8 splines. Images of both the RhythmView workstation and the FIRMap catheter are shown in Fig. 32.7. To date, several reports have been recently published highlighting the clinical utility of this system [50–54].
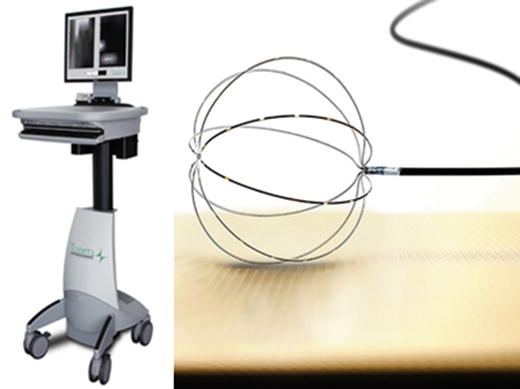

Fig. 32.7
RhythmView™ workstation and the FIRMap™ catheter . Image from http://www.toperamedical.com/patients/solution/
It should be noted that there are limitations associated with basket catheter mapping. First, the use of a basket catheter that is too large or small compared with the relative dimensions of the chamber of interest will result in poor quality of electrograms in terms of morphology, stability, and relation with the given anatomic structures. Second, it has been cited that the relative movement between the beating heart and the electrodes can be detrimental to the electrical reconstruction process or may even cause irritation of the myocardium. Lastly, due to product size constraints, the basket catheter approach does not have the ability to map areas of the atrial appendage or pulmonary veins, which play major roles in the sustenance of atrial fibrillation.
32.3.2.2 Noncontact Mapping Technologies
Recently, NCM approaches have been more widely used in the clinical diagnosis and ablative treatment of complex cardiac arrhythmias, as described by Schilling et al. [12, 55, 56]. More specifically, the EnSite™ Array™ noncontact mapping catheter , used in combination with EnSite™ Velocity system (St. Jude Medical) introduced by Taccardi et al. [57], is comprised of a catheter-mounted, inflatable multielectrode array, a reference patch electrode, amplifiers, and a workstation (Fig. 32.8). The EnSite NavX technology is an open platform that is compatible with catheters from most manufacturers and can simultaneously display up to 12 catheters and 64 electrodes.
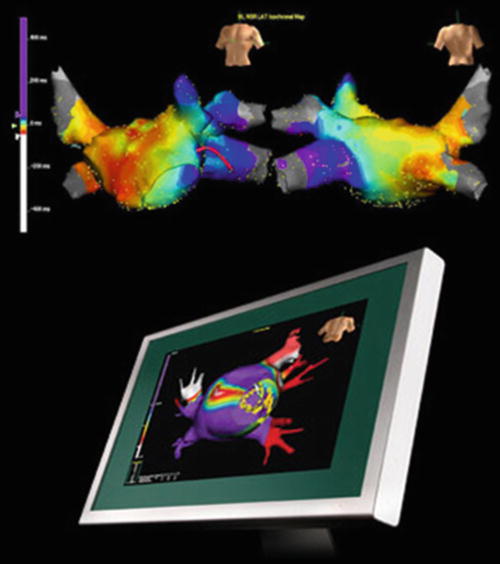

Fig. 32.8
EnSite™ NavX™ navigation and visualization technology (St. Jude Medical, Inc.)
Specifically, this system’s EnGuide® locator technology utilizes a single-use 9 Fr, 110 cm transvenous multielectrode array catheter (Fig. 32.9) consisting primarily of: (1) a polyamide insulated wire braid with 64 laser-etched unipolar electrodes; (2) a 7.5 mL inflatable polyurethane balloon; and (3) distal and proximal E1 and E2 ring electrodes. Additionally positioned on the proximal end of the catheter is a handle and cable connector that allows the physician to deploy a balloon in the chamber of interest, providing the electrical connection from the array to the patient interface unit of the system.
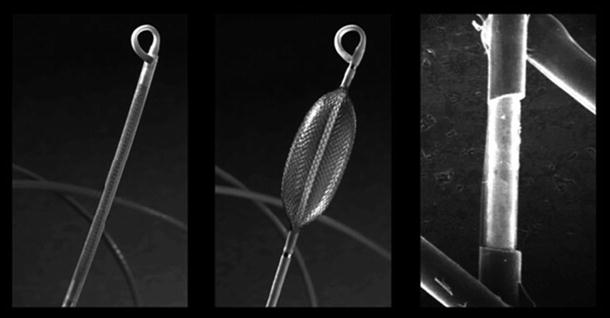

Fig. 32.9
Multielectrode array catheter (St. Jude Medical, Inc.)
Typically, the multielectrode array is inserted transvenously into the patient’s chamber of interest over a standard 0.032″ guidewire. Once positioned within a given chamber, the multielectrode array wire braid is mechanically expanded and the balloon is inflated using a 50/50 contrast-saline solution. Next, a second catheter, termed the roving catheter , is introduced into the same chamber of interest. Following connection to the breakout box, the system’s EnGuide® technology emits a low 5.68 kHz signal via the tip of the roving catheter that is detected by the E1 and E2 ring electrodes on the multielectrode array catheter. Subsequently, by determination of the locator signal angles and strengths, the system is able to compute the 3D relationship of the tip of the roving catheter to that of the multielectrode array catheter ring electrodes. In order to reconstruct the 3D virtual endocardium of the chamber, the roving catheter continues to emit the 5.68 kHz signal as it is moved around the chamber by dragging the tip around the endocardial wall’s contour.
< div class='tao-gold-member'>
Only gold members can continue reading. Log In or Register to continue
Stay updated, free articles. Join our Telegram channel

Full access? Get Clinical Tree


