No published studies have evaluated the role of cardiac magnetic resonance (CMR) imaging for the assessment of Ebstein anomaly. Our objective was to evaluate the right heart characteristics in adults with unrepaired Ebstein anomaly using contemporary CMR imaging techniques. Consecutive patients with unrepaired Ebstein anomaly and complete CMR studies from 2004 to 2009 were identified (n = 32). Volumetric measurements were obtained from the short-axis and axial views, including assessment of the functional right ventricular (RV) end-diastolic volume (EDV) and end-systolic volume. The volume of the atrialized portion of the right ventricle in end-diastole was calculated as the difference between the total RVEDV and the functional RVEDV. The reproducibility of the measurements in the axial and short-axis views was determined within and between observers. The median value derived from the short-axis and axial views was 136 ml/m 2 (range 59 to 347) and 136 ml/m 2 (range 63 to 342) for the functional RVEDV, 153 ml/m 2 (range 64 to 441) and 154 ml/m 2 (range 67 to 436) for the total RVEDV, 49% (range 32% to 46%) and 50% (range 40% to 64%) for the functional RV ejection fraction, respectively. The axial measurements demonstrated lower intraobserver and interobserver variability than the short-axis approach for all values, with the exception of the intraobserver functional RVEDV and interobserver total RVEDV for which the limits of agreement and variance were not significantly different between the 2 views. In conclusion, measurements of right heart size and systolic function in patients with Ebstein anomaly can be reliably achieved using CMR imaging. Axial imaging appeared to provide more reproducible data than that obtained from the short-axis views.
In recent years, cardiac magnetic resonance (CMR) imaging has emerged as the reference standard for cardiac imaging in patients with many forms of congenital heart disease, in particular for lesions that affect the right ventricle. Despite the integration of CMR imaging for the initial assessment and subsequent follow-up of adults with congenital heart disease in the management guidelines from groups worldwide, no data are available to define the role of CMR imaging in the assessment of Ebstein anomaly. This is particularly striking, given the recognized complexity of right ventricular (RV) anatomy in this lesion. The only quantitative imaging parameter used to guide contemporary surgical referral for those with Ebstein anomaly in consensus statements is enlarged cardiothoracic ratio. No published studies have focused on the CMR imaging assessment of Ebstein anomaly. We hypothesized that multiplanar CMR imaging would allow for precise and reproducible measurements of the right heart size and systolic function in those with the Ebstein anomaly. Therefore, we sought to evaluate the role of CMR imaging in the evaluation of right heart disease in adults with an unrepaired Ebstein anomaly, with particular emphasis on the optimal view for quantification of right heart size and function.
Methods
Consecutive adults with an unrepaired Ebstein anomaly who had been referred for a CMR study from May 2004 to December 2009 at our hospital were retrospectively identified. This initial point was chosen, because it reflected a change in the CMR imaging protocol and sequence acquisition at our institution that continues to be used at present. The patients were included if the CMR studies were technically adequate for image analysis with a complete complement of cine views (4-chamber, axial, and short-axis views). The exclusion criteria included previous tricuspid valve surgery, Ebstein-like tricuspid valve in the context of complex congenital heart disease (e.g., congenitally corrected transposition of the great arteries), and incomplete CMR studies with inadequate image quality for quantitative analysis. Echocardiograms that were contemporaneous with the CMR studies (most echocardiograms were performed within 2 weeks of the CMR studies, and, with one exception, all echocardiograms were performed within 3 months of the CMR studies) were reviewed specifically for tricuspid valve morphology (displacement of the septal and/or posterior leaflet and a “sail-like” quality of the anterior leaflet) to confirm the diagnosis of the Ebstein anomaly and to assess tricuspid valve function (i.e., incompetence or stenosis).
All studies were performed using a standard commercially available 1.5T scanner. The technical parameters of our CMR studies have recently been published. In brief, steady-state free-precession imaging of the ventricles in the 2- and 4-chamber planes was performed, followed by the prescription of contiguous short-axis slices oriented perpendicular to the long axis of the heart from the base to the apex. Axial imaging was obtained from a point superior to the RV outflow tract and pulmonary valve to a point inferior to the diaphragmatic surface of the right ventricle to cover the heart in its entirety ( Figure 1 ). The typical slice thickness was 6 to 8 mm for the axial stack and 8 to 10 mm for the short-axis view.
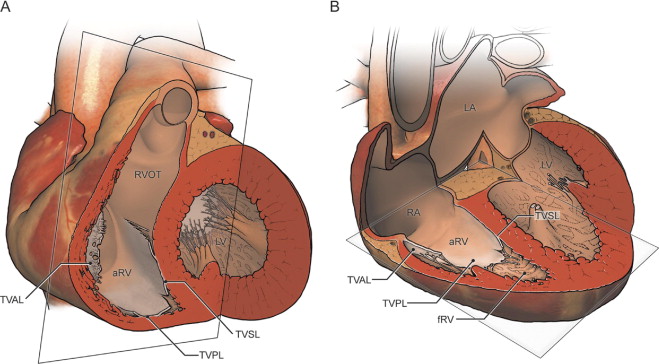
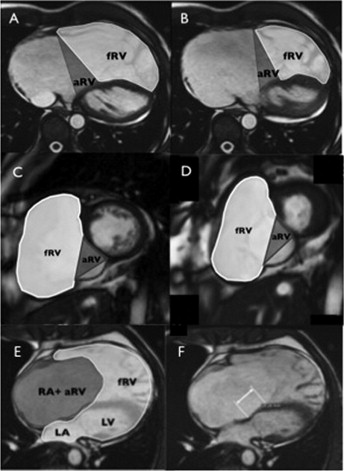
To fully characterize right heart size and function, the functional RV, atrialized RV, and total RV volumes were measured. The functional RV was defined as the aspect of the ventricle distal to the attachment points of the tricuspid valve leaflets. The border demarcating the functional RV from the atrialized RV was defined as a line connecting the free wall attachment of the anterior tricuspid valve leaflet at the level of the annulus and the septal attachment of the apically displaced leaflet, drawn in end-diastole and end-systole on the axial and short-axis views, respectively ( Figure 2 ). The border between the atrialized RV and the morphologic right atrium was defined as a line connecting the free wall attachment of the anterior tricuspid valve leaflet and the tricuspid valve annulus (i.e., the point of presumed septal leaflet attachment, adjacent to the mitral valve insertion point, had there been normal tricuspid valve development). The total RV volume was defined as a summation of the functional RV and atrialized RV volumes.
The end-diastolic volume (EDV) and end-systolic volume of the functional right ventricle and the EDV of the total RV were measured in the axial and short-axis views. Most RV trabeculae were excluded to the blood pool. The stroke volume was derived from the difference between the EDV and end-systolic volume. The left ventricular EDV and end-systolic volumes were measured in the short-axis view, according to accepted practice. The volumes were derived using a standard commercially available software package (MASS, Medis, Leiden, The Netherlands) and were indexed to the body surface area.
From the 4-chamber view, the absolute apical displacement of the septal tricuspid valve leaflet was measured in ventricular diastole ( Figure 2 ) and indexed to the body surface area. The areas of the right atrium, atrialized RV, functional RV, left atrium, and left ventricle were traced in end-diastole on the 4-chamber view and are reported as a severity score, as previously described echocardiographically by Celermajer et al ( Figure 2 ): severity index = (right atrial area + atrialized RV area)/(functional RV area + left atrial area + left ventricular area). The companion measures of septal leaflet displacement and severity score were derived from the corresponding echocardiographic views.
The RV volumes of 10 randomly selected patients (31% of the population) were remeasured by the same investigator who was unaware of the original measurements to determine the intraobserver variability. The interval between the first and second measurements for a single patient was 90 to 120 days. Similarly, the RV volume of an additional 10 randomly selected patients (31% of the population) was measured independently by a second investigator who was unaware of the results derived by the first investigator.
Statistical analysis was performed using the Statistical Package Social Sciences, version 17.0, software program (SPSS, Chicago, Illinois). The data are described as the mean ± SD or the median and range, as appropriate. The Pearson or Spearman correlation coefficient, as appropriate, was used to determine the relation between measurements derived from the axial and short-axis views. The between-group comparisons (such as axial vs short-axis volumetrics) were performed using Student’s t test or Mann-Whitney U test for continuous variables. The chi-square test or Fisher’s exact test was used to compare the categorical variables. Bland-Altman plots were used to display the variation between the RV volumes calculated from the axial and short-axis views. For each of the methods (axial and short-axis views), the mean percentage of difference, standard deviation, and variance were also calculated to determine the intra- and interobserver variability. Statistical significance was set at p <0.05. The research ethics board at our institution approved the study.
Results
Clinical data were available for 31 patients (median age at CMR study 39 years, range 21 to 68; 72% women). Most were classified as New York Heart Association (NYHA) functional class I (20 [65%]) or NYHA functional class II (10 [32%]), with 1 as NYHA functional class III (3%) and none as NYHA functional class IV. A significant subset (15 [48%]) of patients had atrial level shunts (patent foramen ovale or secundum atrial septal defect) on the echocardiogram and/or CMR imaging study; moderate or severe tricuspid regurgitation was evident in most patients on the echocardiogram (23 [74%]). At least one episode of sustained atrial arrhythmia (lasting ≥30 seconds) was documented in nearly ½ of the patient population (14 [45%]).
A total of 41 CMR studies were identified; however, 32 complete CMR studies were analyzed (3 studies were terminated early because of claustrophobia, 4 studies did not have both axial and short-axis cine imaging, and 2 studies had insufficient cardiac gating in the context of persistent arrhythmia with consequent degradation in image quality). A single patient was referred to our institution for CMR analysis alone without any accompanying clinical data. From the CMR measurements, the median apical displacement of the tricuspid valve was 3.0 cm (range 1.7 to 6.7) and the median value indexed to the body surface area was 1.6 cm/m 2 (range 0.8 to 4). The median severity score was 0.4 (range 0.2 to 2.2). From the echocardiographic measurements, the median apical displacement of the tricuspid valve was 3.1 cm (range 1.7 to 5.5), and the median value indexed to the body surface area was 1.6 cm/m 2 (range 0.9 to 3.4). The median severity score was 0.37 (range 0.18 to 1.87). The differences in the values obtained from echocardiography and CMR imaging were not statistically significant (measures of absolute tricuspid valve displacement, p = 0.453; indexed tricuspid valve displacement, p = 0.544; and severity score, p = 0.647).
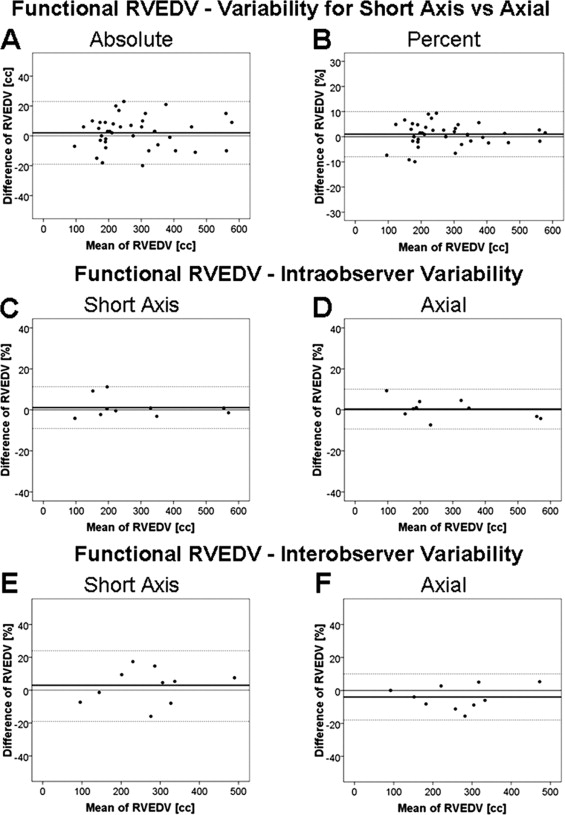
The CMR characteristics relating to the heart volumes and ejection fraction for the population studied are summarized in the Table 1 . A comparison of the axial and short-axis measurements using the Bland-Altman method is demonstrated in Figure 3 and Table 2 . The intra- and interobserver variabilities for the RV volumes and ejection fraction assessed by the Bland-Altman method are listed in Tables 3 and 4 . Figure 3 illustrates the intra- and interobserver variability of functional RVEDV measurements. The intra- and interobserver variability for the axial measurements were lower than those with the short-axis approach for all values, with the exception of the intraobserver functional RVEDV and interobserver total RVEDV, for which the limits of agreement and variance were not significantly different between the 2 views. Good correlations were found between the atrialized RVEDV from the axial and short-axis views and the following CMR measurements: magnitude of apical displacement of the septal leaflet indexed to the body surface area (r = 0.459, p = 0.008, and r = 0.464, p = 0.008, respectively) and the severity score (r = 0.459, p = 0.008, and r = 0.464, p = 0.008, respectively).
| Variable | Short-Axis View | Axial View | p Value |
|---|---|---|---|
| Total right ventricular end-diastolic volume (mL) | 271 (102–719) | 268 (107–711) | 0.5 |
| Total right ventricular end-diastolic volume indexed (mL/m 2 ) | 153 (64–441) | 154 (67–436) | 0.5 |
| Functional right ventricular end-diastolic volume (mL) | 239 (95–565) | 240 (101–558) | 0.2 |
| Functional right ventricular end-diastolic volume indexed (mL/m 2 ) | 136 (59–347) | 136 (63–342) | 0.1 |
| Atrialized right ventricular end-diastolic volume indexed (mL/m 2 ) | 19 (2–94) | 16 (4–94) | 0.3 |
| Functional right ventricular end-systolic volume (mL) | 119 (43–306) | 117 (44–270) | 0.2 |
| Functional right ventricular end-systolic volume indexed (mL/m 2 ) | 71 (27–157) | 70 (27–140) | 0.2 |
| Functional right ventricular stroke volume (mL) | 113 (19–298) | 118 (57–329) | 0.002 |
| Functional right ventricular ejection fraction (%) | 49 (32–64) | 50 (40–64) | 0.041 |
| Left ventricular end-diastolic volume (mL) | 106 (47–170) | — | — |
| Left ventricular end-diastolic volume indexed (mL/m 2 ) | 61 (27–90) | — | — |
| Left ventricular end-systolic volume (mL) | 70 (21–131) | — | — |
| Left ventricular end-systolic volume indexed (mL/m 2 ) | 42 (12–68) | — | — |
| Left ventricular stroke volume (mL) | 66 (33–108) | — | — |
| Left ventricular ejection fraction (%) | 61 (51–74) | — | — |
Stay updated, free articles. Join our Telegram channel

Full access? Get Clinical Tree


