INTRODUCTION
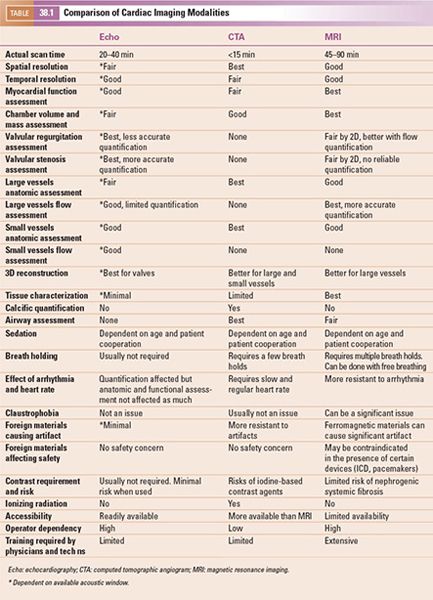
In the current era, multimodality imaging techniques are being used more frequently as their clinical utilities become better appreciated. There are several choices available when it comes to detailed imaging. Cardiac computed tomographic angiogram (CTA) and magnetic resonance imaging (MRI) provide excellent imaging alternatives in patients with limited acoustic windows, particularly in children who have undergone multiple surgeries as well as in adults with congenital heart disease. A general knowledge of the strengths and weaknesses of various imaging modalities can be helpful in choosing the ideal imaging modality in a given clinical scenario. Depending on the information sought, one or more imaging techniques may be utilized together to answer the clinical question. Table 38.1 gives a summary of the advantages and disadvantages of these imaging modalities. These parameters should be kept in mind when ordering an advanced imaging technique.
COMPUTED TOMOGRAPHY
General Principles
Rapidly rotating x-ray beams and detectors are utilized to create images in computed tomography (CT). The data from the detectors are then computer processed to generate a batch of images in parallel axial planes. Postprocessing of the acquired data set can then generate other fundamental (coronal and sagittal) or oblique planes to analyze anatomy and obtain precise measurements. The major strengths of CTA are a short scan time and very high spatial resolution. Because of its superior spatial resolution, CTA is the preferred noninvasive modality for imaging small vessels such as coronary arteries and aortopulmonary collaterals. However, the spatial resolution of CTA is not as good as an invasive angiogram performed during cardiac catheterization. With the advances in multidetector CT scanners, the scan time is becoming shorter along with continued improvement in image resolution. The temporal resolution of MRI has traditionally been better than that of CTA images. However, with the newer imaging techniques and postprocessing software, this difference is becoming less significant. The other advantage of CTA is its utility in patients with implanted devices (implanted defibrillators, pacemakers) and those where ferromagnetic foreign material such as stainless steel coils can cause significant artifacts with MRI. The limitations of CTA in imaging pediatric patients are exposure to ionizing radiation and the need for sedation. With the continued advances in the field, the radiation exposure during CTA is much less now but still remains significant. Owing to a short scan time, sedation is also becoming a less important issue. The use of an iodinated contrast agent can be another limiting factor, especially in patients with renal disease. For most patients, CTA will be sufficient to define the anatomy but flow analysis and tissue characterization cannot be performed with this modality.
Technical Aspects
Nonionic iodinated contrast is used for CTA to allow for better visualization of structures and to provide contrast between vascular and nonvascular structures. Preferably, the contrast is injected by a power injector via a large bore intravenous catheter to allow easy and uniform flow. However, this is not always possible, especially in small pediatric patients in whom only a small caliber intravenous catheter can be placed. In that situation, the contrast can be injected by hand. The CTA scan also has to be timed with the contrast injection. This scanning delay time is based on the structures of interest and the underlying cardiovascular anatomy. The goal is to acquire the images at a time when the maximum concentration of the contrast is in the area of interest. For example, to better visualize the pulmonary arteries in a patient who had undergone a cavopulmonary anastomosis, the scanning time delay will be shorter than in a patient with a normal four-chambered heart. The cardiac output and the circulation time are also factored into setting the scanning time delay. This delay can also be timed by using a marker in the area of interest which monitors the Hounsfield units (gray scale) in that particular area and triggers the scanner when this area changes in Hounsfield units due to the presence of the contrast. ECG-gating is used to reduce the blurring from cardiac motion and helps to provide better visualization of intracardiac anatomy and vascular structures close to the heart, such as coronary arteries and the aortic root. It is also needed to generate cine images for functional and volumetric assessments. For these reasons, a regular and slow heart rate is required for an optimal image acquisition. In infants with faster heart rates, esmolol infusion may be used to transiently decrease the heart rate. The vascular structures away from the heart such as the aortic arch, the descending aorta, and the branch pulmonary arteries can be imaged without ECG-gating. A brief breath-hold is also needed to abolish the movement artifact caused by breathing. Mild sedation with oral chloral hydrate or intranasal midazolam is usually sufficient in children less than 6 years of age. Rarely, infants may require deep sedation with propofol or ketamine, or general anesthesia. The anatomic coverage of the scan is decided based on the clinical question and the areas of interest; however, limiting the coverage area may lead to waste of matrix space and loss of resolution. A slice thickness is set based on the desired spatial resolution. For visualization of small structures, the thickness can be made smaller but only at the expense of increased radiation exposure.
Postacquisition Image Processing
The acquired data set has extensive possibilities of postacquisition image processing for both CTA and MRI. Various software are available and can be used to generate images in traditional and nontraditional planes and to perform volumetric analyses. These postprocessing techniques are fast and can be completed soon after the scan.
1. Multiplanar Reformatting: The fundamental imaging planes are axial, sagittal, and coronal which are at 90 degrees to each other. In multiplanar reformatting (MPR), oblique imaging planes are generated by altering three 2D imaging planes similar to the fundamental planes (Fig. 38.1). Since these three planes remain perpendicular to each other, the anatomic and spatial relationship of structures can be better understood. MPR can be used to generate a true short-axis plane of a vessel (e.g., ascending aorta) and is also referred to as double oblique technique. Two oblique planes are oriented along the long axis of the vessel which makes the third plane absolutely perpendicular to the direction of blood flow, generating a true short-axis image (Fig. 38.2). Curve-planar reformatting (CPR) is a variant of MPR where a curved or tortuous vessel is depicted in a single plane created by using multiple imaging planes (Fig. 38.3). CPR is usually used to assess caliber along the length of aorta, pulmonary arteries or coronary arteries. Only the vessel along the central line should be assessed in this format as the remainder of the anatomy in these images is distorted to straighten the vessel of interest.
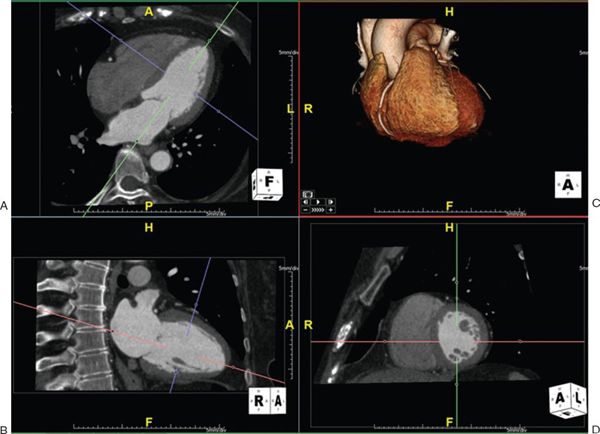
Figure 38.1. Example of multiplanar reformatting. The three planes are perpendicular to each other, shown as blue, red, and green lines on the top left and the bottom panels. A: A true apical four-chamber view is shown. The green line indicates the plane of a two-chamber view of the left ventricle shown in B. The blue lines represent a true short-axis of the left ventricle shown in D. C: shows the volume-rendered 3D reformatted image. Image plane orientation is specified by the cube in right lower corner.
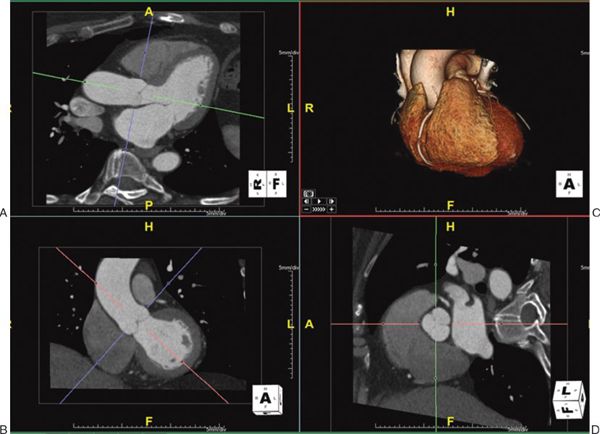
Figure 38.2. Measurement of aortic root using double oblique technique. The green, red, and blue lines indicate the planes of interrogation. A: A long-axis view of the left ventricle. The green line is directly parallel to the blood flow and indicates the plane which is shown in the bottom left panel. B: The red line is also parallel to the blood flow. Since these two planes are parallel to the blood flow, the third plane (depicted as the blue line) is perpendicular to the blood flow and creates an absolute short-axis view of the aortic root, shown in D. C: shows the volume-rendered 3D reformatted image. Image plane orientation is specified by the cube in right lower corner.
2. Maximum Intensity Projection: Maximum intensity projection (MIP) is a technique in which a 2D image is given some depth to make it a slab rather than a slice. This gives a 3D effect to small structures and is primarily useful to better visualize longer lengths of small vessels such as coronary arteries or intrapulmonary vessels (Fig. 38.4).
3. Three-Dimensional Volume Rendering: Three-dimensional volume rendering allows reconstruction of 3D volumes based on 2D images (Fig. 38.5). This technique is of immense value in assessing the anatomic spatial relationship of various structures to each other such as airway and aortic branches.
MAGNETIC RESONANCE IMAGING
General Principles
MRI uses magnetic signals from hydrogen ions (protons) in various tissues to generate an image. These ions are also referred to as “spins” as they precess (or spin) around the axis of the external magnetic field of the MRI scanner. By use of a strong external magnetic field, hydrogen ions are stimulated to emit radiofrequency waves which are then computer processed to generate images. Water and fat yield the highest signals due to their higher concentration of hydrogen ions. Based on the variable concentration of water and fat content in adjacent tissues, signals of variable strengths are generated that allow delineation of structures and assessment of tissue characteristics. Owing to its property of creating a better tissue contrast, MRI has become the gold standard for ventricular volume and mass measurements. The additional major benefits of MRI are (a) freely selectable imaging planes without being limited by acoustic windows or overlapping structures, (b) avoidance of ionizing radiation, (c) accurate flow quantification by phase contrast velocity mapping, (d) strain analysis utilizing tagging of the myocardium, and (e) assessment of myocardial viability and perfusion. In contrast to CTA where the actual images obtained are a stack of tomograms in the axial plane, imaging planes in MRI can be oriented in any desired direction. This is especially useful in obtaining cine images in any desired plane comparable to echocardiography, but without being limited by acoustic windows.
The advantages of MRI come at the expense of prolonged acquisition time. A comprehensive assessment of cardiac anatomy and function in a patient with complex congenital heart disease can take up to several hours. Such a prolonged scanning time is not acceptable. Therefore, the imaging sequences to be employed during a cardiac MRI need to be carefully selected to obtain all of the required information while spending the least amount of time in the scanner. While also important for CTA imaging, it is of immense importance that the MRI operator have knowledge of the anatomic and functional details of the patient from other imaging modalities such as echocardiography and cardiac catheterization. In cases of postoperative assessment, reviewing the surgical notes is of utmost importance.
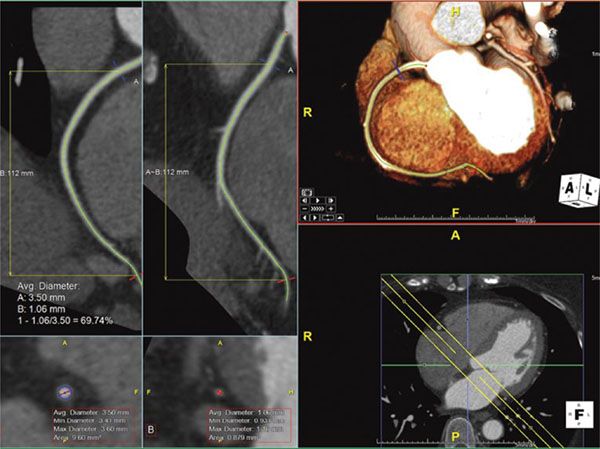
Figure 38.3. Curve-planar reformatted (CPR) images of the right coronary artery. Top right panel: The right coronary artery along its length is shown using volume-rendered 3D reconstruction with a slab thickness of 18 mm, represented by the yellow lines in the bottom right panel. The top left and the top middle panels are CPR images showing the long length of the right coronary artery. The bottom left and the bottom middle panels show short-axis views at the blue and red lines transecting the CPR images. Image plane orientation is specified by the cube in right lower corner.
In contrast to CTA, images obtained by MRI are extremely operator dependent. This is particularly true in pediatric and adult congenital heart disease. Most of the MRI scanners are optimized for adult patients and thus require adjustments in its parameters for smaller pediatric patients. Similarly, many pediatric and adult patients with congenital heart disease may have foreign materials, such as coils or stents, in their chest which can create significant artifacts during an MRI scan. To optimize MRI images in the presence of such artifacts requires an in-depth knowledge of MRI physics and therefore requires extensive training. From the safety perspective, MRI is a great option to obtain detailed anatomic and functional information while avoiding ionizing radiation exposure. On the other hand, the presence of certain devices such as implantable defibrillators, pacemakers, and other implants may preclude the use of MRI due to safety concerns. Some of the newer devices are MRI compatible but require specially designed protocols to avoid harm. Other foreign materials like coils, clips, and wires, may be safe for MRI but can cause significant artifacts. Vascular occluding stainless steel coils are particularly problematic in creating significant artifacts. Most of the prosthetic valves, intravascular stents, and newer occluding devices create only a localized artifact which may hinder assessment of structures close to the foreign material. Specific sequences, which require more time but give less optimal tissue differentiation, can be employed to assess the structures lying within the artifact.
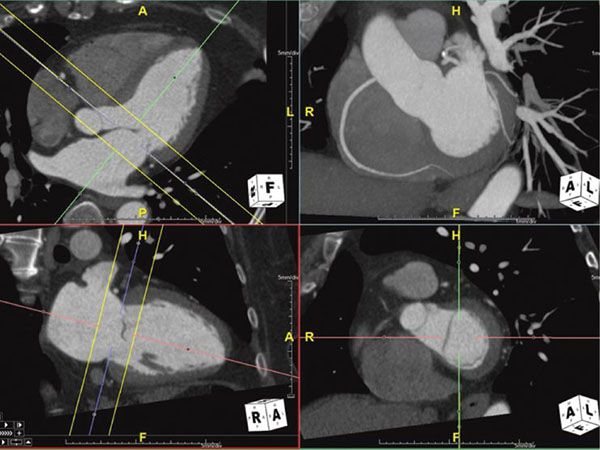
Figure 38.4. Maximum intensity projection image of the right coronary artery. Top right panel shows the MIP image of the right coronary artery showing the long length of the vessel. This image is in exactly the same plane as the bottom right panel with the addition of some depth to the image (slab). This slab is represented by the yellow lines in the multiplanar reformatted images on the left panels. Image plane orientation is specified by the cube in right lower corner.
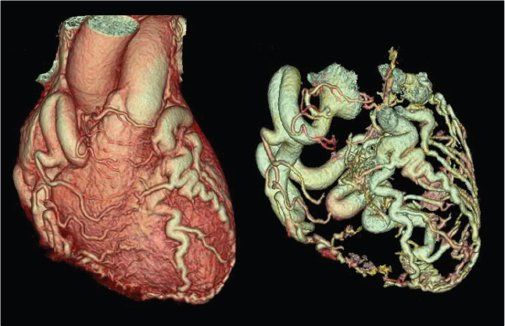
Figure 38.5. Three-dimensional volume-rendered images of anomalous left coronary artery arising from the pulmonary artery (ALCAPA). Dilated right coronary artery with extensive collateral connections with the left coronary artery can be seen in a typical “adult-type” of ALCAPA.
Technical Aspects
The principles of MRI and its physics are far more complex than that of CTA. To familiarize readers with the MRI techniques, we will focus only on key concepts that are needed for cardiologists who generally do not perform these scans but review the images. Similar to CTA, MRI is also timed to the cardiac cycle. But in contrast to CTA, the images obtained by MRI are from averaged signals over several cardiac cycles. This timing can be achieved by the electrocardiogram or vectorcardiogram. This can also be achieved by using the intrinsic cardiac motion, referred to as self-gating. Self-gating is particularly useful in patients with arrhythmias or very abnormal ECGs (e.g., bizarre T waves or bundle branch block), which may not allow for appropriate triggering. Blurring of images resulting from breathing movement can be avoided by breath holding for 10–15 seconds. Unlike CTA which can be completed in a single breath-hold, MRI usually requires several breath-holds throughout the entirety of the exam. Alternatively, respiratory gating or navigator can be used to acquire data only at the end of expiration while the patient continues to breathe freely. This, however, can prolong the scan time significantly. Sedation may be needed especially in younger children. Infants, toddlers, and young school-age children may need general anesthesia. Adolescents can be scanned without sedation, but their cooperation to avoid movement and for breath-holding is needed. Claustrophobia may be another significant problem. Critically ill children are generally not suitable to undergo an MRI scan due to its prolonged scanning time.
Anatomic Assessment
To define anatomy, double inversion (DI) dark blood T1-weighted MRI yields high-resolution images of myocardial tissue and blood vessel walls where the blood yields low signal and appears dark (Fig. 38.6). Another technique called half-Fourier acquisition single-shot turbo spin echo (HASTE) can also be used to quickly acquire dark blood images, but at a lower resolution than the DI dark blood images. In the presence of ferromagnetic foreign material, the best images can be obtained by HASTE, fast spin echo (FSE) or turbo spin echo (TSE) sequences. Steady-state free precession (SSFP) imaging also yields high-resolution images of myocardial tissue and blood vessels. In contrast to DI images, in images acquired by SSFP the blood is bright and imaging is dependent on the contrast between the high signal of the blood and the low signal from tissue (Figs. 38.7 and 38.8, Videos 38.1 and 38.2). This type of imaging is currently the state of the art, but is very susceptible to artifacts in the presence of ferromagnetic material.
Gadolinium-based contrast agents can be used to enhance imaging. Gadolinium is an element with seven unpaired electrons in its outer shell and is paramagnetic. It is toxic in its native form and must be bound to a chelator such as diethylenetriamine penta-acetic acid (DTPA) to be used. This chelation increases renal excretion of gadolinium by a factor of approximately 500. The half-life is approximately 1.5 hours. Gadolinium works by increasing the relaxation of the surrounding protons in a dose-dependent fashion. Once gadolinium is injected into the cardiovascular system, the target structure (e.g., aorta) takes up the agent, whereas the background tissue does not. This method is principally useful in magnetic resonance angiography (MRA) to image vascular structures.
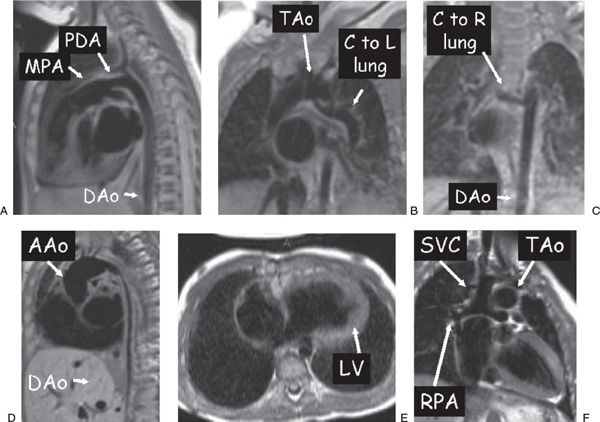
Figure 38.6. Examples of dark blood imaging. A: Patent ductus arteriosus (PDA) in a 3-week-old infant. B and C: A 3-month-old with tetralogy of Fallot with pulmonary atresia. A collateral (C) off the underside of the transverse aortic arch (TAo) going to the left (L) lung (B) and an additional collateral coming off the descending aorta (DAo) going to the right (R) lung (C) are clearly visualized. D: Diffuse DAo hypoplasia in a 2-year-old with Williams syndrome. E: A 1-year-old with tricuspid atresia who has undergone a hemi-Fontan procedure. F: Ventricular long-axis view of the atretic tricuspid valve and the left ventricle (LV). Superior vena cava (SVC)–to–right pulmonary artery (RPA) anastomosis. AAo, ascending aorta; MPA, main pulmonary artery.
Functional and Physiological Assessment
One of the more powerful applications of MRI is the assessment of cardiovascular physiology and function by the use of video images (see Figs. 38.7 and 38.8, Videos 38.1 and 38.2). In this technique, multiple lines of imaging data are obtained at multiple phases of the cardiac cycle in a given plane, allowing the visualization of both cardiac motion and blood flow. In this type of imaging, MRI produces a high-amplitude signal from the blood (white blood imaging) and a lower-amplitude signal from the tissue. Calculation of ventricular volume and mass, regional wall motion assessment, and blood flow visualization is performed in this manner. If turbulence is present, cine images will demonstrate a signal void (dark) in the region (see Fig. 38.8, Videos 38.2 and 38.3). This is used to detect valvar regurgitation, valvar stenosis, or blood vessel stenosis. Cine images can be obtained by two general sequences. The older form is termed spoiled gradient echo (SPGRE), where the signal of blood is higher than that of tissue. The more recent and more commonly used type is SSFP, where blood is exceptionally bright and there is a very high contrast between blood and tissue signals. SSFP is a much faster sequence and has elements of both T1- and T2-weighting. Because of its short acquisition time, it is used when performing “real-time” video or when using “interactive real-time” to allow “sweeps” to be performed interactively in real time. The SSFP sequences have susceptibility to artifacts from ferromagnetic materials. In the presence of such materials, alternative imaging techniques like fast or turbo gradient recalled echo (GRE) can create images with fewer artifacts at the expense of decreased image contrast and resolution.
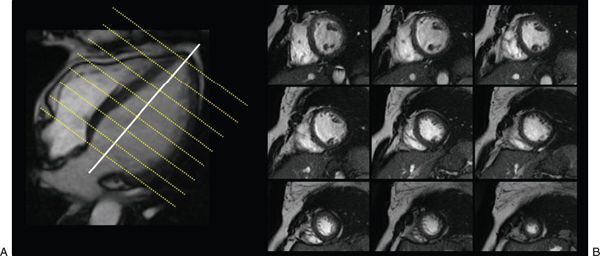
Figure 38.7. Cine images of short-axis stack used to evaluate ventricular function. A: A true apical four-chamber view. Each imaging plane on B is represented by a yellow line on the left image (see Video 38.1).
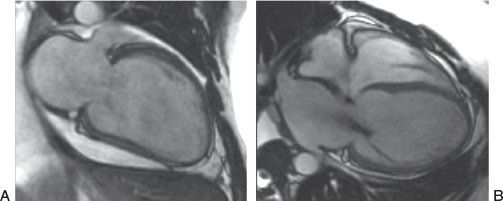
Figure 38.8. Steady-state free precession sequence in a patient with nonischemic dilated cardiomyopathy. A: Two-chamber view of the left ventricle. B: Four-chamber view of the heart. The left ventricular geometry has a more spherical shape. The presence of dephasing across the mitral valve in the right panel is created by flow turbulence in the setting of mitral regurgitation (see Video 38.2).
Phase contrast velocity mapping is a special sequence in which the velocity of blood or any tissue can be determined. This sequence comes in two forms: (a) through-plane velocity mapping (Fig. 38.9), where velocity is encoded into and out of the plane of the image, and (b) in-plane velocity mapping (Fig. 38.10), where velocity is encoded in the plane of the image (similar to Doppler echocardiography). The advantage of through-plane velocity mapping is that if a blood vessel is imaged in cross section, all of the pixels that encode for velocity in the blood vessel can be summed over the entire cross-sectional area of the vessel and over the entire cardiac cycle. This can therefore be used to obtain flow (as in liters per minute, not just velocity). Directionality of flow is coded as a positive signal in one direction (bright on the image) and a negative signal in the other direction (dark on the image). By this method, for example, cardiac index can be obtained by performing phase contrast velocity mapping across the aortic valve. The pulmonary-to-systemic flow ratio (Qp/Qs) in a patient with an intracardiac shunt can be obtained by comparing this value with the phase contrast velocity mapping across the pulmonary valve. The regurgitant fraction of the aortic or pulmonary valves can be calculated similarly by dividing the backward flow by the forward flow and multiplying by 100.
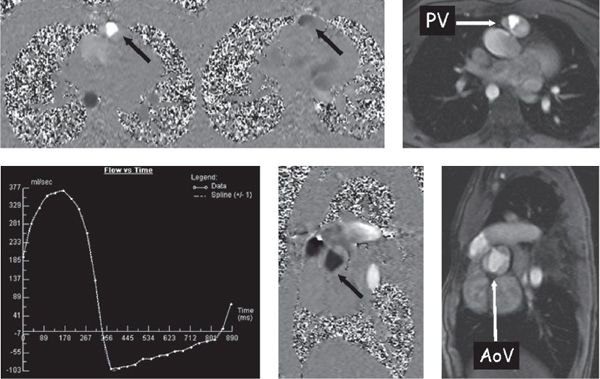
Figure 38.9. Phase-encoded velocity mapping. Top: Patient with tetralogy of Fallot after a transannular patch repair with resultant pulmonary valve (PV) insufficiency. Right: Anatomic image of the pulmonary valve in cross section. Through-plane phase-encoded velocity mapping is used to quantify flow (see text) and direction is encoded as dark or bright. Left: Phase map at mid-systole. The signal is bright (arrow) across the pulmonary valve, demonstrating antegrade flow. Middle: Captured in early diastole and black across the pulmonary valve, demonstrating retrograde flow (arrow). Bottom left: Flow-time curve generated from this PV velocity map. Bottom middle and right: Phase-encoded velocity map and anatomic image, respectively, demonstrate a cross section of the trileaflet aortic valve (AoV) of the same patient with tetralogy of Fallot (arrow).
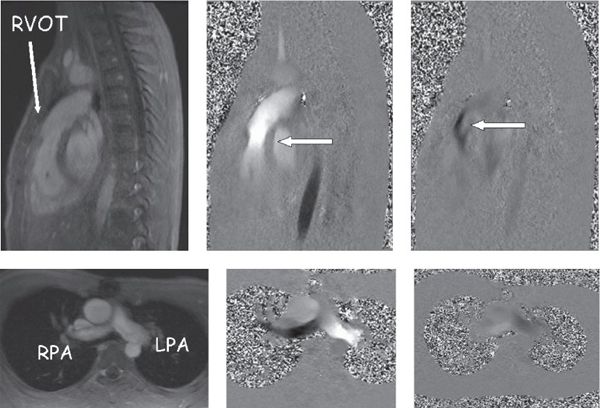
Figure 38.10. In-plane phase-encoded velocity mapping in a patient with tetralogy of Fallot after a transannular patch repair with pulmonary insufficiency. Top: Right ventricular outflow tract. Bottom: Pulmonary arteries in the bifurcation view. Left: Anatomic images. Top middle and right: Antegrade (bright signal encodes flow toward the head) flow in systole and retrograde (dark signal encodes flow toward the feet) flow in diastole through the pulmonary valve (arrows). Bottom middle (systole) and right (diastole) images demonstrate antegrade (bright signal encodes flow to the left) and retrograde (dark signal encodes flow to the right) in the branch pulmonary arteries.
Because of the quantitative nature of MRI, internal consistencies of the data can be easily evaluated. For example, cardiac index is measured from both the aorta and pulmonary artery and, in the absence of any intracardiac shunt and valve dysfunction, these values should be similar (within 10% of each other). The sum of flow in the right and left pulmonary arteries should be equal to that in the main pulmonary artery. Similarly, in the absence of atrioventricular valve insufficiency, the stroke volume of the left ventricle by volumetric analysis should be equal to the forward flow in the aorta by phase contrast velocity mapping. This approach ensures data integrity and is one of the unique features of MRI.
Myocardial tissue tagging (Fig. 38.11) is an MRI technique used to assess ventricular function. This methodology “magnetically labels” the walls of the myocardium and divides it into “cubes of magnetization.” This can be tracked over a cardiac cycle to demonstrate myocardial deformation. This technique is similar to speckle tracking in echocardiography and allows for the calculation of regional wall strain, wall motion, and torsion. A set of radiofrequency pulses are used to destroy the signals of the protons in parallel lines which results in dark bands on the image. This can be done in a “grid” pattern or as a series of one set of parallel lines using an MRI technique termed spatial modulation of magnetization (SPAMM). Similarly, blood tagging can also be performed, allowing for visualization of velocity profiles. This labeling can be done by bolus tagging, where only a thin stripe is laid down on the blood vessel to label it, or it can use a large stripe that is laid down on the blood to detect shunt flow.
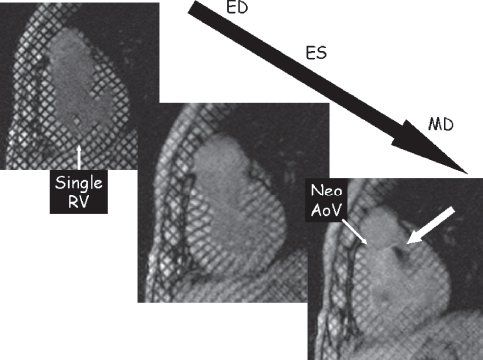
Figure 38.11. Myocardial tissue tagging. This technique uses spatial modulation of magnetization (SPAMM) to lay a series of black parallel lines onto the myocardium dividing the myocardium into “cubes of magnetization.” As the cardiac cycle progresses from end-diastole (ED), the deformation of the regional myocardium can be tracked and strain/wall motion can be quantified. This is an example of a patient with hypoplastic left heart syndrome after the Fontan procedure in a short-axis orientation at ED (top left), end-systole (ES) (middle), and mid-diastole (MD) (bottom right). This video sequence can identify turbulent jets of blood by a loss of signal. In this example, the bottom right image demonstrates insufficiency from the neoaortic valve (Neo AoV). RV, right ventricle.
Tissue Characterization
Tissue characterization is a unique advantage of MRI. By suppressing signals from water or fat and by manipulating T1 and T2 weightings, composition of a tissue can be assessed (Fig. 38.12). These maneuvers are employed in evaluation of cardiac tumors, evaluation of myocardium (myocarditis, fatty infiltration, hemosiderosis, arrhythmogenic cardiomyopathy) and evaluation of pericardium (pericardial tumor, constrictive pericarditis).
The assessment of myocardial perfusion and viability has been used regularly in adult patients. For children, these assessments are primarily performed in patients with congenital coronary anomalies, Kawasaki disease, and postoperative assessment after arterial switch operation. These can also be useful in patients who have undergone cardiac transplantation as they are at risk of accelerated coronary artery disease and perfusion abnormalities. By using gadolinium enhancement, MRI assesses regional wall perfusion by a “first-pass” technique. Typically, short-axis views of the ventricle are obtained and the MRI sequence is set up such that the heart is imaged relatively motionless. Gadolinium is injected intravenously while the MRI scanner continuously images the ventricle (up to four or five short-axis slices may be imaged at once). The gadolinium bolus is followed from the right ventricular cavity to the left ventricular cavity and eventually to the ventricular myocardium. Defects in perfusion show up as dark portions of the myocardium while the remainder of the ventricle is signal intense. Image acquisition can be repeated after administration of a pharmacologic agent such as adenosine, a coronary vasodilator, to assess perfusion.
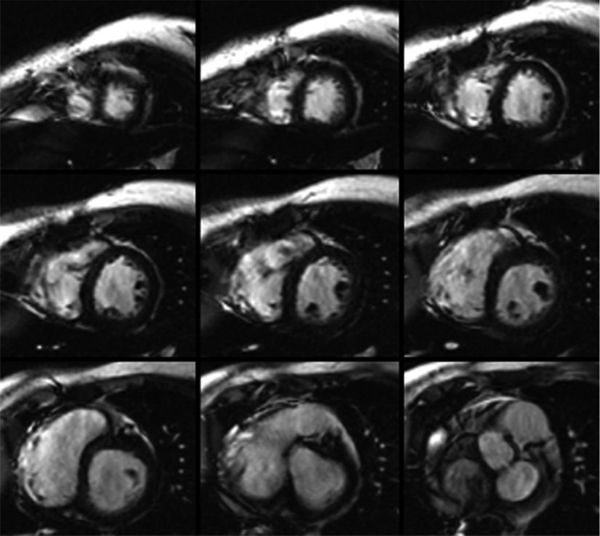
Figure 38.12. Tissue characterization by magnetic resonance imaging. The overall appearance of the myocardium is very dark and tissue characterization of the myocardium using T2* is consistent with iron deposition within the myocardium of this patient with hemochromatosis.
Infarcted or fibrosed myocardium can be identified by a contrast-enhanced technique called delayed enhancement (Fig. 38.13). Gadolinium is avidly taken up by scarred myocardium and remains in scarred tissue for an extended period of time, whereas it is “washed” out by coronary blood flow in normally perfused myocardium. Five to ten minutes after the injection, the infarcted myocardium continues to give signals of high intensity (appears bright), whereas normal myocardium does not. This technique has been demonstrated to accurately delineate the presence, extent, and location of both acute and chronic myocardial infarction. Foreign bodies such as patch materials can also become signal intense with this technique. In addition, various cardiac tumors can take up gadolinium, whereas others will not, and MRI uses this tissue property, along with T1-weighted images, T2-weighted images, and fat saturation to predict the type of tumor present.
Postacquisition Image Processing
For static images, the postacquisition image processing is very similar to CTA images. MPR, CPR, MIP, and 3D reconstructions can be done in a fashion similar to CTA. Additional postprocessing in MRI involves its inherent advantages which include volumetric measurements of the ventricles, and flow measurements on phase contrast imaging (Fig. 38.14).
CLINICAL APPLICATIONS AND CASE EXAMPLES
Shunt Lesions
Atrial and ventricular septal defects and patent ductus arteriosus are common congenital heart defects which may be isolated findings or present in association with other congenital cardiac defects. The importance of identification of these lesions is with respect to their hemodynamic influence which in turn is dependent upon their size, location, compliance of the receiving chamber, and resistance within the systemic and pulmonary circuits. In isolation, these lesions are traditionally interrogated with echocardiographic techniques. If echocardiography does not provide adequate assessment of these lesions either CTA or MRI may be performed as an ancillary noninvasive imaging test. Of these choices, MRI may be better suited because it allows a quantitative evaluation of shunts and determination of shunt fractions. As in any clinical evaluation, the clinical question to be answered is critical when deciding between CTA and MRI as an adjunctive test and when designing the appropriate imaging protocol when the patient presents for the imaging examination.
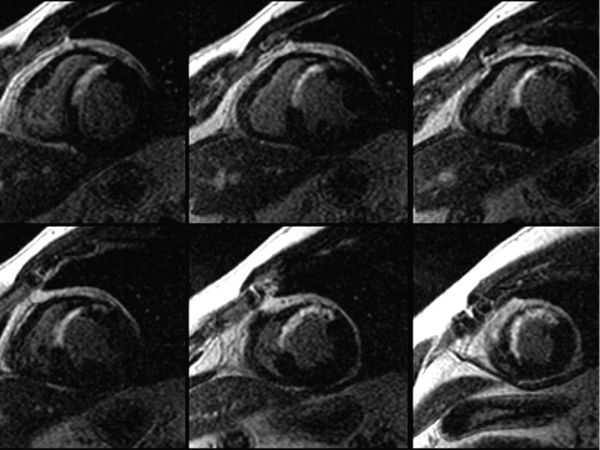
Figure 38.13. Delayed enhancement sequence after gadolinium injection. Abnormal myocardial delayed enhancement involving the anteroseptum and apex in a transmural pattern in a patient presenting with an anteroseptal myocardial infarction.
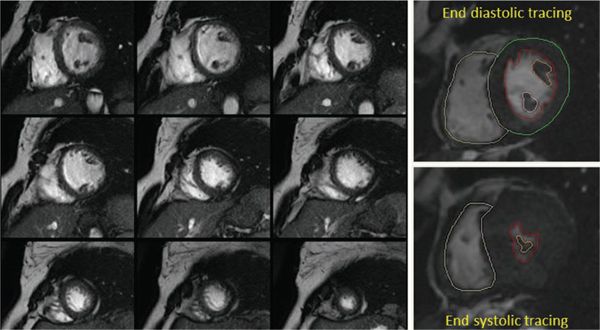
Figure 38.14. Volumetric and functional analysis of the ventricles. A stack of short-axis images is used to trace the blood-myocardial interface during systole and diastole to generate an area. A volume for each section is calculated based on the slice thickness. The sum of all these volumes gives the total end-diastolic and end-systolic volumes for each ventricle. Ventricular mass is also calculated in a similar manner.
Using CTA in the assessment of atrial septal defect (ASD), findings may include anatomic disruption of the interatrial septum (Fig. 38.15), however, smaller defects may be difficult to identify. Other adjunctive findings which are more easily appreciated include enlargement of the right-sided cardiac chambers and pulmonary arterial dilation. The superior spatial resolution allows complete interrogation of the pulmonary venous structures for the assessment of anomalous pulmonary venous return. This is especially important in sinus venosus ASDs which are mostly related to anomalous pulmonary venous connections. Similar to ASDs, ventricular septal defects (VSD) may be identified using ECG-gated cardiac CT, with large VSDs being relatively straightforward in their identification and localization. Smaller VSDs may be more challenging, and their identification is contingent upon careful study of the entire volume of images using multiplanar reformations. With a slice thickness <1 mm, cardiac CTA, with or without ECG gating, can readily identify the presence of a PDA.
Cardiac MRI can be used to complete the assessment of ASDs, VSDs, or a PDA when echocardiography is technically challenging. Imaging can be performed in any plane, which allows complete interrogation of the lesion of interest. The former, however, is predicated on appropriate operator experience. Ventricular volumes, mass, and contractile function can be assessed using SSFP sequences. Shunt volumes, Qp/Qs, valvular function, and pressure gradients may be estimated using velocity encoded phase contrast images. As with CT, vascular structures may be further evaluated using MR angiography when clinically indicated.
Stay updated, free articles. Join our Telegram channel

Full access? Get Clinical Tree


