Calculation of Stenotic Valve Orifice Area
Blase A. Carabello
William Grossman
The normal cardiac valve offers little resistance to blood flow. As valvular stenosis develops, there is progressively more resistance to flow, causing a pressure drop (pressure gradient) across the valve. For any stenotic orifice size, a stronger flow across the orifice yields a higher pressure gradient. Using two fundamental hydraulic formulas, Dr. Richard Gorlin and his father developed a formula for the calculation of cardiac valvular orifices from flow and pressure-gradient data.1 Today, this formula is usually worked out using computerized pressure monitoring systems; but it is still valuable to understand its derivation and characteristics.
THE GORLIN FORMULA
The first hydraulic formula that the Gorlins used was based on Torricelli’s law, which describes flow across a round orifice:
where F is the flow rate, A is the orifice area, V is the velocity of flow, and Cc is the coefficient of orifice contraction. The constant Cc compensates for the physical phenomenon that, except for a perfect orifice, the area of a stream flowing through an orifice will be less than the true area of the orifice.
Rearranging the terms,

The second hydraulic principle used in the derivation of the Gorlin formula relates pressure gradient and velocity of flow according to Torricelli’s law:
where V is the velocity of flow; Cv is the coefficient of velocity, correcting for the energy loss as pressure energy is converted to kinetic or velocity energy; h is the pressure gradient in cm H2O, and g is the gravitational constant (980 cm/second2) for converting cm H2O to units of pressure.
Combining the two equations,

where C is an empirical constant accounting for Cv and Cc, and the expression of h in mmHg (rather than cm H2O), and correcting the calculated valve area to the actual valve area measured at surgery or autopsy.
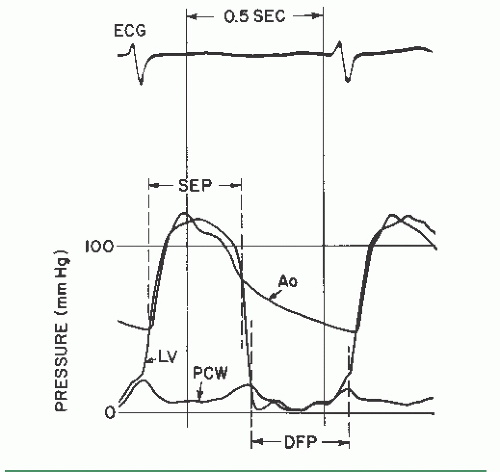
It is obvious that antegrade flow across the mitral and tricuspid valves occurs only in diastole, whereas that across the aortic and pulmonic valves occurs only in systole. Accordingly, the flow, F, in Eq. (13.4) is the total cardiac output expressed in terms of the number of seconds per minute during which there is actually forward flow across the valve. For the mitral and tricuspid valves, this is calculated by multiplying the diastolic filling period (seconds per beat) by the heart rate (beats per minute [bpm]), yielding the number of seconds per minute during which there is diastolic flow. The cardiac output in milliliters per minute (or cm3/minute) is then divided by the number of seconds per minute during which there is flow, yielding diastolic flow in cubic centimeters per second. For the aortic and pulmonic valves, the systolic ejection period is substituted for the diastolic filling period. The manner in which the diastolic filling period and systolic ejection period are measured is shown in Figure 13.1.
The diastolic filling period begins at mitral valve opening
and continues until end-diastole. The systolic ejection period begins with aortic valve opening and proceeds till the dicrotic notch or some other evidence of aortic valve closure.
and continues until end-diastole. The systolic ejection period begins with aortic valve opening and proceeds till the dicrotic notch or some other evidence of aortic valve closure.
Thus the final equation for the calculation of valve orifice area A (in cm2) is

where CO is the cardiac output (cm3/minute), DFP is the diastolic filling period (seconds/beat), SEP is the systolic ejection period (seconds/beat), HR is the heart rate (beats/minute), C is an empirical constant, and P is the pressure gradient. DFP is measured directly from left ventricular (LV) versus pulmonary capillary wedge (PCW) or left atrial pressure tracings as shown in Figure 13.1.
An empirical constant of 0.7 (later adjusted to 0.85) was derived by comparing the calculated and actual mitral valve areas.1,2 With the use of this constant, the maximum deviation of the calculated valve area from the measured valve area was 0.2 cm2. The empirical constant for the aortic, tricuspid and pulmonic valves has never been derived because of lack of data comparing actual with calculated valve areas for these valves; the constant for these valves has been assumed to be 1.0 (i.e., 1.0 × 44.3 = 44.3). Nonetheless, the Gorlin formula remains the gold standard for assessing the severity of stenosis in cardiac valves.
MITRAL VALVE AREA
By rearranging the terms of Eq. (13.5), one sees that for the mitral valve,

where ΔP is the mean transmitral pressure gradient and MVA is the mitral valve area. Thus, by doubling cardiac output one will quadruple the gradient across the valve, if heart rate and diastolic filling period remain constant. The normal mitral orifice in an adult has a cross-sectional area of 4.0 to 5.0 cm2 when the mitral valve is completely open in diastole. Considerable reduction in this orifice area can occur without symptomatic limitation, but when the area is 1.0 cm2 or less, a substantial resting gradient will be present across the mitral valve and any demand for increased cardiac output will be met by increases in left atrial and pulmonary capillary pressure that lead to pulmonary congestion and edema.
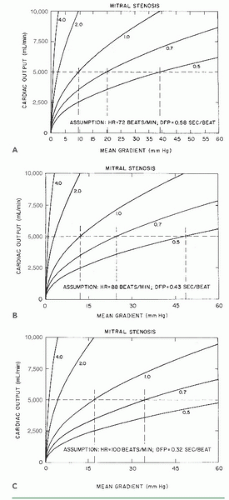
Figure 13.2 demonstrates that a cardiac output of 5 L/minute can be maintained with only a minimal mitral diastolic gradient as the mitral orifice area contracts from its normal 4.0 to 5.0 cm2 to a moderately stenotic area of 2.0 cm2. After that, the gradient rises so that, at an orifice area of 1.0 cm2, a resting gradient of 8 to 10 mmHg is required to maintain the cardiac output at 5 L/minute with a normal resting heart rate of 72 bpm (Figure 13.2A). Note that even at this level of cardiac output, substantial increases in gradient may occur in response to tachycardia (Figure 13.2B, C), which reduces the total time per minute available for diastolic filling. Thus, 1.0 cm2 is generally viewed as the critical mitral valve area because even small increases in cardiac output lead to pulmonary congestion and severe dyspnea. However, some allowance needs to be made for the patient’s size in assessing critical valve area. Larger patients need stronger flows than needed by smaller patients to maintain tissue perfusion, and they also have higher gradients because of higher cardiac output for any given valve orifice area. Thus 1.2 cm2 could be a critical mitral valve area for a large patient. Currently, no uniform agreement exists on indexing critical valve area to body size.
Example of Valve Area Calculation in Mitral Stenosis
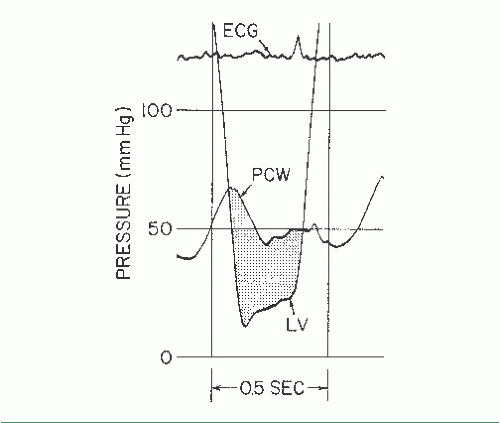
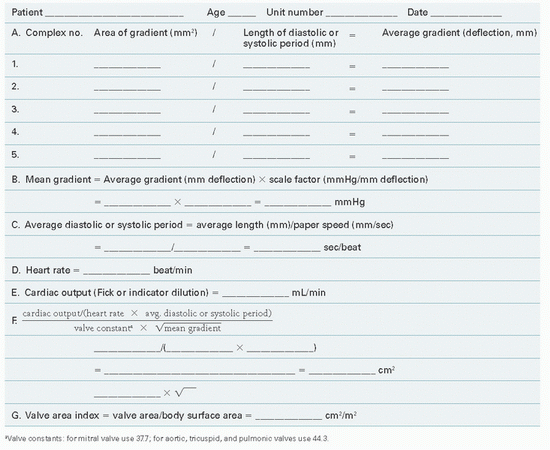
Figure 13.3 shows PCW and LV pressure tracings in a 40-year-old woman with rheumatic heart disease and severe mitral stenosis. This woman also had hypertension and significant elevation of her LV diastolic pressure. The valve orifice area is calculated with the aid of a form reproduced as Table 13.1. In this patient, five beats were chosen from the recordings taken closest in time to the Fick cardiac output determination. Planimetry of the area between PCW and LV pressure tracings (Figure 13.3) was done for these five beats, and these areas were divided by the length of the diastolic
filling periods for each beat, giving an average gradient deflection in millimeters. The mean gradient in millimeters of mercury (Table 13.1, part B) was calculated as the average gradient deflection in millimeters multiplied by the scale factor (mmHg/mm deflection). In this case, the mean gradient was 30 mmHg. Next, the average diastolic filling period was calculated (Table 13.1, part C) using the average measured length between initial PCW-LV crossover in early diastole and end-diastole (peak of the R wave by ECG). This average length in millimeters was divided by the paper speed (mm/second) to give the average diastolic filling period, which in this case was 0.40 second. Heart rate and cardiac output (Table 13.1, parts D and E) are recorded, ideally from data collected simultaneously with the recording of the PCW-LV pressure gradient. Heart rate was 80 bpm and cardiac output was 4,680 cm3/minute in the case illustrated in Figure 13.3. It should be noted that cardiac output must be expressed in cubic centimeters per minute if valve area is expressed in square centimeters of cross-sectional area.
filling periods for each beat, giving an average gradient deflection in millimeters. The mean gradient in millimeters of mercury (Table 13.1, part B) was calculated as the average gradient deflection in millimeters multiplied by the scale factor (mmHg/mm deflection). In this case, the mean gradient was 30 mmHg. Next, the average diastolic filling period was calculated (Table 13.1, part C) using the average measured length between initial PCW-LV crossover in early diastole and end-diastole (peak of the R wave by ECG). This average length in millimeters was divided by the paper speed (mm/second) to give the average diastolic filling period, which in this case was 0.40 second. Heart rate and cardiac output (Table 13.1, parts D and E) are recorded, ideally from data collected simultaneously with the recording of the PCW-LV pressure gradient. Heart rate was 80 bpm and cardiac output was 4,680 cm3/minute in the case illustrated in Figure 13.3. It should be noted that cardiac output must be expressed in cubic centimeters per minute if valve area is expressed in square centimeters of cross-sectional area.
 Figure 13.2 Relationship between cardiac output and mean diastolic pressure gradient in patients with mitral stenosis, calculated using Eq. (13.6), derived from the Gorlin formula. Curves represent orifice areas of 4.0, 2.0, 1.0, 0.7, and 0.5 cm2. A to C. Flow-gradient relations at differing heart rates and diastolic filling periods (see text for discussion). (Courtesy of Dr. James J. Ferguson III.) |
Entering these values in the formula given in Table 13.1, part F, and using a constant of 0.85(44.3) = 37.7 for the mitral valve, we get

Because the accuracy of the method to hundredths of a square centimeter has not been demonstrated, the resulting valve area is rounded off and expressed as 0.7 cm2.
Table 13.1 Valve Orifice Area Determination | |
|---|---|
|
Pitfalls
Pulmonary Capillary Wedge Tracing
In most cases, PCW pressure is substituted for left atrial pressure under the assumption that a properly confirmed wedge pressure accurately reflects left atrial pressure. Nishimura et al.3 found that transmitral gradient was overestimated by 3.3 to 3.5 mmHg when a Swan-Ganz catheter was used to measure the wedge pressure in comparison with actual left atrial pressure. However, these “wedge” pressures were not confirmed as true wedge pressures, using the techniques described in Chapter 6. Conversely, Lange et al.4 measured left atrial pressure directly (trans-septal) and compared it with oximetrically confirmed wedge pressure obtained using a stiff woven Dacron catheter. In this study, overestimation of true left atrial pressure was only 1.7 ± 0.6 mmHg. Hence we and others believe that the weight of evidence5 and our own experience support the use of PCW pressure as a satisfactory substitution for left atrial pressure, except in some patients with pulmonary veno-occlusive disease or cor triatriatum. Failure to wedge the catheter properly may, however, cause one to compare a damped pulmonary artery pressure with the LV pressure, yielding a falsely high gradient. To ensure that the right heart catheter is properly wedged, one should verify that
1. The mean wedge pressure is lower than the mean pulmonary artery pressure
2. Blood withdrawn from the wedged catheter is ≥95% saturated with oxygen, or at least equal in oxygen saturation to arterial blood.
Alignment Mismatch
Alignment of the PCW and LV pressure tracings does not match alignment of simultaneous left atrial and LV tracings because there is a time delay in the transmission of the left atrial pressure signal back through the pulmonary venous and capillary beds. The resulting pressure mismatch is small when PCW pressure is measured in the distal pulmonary arteries using a 7F or 8F Cournand or Goodale-Lubin catheter, but may be larger when wedge pressure is measured more proximally in the pulmonary arterial tree using a balloon-tipped flow-directed catheter. The A and V waves in an optimally damped PCW tracing are delayed typically by 50 to 70 milliseconds as compared with a simultaneous left atrial pressure tracing. Thus, ideally, the wedge pressure should be realigned with the LV pressure (using tracing paper) by shifting it leftward by 50 to 70 milliseconds.
The V wave, which is normally present in the left atrium (where it represents pulmonary venous return), peaks immediately before the downstroke of the LV pressure tracing. With a wedge pressure measured distally using a 7F Goodale-Lubin catheter (Figure 13.3), the peak of the V wave is bisected by the rapid downstroke of LV pressure decline. Realignment of the wedge tracing in such a way that the V wave peak is bisected by (or slightly to the left of) the downstroke of LV pressure is a practical method for achieving better physiologic realignment.
Calibration Errors
Failure to calibrate the pressure transducers properly and adjust them to the same zero reference point may yield an erroneous gradient. A quick way to check the validity of an unexpected transmitral pressure gradient is to switch the left and right heart catheters to the opposite transducers, which if calibrated correctly will yield the same gradient.
Cardiac Output Determination
Cardiac output must be determined accurately using the techniques described in Chapter 11. The cardiac output used in valve area calculation should be the value measured simultaneously with the gradient determination. The measurement used in the valve area formula is usually the forward cardiac output determined by the Fick method or the thermodilution method. If mitral valvular regurgitation exists, the gradient across the valve will reflect not only the net forward flow but forward plus regurgitant or total transmitral diastolic flow. Therefore, using only the net forward flow to calculate the valve orifice area will underestimate the actual anatomic valve area in cases where regurgitation coexists with stenosis. It is worth noting that many patients with mitral stenosis have coexistent tricuspid regurgitation. As indicated in Chapter 11, tricuspid regurgitation may cause the thermodilution technique for measuring cardiac output to be inaccurate.
Early Diastasis
Even when left atrial and LV pressures equalize (diastasis) before the end of diastole, there will generally still be a flow through the mitral valve after the point of diastasis. The diastolic filling period to be used in valve area calculation should include all of nonisovolumic diastole, not just the period during which a gradient is present.
AORTIC VALVE AREA
An aortic valve area of 0.7 cm2 or less is generally considered severe enough to account for the symptoms of angina, syncope, or heart failure in a patient with aortic stenosis. Because the development of symptoms in patients with aortic stenosis portends an abrupt worsening of prognosis, this valve area is termed critical. However, it must be pointed out that no unique critical valve area has been established and that even an aortic valve area as large as 1.0 cm2 can cause symptoms and thus be critical, especially in a large individual. Conversely, smaller calculated valve orifice areas in a totally asymptomatic patient may not be critical. For this reason the AHA/ACC Guidelines for the Management of Patients with Valvular Heart Disease avoided the use of the word “critical.”6 Instead, they define “severe” as an AVA of ≤1.0 cm2, recognizing that one can define “severe,” without defining “critical”. Figure 13.4 illustrates the relationship between cardiac output and aortic pressure gradient over a range of values of aortic valve area and at three different values of heart rate and systolic ejection period. For the aortic valve, Eq. (13.4) can be rearranged as

As can be seen in Figure 13.4A, at a normal resting cardiac output of 5.0 L/minute, an aortic orifice area of 0.7 cm2 will result in a pressure gradient of approximately 33 mmHg across the aortic valve. Doubling of the cardiac output, as might occur with exercise, would increase the gradient by a factor of 4 to 132 mmHg if the systolic time per minute did not change. This increase in gradient would require a peak LV pressure in excess of 250 mmHg to maintain a central aortic pressure of 120 mmHg. Such a major increase in LV pressure obviously increases myocardial oxygen demand and limits ejection performance. These factors contribute to the symptoms of angina and congestive heart failure, respectively.7,8 The limitations in cardiac output imposed by high afterload may contribute to hypotension when peripheral vasodilation occurs during muscular exercise.
Stay updated, free articles. Join our Telegram channel

Full access? Get Clinical Tree


