Fig. 19.1
After conduction begins at the sinoatrial node, cells in the atria begin to depolarize. This creates an electrical wavefront that moves down toward the ventricles, with polarized cells at the front, followed by depolarized cells behind. The separation of charge results in a dipole across the heart (with the large black arrow showing its direction). Modified from Mohrman and Heller (2003). SA = sinoatrial
It is important to note that, because the surface ECG is measured from the skin, any potential differences within the body will have an effect on the resultant electrical fields that are being detected. This is why it is important, for diagnostic purposes, that patients remain as still as possible while recording an ECG. Movements from skeletal muscle activation (electromyograms, EMGs) will contribute to the changes in voltage detected using electrodes on the surface of the body. A resting ECG is recorded when the patient is essentially motionless; this type of ECG signal is discussed in the majority of this chapter) .
19.2 ECG Devices
The invention of electrocardiography had an immeasurable impact on the field of cardiology. It has provided insights into the structure and function of healthy and diseased hearts. Thus, the ECG has evolved into a powerful diagnostic tool for heart disease, including the detection of arrhythmias, myocardial infarction, and/or hypertrophy, among others. The use of ECG has become a standard of care in cardiology, and new technological advances are continually being made.
19.3 History of the ECG
The discovery of intrinsic electrical activity within the heart can be traced back to as early as the 1840s. In 1842, the Italian physicist Carlo Matteucci first reported that an electrical current accompanies each heartbeat. Soon after, the German physiologist, Emil DuBois-Reymond, described the first action potential that accompanies muscle contraction. Rudolph von Koelliker and Heinrich Miller recorded the first cardiac action potential using a galvanometer in 1856. Subsequently, the invention of the capillary electrometer in the early 1870s by Gabriel Lippmann led to the first recording of a human ECG by Augustus D. Waller.
The capillary electrometer is a thin glass tube containing a column of mercury that sits above sulfuric acid. With varying electrical potentials, the mercury meniscus moves and this can be observed through a microscope. Using this capillary electrometer, Waller was the first to show that the electrical activity precedes the mechanical contraction of the heart. He was also the first to show that the electrical activity of the heart can be seen by applying electrodes to both hands or to one hand and one foot. Waller’s work was the first description of “limb leads.” Interestingly, Waller would often publicly demonstrate his experiments with his dog, Jimmy, who would stand in jars of saline during the recording of the ECG.
A major breakthrough in cardiac electrocardiography came with the invention of the string galvanometer by Willem Einthoven in 1901. He reported the first ECG using his string galvanometer the following year. Einthoven’s string galvanometer consisted of a massive electromagnet with a thin silver-coated string stretched across it; electric currents that passed through the string would cause it to move from side to side in the magnetic field generated by the electromagnet. The oscillations in the string would provide information regarding the strength and direction of the electrical current. The deflections of the string were then magnified using a projecting microscope and were recorded on a moving photographic plate (Fig. 19.2). Years earlier, utilizing recordings from a capillary electrometer, Einthoven was also the first to label the deflections of the heart’s electrical activity as P, Q, R, S, and T waveforms.
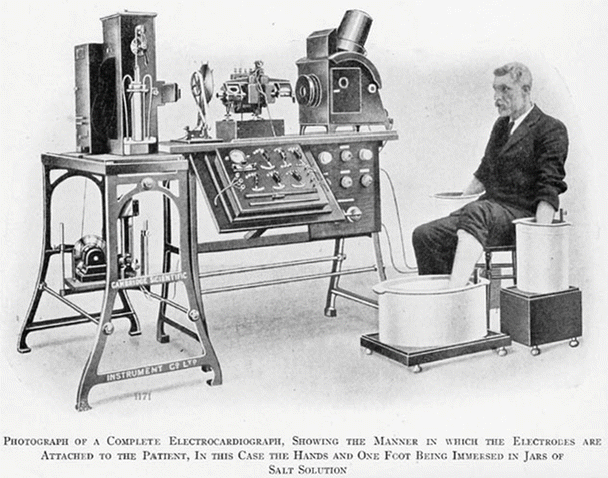

Fig. 19.2
Willem Einthoven’s string galvanometer consisted of a massive electromagnet with a thin silver-coated string stretched across it. Electric currents passing through the string caused it to move from side to side in the magnetic field generated by the electromagnet. The oscillations in the string provided information on the strength and direction of the electrical current. The deflections of the string were then magnified using a projecting microscope and recorded on a moving photographic plate. Reprinted with permission from NASPE-Heart Rhythm Society History Project
In 1912, Einthoven made another major contribution to the field of cardiac electrophysiology by deriving a mathematical relationship between the direction and size of the deflections recorded by the three limb leads. This hypothesis became known as Einthoven’s triangle . The standard three limb leads were used for three decades before Frank Wilson described unipolar leads and the precordial lead configuration. The 12-lead ECG configuration used today consists of the standard limb leads of Einthoven and the precordial and unipolar limb leads based on Wilson’s work (see the following discussion for details on these recordings).
Following Einthoven’s invention of the string galvanometer, electrocardiography quickly became a research tool for both physiologists and cardiologists. Much of the current knowledge involving arrhythmias was obtained through recording ECGs. In 1906, Einthoven published the first results of ECG tracings of atrial fibrillation, atrial flutter, ventricular premature contractions, ventricular bigeminy, atrial enlargement, and induced heart block within a dog. Einthoven was awarded the Nobel Prize for his body of work and inventions in 1924.
During this same era, Thomas Lewis was one of the pioneering cardiologists who utilized the capabilities of the ECG to further scientific knowledge of arrhythmias. His findings were summarized in his books The Mechanism of the Heart Beat and Clinical Disorders of the Heart Beat published in 1911 and 1912, respectively. He also published over 100 research papers describing his work. Importantly, Lewis was also the first to use the terms: sinoatrial node, pacemaker, premature contractions, paroxysmal tachycardia, and atrial fibrillation.
Myocardial infarction and angina pectoris were also extensively studied with ECG, using the early string galvanometer device. Numerous clinical investigators further studied the changes within ECG signals that were associated with the onset of myocardial infarction in both animals and humans. By the 1930s, characteristic features of the ECG for the diagnostic indications of myocardial infarction had been identified, and later on, the connection between angina pectoris and coronary occlusion was made. Further, while studying electrocardiographic changes accompanying angina pectoris, Francis Wood and Charles Wolferth performed the first exercise electrocardiographic stress test. Their use of exercise during ECG analyses stemmed from the observation that many of their patients experienced angina only during physical exertion. During this period, this technique was not routinely used, since it was thought to be very dangerous. Nevertheless, with advances in protocols and technologies, the ECG emerged as an important and commonly employed diagnostic tool for physicians.
ECG equipment has come a long way since Einthoven’s string galvanometer. Of interest, the Cambridge Scientific Instrument Company in London was the first to manufacture this instrument back in 1905; it was massive, weighing in at 600 pounds. A telephone cable was used to transmit electrical signals from a hospital over a mile away to Einthoven’s laboratory. A few years later, Max Edelman of Cambridge Scientific Instrument Company manufactured a smaller version of the instrument (Fig. 19.3). However, it wasn’t until the 1920s that bedside machines became available. A few years later, a “portable” version was manufactured in which the instrument was contained in two wooden cases, each weighing close to 50 pounds. In 1935, the Sanborn Company manufactured an even smaller version of the unit that only weighed about 25 pounds.
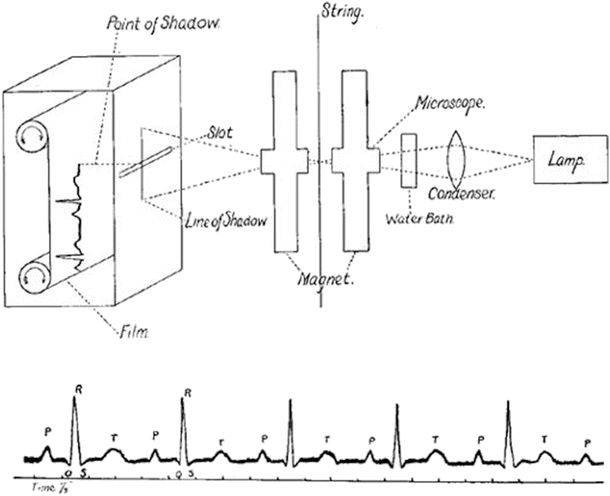

Fig. 19.3
A diagram of Cambridge Scientific Instrument Company’s smaller version of the string galvanometer. Reprinted with permission from NASPE-Heart Rhythm Society History Project
Interestingly, the use of ECG in a nonclinical setting became possible in 1949, with Norman Jeff Holter’s invention of the Holter monitor . The first version of this instrument was a 75-pound backpack that could continuously record the ECG and transmit these signals via radio. Subsequent versions of such systems have been dramatically reduced in size and now use a digital recording of the signal. Today, miniaturized systems (Fig. 19.4) allow patients to be monitored over longer periods of time (usually 24 h) to help diagnose any problems with rhythm or ischemic heart disease .
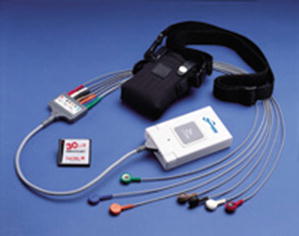

Fig. 19.4
A version of the Holter monitor that is used currently. The one seen here is manufactured by Medical Solutions, Inc. (Maple Grove, MN, USA)
19.4 The ECG Waveform
As an ECG is recorded, signals of voltage versus time are produced, which are normally displayed in millivolts (mV) versus seconds. A typical Lead II ECG waveform is shown in Fig. 19.5. For this recording, the negative electrode was placed on the right wrist and the positive electrode placed on the left ankle, a standard Lead II ECG. As such, one can observe a series of peaks and waves that correspond to ventricular or atrial depolarization and repolarization, with each segment of the signal representing a different event within the cardiac cycle.
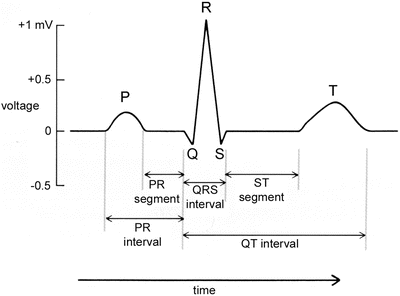

Fig. 19.5
A typical ECG waveform for one cardiac cycle, measured from the Lead II position. The P-wave denotes atrial depolarization and the QRS ventricular depolarization, and the T-wave denotes ventricular repolarization. The events on the waveform occur on a scale of hundreds of milliseconds. Modified from Mohrman and Heller (2003)
The normal cardiac cycle begins with the firing of the sinoatrial node, located within the right atrium. This initial firing is not detected by a typical ECG, because the sinoatrial node is not composed of an adequately large quantity of cells to create a detectable electrical potential, i.e., a signal with an amplitude high enough to be recorded with distal electrodes. The depolarization of the sinoatrial node is then conducted rapidly throughout the right and left atria, giving rise to the P-wave; this represents the depolarization of both atria and the onset of atrial contraction, and the P-wave is normally around 80–100 milliseconds (ms) in duration. As the P-wave ends, the atria are thus depolarized and this relates to their contraction. The signal then returns to baseline while action potentials (not large enough to be detected) spread through the atrioventricular node and bundle of His. Then, roughly 200 ms after the beginning of the P-wave, the right and left ventricles begin to depolarize resulting in the recordable QRS complex, which is approximately 100 ms in duration. The first negative deflection (if present) is the Q-wave, the large positive deflection is the R-wave, and if there is a negative deflection after the R-wave, it is called the S-wave. As the QRS complex ends, the ventricles are completely depolarized and are contracting. Importantly, the exact shape of the QRS complex depends on the placement of electrodes from which the signals are recorded.
Simultaneous with the QRS complex, atrial contractions have ended and the atria are repolarizing. However, it is important to note that the effects of this global atrial repolarization are sufficiently masked by the much larger amount of tissue involved in ventricular depolarization, and thus, it is not normally detected in the ECG. Toward the end of ventricular contraction, the ECG signal returns to baseline. The ventricles repolarize after contraction, giving rise to the T-wave. The T-wave is normally the last detected potential in the cardiac cycle; thus, it is followed by the P-wave of the next cycle, repeating the process.
It is clear that the QRS complex has a much higher and shorter duration peak than either the P- or T-waves. This is due to the fact that ventricular depolarization simultaneously occurs over a greater mass of cardiac tissue (i.e., a greater number of myocytes depolarizing at nearly the same time). Ventricular depolarization is much more synchronized than either atrial depolarization or ventricular repolarization. For additional details relative to the types of action potential that occur in various regions of the heart, the reader is referred to Chap. 13. It is important to note that deflections in the ECG waveforms represent the changes only in electrical activity and have different time courses of generalized cardiac contraction or relaxation which take place on a slightly longer time scale. Figure 19.6 details certain points on the ECG waveform and how they relate to other events in the heart during the cardiac cycle.
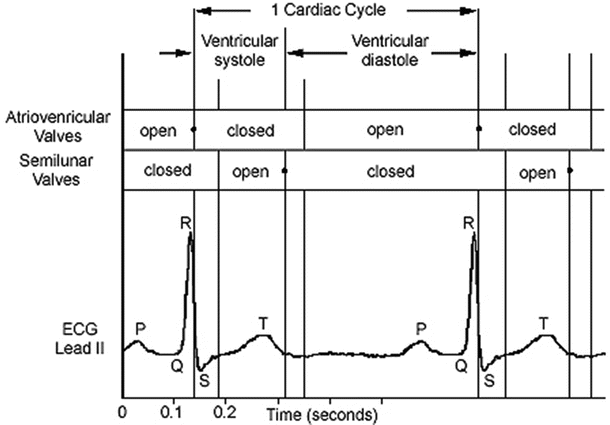

Fig. 19.6
A typical Lead II ECG waveform is compared to the timing of atrioventricular and semilunar valve activity, along with which segments of the cardiac cycle the ventricles are in systole/diastole. ECG = electrocardiogram
Lastly, the recorded ECG waveforms in some individuals may elicit a potential referred to as the U-wave. Its presence is not fully understood, but is considered by some to be caused by late repolarizations within the vast Purkinje system. If detected, the U-wave will be toward the end of the T-wave and have the same polarity (positive deflection). However, it typically has a much shorter amplitude and ascends more rapidly than it descends (which is the opposite of the T-wave) .
19.5 Measuring an ECG
The ECG is typically measured from electrodes placed on the surface of the skin; this can be done by placing a pair of electrodes directly on the skin and then monitoring the potential difference between them, as these electrical signals are transmitted throughout the body. The detected waveform features depend not only on the amount of cardiac tissue involved but also the relative orientation of the electrodes, i.e., with respect to the major dipoles in the heart. Recall that ECG waveforms will look different when measured from different electrode positions, and typically an ECG investigation is obtained using a number of different electrode locations (e.g., limb leads or precordial) or configurations (unipolar, bipolar, modified bipolar) which have been standardized by universal applications of certain conventions.
19.5.1 Bipolar Limb Leads
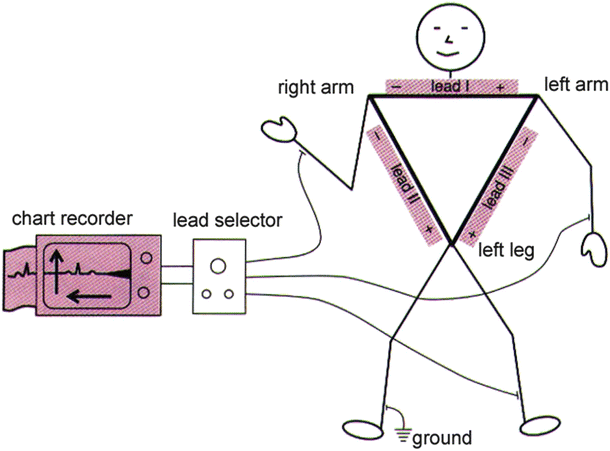
Today, the three most commonly employed lead positions are referred to as Leads I, II, and III. Imagine the torso of the body as an equilateral triangle as illustrated in Fig. 19.7. This forms what is known as Einthoven’s triangle (named for the Dutch scientist who first described it). Electrodes are placed at each of the vertices of the triangle, and three ECG traces (either Lead I, II, or III) are measured along the corresponding sides of this triangle using the electrodes at each end. Because each lead uses one electrode on either side of the heart, Leads I, II, and III are also referred as the bipolar leads. The positive and negative signs shown in Fig. 19.7 indicate the polarity of each lead measurement, which are viewed as the universal convention. The vertices of the triangle can be considered to be at the wrists and left ankle for electrode placement, as well as the shoulders and lower torso.
 < div class='tao-gold-member'>


Only gold members can continue reading. Log In or Register to continue
Stay updated, free articles. Join our Telegram channel

Full access? Get Clinical Tree


