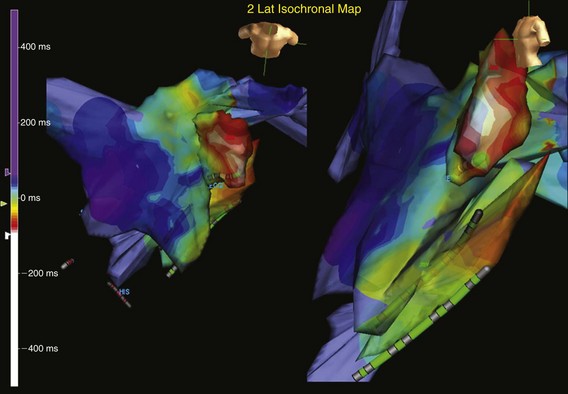
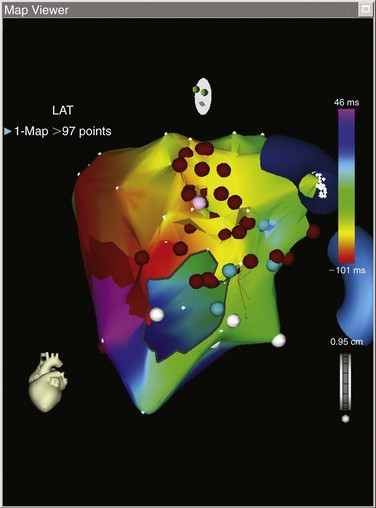
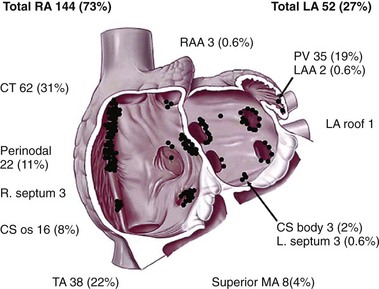
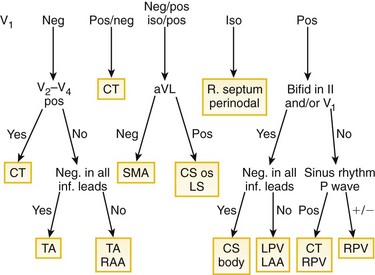
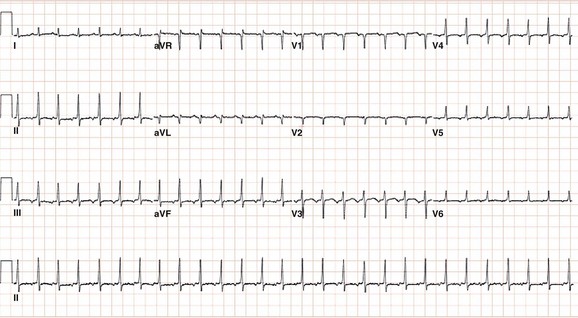
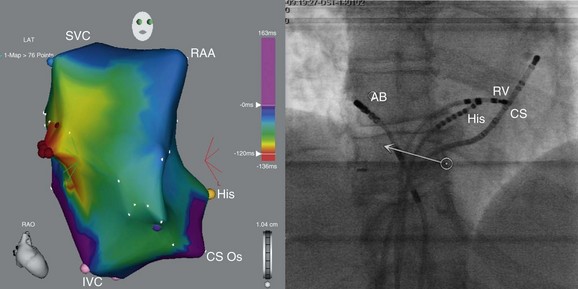
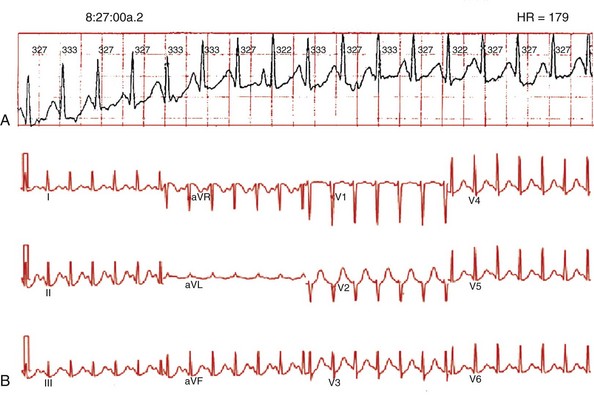
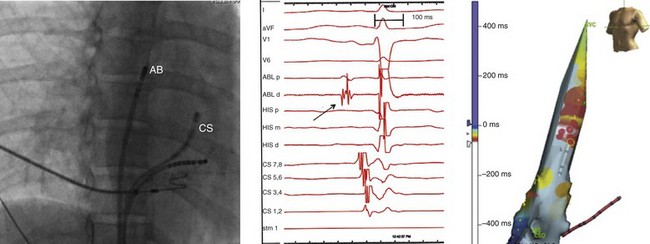
73 Atrial tachycardias (ATs) are regular atrial rhythms at a constant rate ≥100 beats/min that originate outside the sinus node region and do not require participation of the atrioventricular node for maintenance of the arrhythmia.1 Atrial tachycardias constitute a major cause of supraventricular tachycardias. Although sustained AT occurs relatively infrequently, bursts of nonsustained AT are commonly observed on Holter or telemetry recordings. The mechanism of AT can be focal or macroreentrant. Over the last two decades, significant advances in our understanding of ATs have occurred. The use of advanced mapping tools and catheter ablation has enabled detailed assessment of the substrate and characteristic anatomic locations of ATs. This chapter reviews information about the classification, mechanisms, electrocardiographic localization, and electrophysiological characterization of ATs. An expert consensus group from the European Society of Cardiology and the North American Society of Pacing and Electrophysiology published a classification of atrial flutter and regular ATs based on mechanism and anatomy.1 Atrial tachycardias were classified as tachycardias with a regular atrial rate arising from the atrium and were further categorized as either focal or macroreentrant. Focal AT can be caused by automatic, triggered, or microreentrant mechanisms. Focal ATs are characterized by radial, circular, or centrifugal spread of activation from a single focus or point source and lack of electrical activation spanning the tachycardia cycle length. Macroreentrant ATs are due to reentry through relatively large, potentially well-characterized circuits. Macroreentrant ATs are characterized by a repetitive pattern of electrical activation encompassing the entire cardiac cycle. Patterns that have been described include a single loop (such as common isthmus-dependent flutter), two reentrant loops creating a figure of eight, and reentry through narrow channels adjacent to scars or natural anatomic barriers, such as the tricuspid or mitral annulus. Typical atrial flutter, lower loop reentry, double loop reentry, left atrial macro-reentrant AT, scar AT, reverse typical atrial flutter, and right atrial free-wall macro-reentry all are classified as macro-reentrant ATs. Atrial tachycardias occurring in the setting of congenital heart disease are described in Chapter 78, and those occurring after atrial fibrillation ablation in Chapter 123. Atrial tachycardias occurring after atrial fibrillation ablation may be extremely complex, involving multiple loops, and often are related to gaps in previously created ablation lines. A new technique has been proposed to differentiate between focal and macroreentrant ATs based on the surface electrocardiogram (ECG).2 Using non-invasive methodologies that did not require mapping in the electrophysiology laboratory, the study investigators analyzed quantitative ECG metrics with computerized signal-averaging techniques. A short atrial activation time relative to the tachycardia cycle length was used to differentiate focal from macroreentrant ATs based on the principle that macroreentrant ATs have activation throughout the cycle length in contrast to focal ATs. The investigators were able to develop algorithms to quantify P or F wave duration with overlying T waves by transitions in slope relative to the expected T waves generated from scaling of the sinus rate T wave. Electrocardiographic P wave duration correlated with the duration of intraatrial activation. Focal ATs had shorter P wave durations and smaller ratios of P wave to cycle length. P waves less than 160 ms and P wave to cycle length ratios less than 45% differentiated focal AT from macroreentry with promising accuracy in patients who subsequently underwent invasive catheter mapping and ablation.2 Sustained, focal ATs in patients who are in an electrophysiology laboratory for mapping and catheter ablation almost always arise in the absence of significant, preexisting structural heart disease. In one large series, among 345 patients with focal AT who underwent radiofrequency ablation only 4% of patients (n = 14) had preexisting structural heart disease.3 Notably, however, incessant or frequent paroxysmal tachycardia can produce a tachycardia-mediated cardiomyopathy. In this series, approximately 10% of patients with focal AT developed a tachycardia-mediated cardiomyopathy.3 A slower incessant tachycardia was more frequently complicated by cardiomyopathy, and appendage sites were associated with a higher incidence of incessant tachycardia (84%) and LV dysfunction (42%). Virtually all patients had restoration of normal LV function after successful ablation at a mean of 3 months. Atrial arrhythmias frequently complicate heart failure and atrial enlargement. In an experimental model, Stambler et al.4,5 demonstrated that heart failure induced by rapid ventricular pacing provides a substrate that predisposes to focal ATs. Sustained ATs could be induced in greater than 90% of animals after an average of 3 weeks of heart failure, but in less than 10% at baseline in the absence of heart failure. The mode of AT induction, responses to pacing maneuvers and Ca2+ antagonists, and the presence of delayed afterdepolarizations suggested triggered activity, resulting from intracellular Ca2+ overload, as the likely tachycardia mechanism. Strikingly similar to the anatomic distribution of focal ATs in humans, mapping and ablation studies in this heart failure model indicated that the ATs had a focal origin with sites of earliest activation located predominately along the crista terminalis (CT) and within or near the pulmonary veins (PVs). Rapid, left AT generating atrial fibrillation was localized and ablated inside the pulmonary vein in this model. The autonomic nervous system likely has a critical role in initiating or triggering some ATs. Reports of AT triggered by changes in posture, belching, swallowing, as well as termination of tachycardia by the Valsalva maneuver, edrophonium, or β-adrenergic blockers, support a probable role of the autonomic nervous system in some patients. A close association between autonomic nervous system activity and paroxysmal atrial arrhythmias in animal models has been documented. In dogs with pacing-induced heart failure, spontaneous paroxysmal ATs are triggered by simultaneous sympathovagal discharges.6 Likewise in a canine model of intermittent rapid left atrial pacing, autonomic nerve discharge was shown to be an invariable trigger of paroxysmal atrial tachyarrhythmias.7 All spontaneous, AT and atrial fibrillation episodes were preceded (<5 seconds) by superior left ganglionated plexi nerve activity. An interaction between respiration and supraventricular arrhythmias has been described in rare cases demonstrating bursts of atrial ectopic beats that emerge after the start of inspiration and cease during expiration. A recent report described in detail, respiratory cycle–dependent ATs.8 Among 71 nonreentrant focal ATs in 60 patients, 9 respiratory cycle–dependent ATs (13%) were seen in 7 patients (12%). The arrhythmias were incessant, had irregular tachycardia cycle lengths, and emerged in synchrony with respiratory cycles. The P-wave morphology was positive or biphasic in V1 and positive in I and II. Electroanatomical mapping demonstrated the earliest site located around the RSPV or inside the SVC, and radiofrequency ablation was effective in eliminating these ATs. Chen et al.9 classified ATs in 36 patients into one of three categories based on the following groups of findings. The effects of adenosine on AT have been studied extensively by Markowitz et al.,10 who examined the mechanism-specific effects of adenosine on 85 ATs in 82 patients. In response to adenosine, termination occurred in 67 cases (84%), two patients exhibited a nonspecific response, and six were insensitive (8%). Adenosine-sensitive ATs arose from a wide distribution of sites in both atria. These sites included the tricuspid annulus (n = 45), mitral annulus (n = 8), CT (n = 15), and other sites (posteroseptal right atrium, atrial appendage, and interatrial septum). Adenosine-insensitive ATs arose near the pulmonary veins and in the right atrium. In contrast to the study by Chen et al.9, Markowitz et al.10 provided evidence that adenosine-insensitive focal ATs are caused by microreentry.11 Electrograms at the site of origin of adenosine-insensitive AT typically were highly fractionated and had longer durations and lower amplitudes compared with ATs that were terminated or transiently suppressed by adenosine. Similar observations were made by De Groot and Schalij,12 who showed that the site of origin of focal ATs was characterized by double potentials and fractionated and low-voltage, long-duration electrograms—findings attributed to poor cell-to-cell coupling.12 Chiale et al.13,14 described the behavior and pharmacologic responses of a group of rate-related, repetitive uniform, focal ATs that were highly sensitive to intravenous lidocaine. These arrhythmias appear to be rare, show a variable response to intravenous adenosine and verapamil, and are neither consistently induced nor terminated by programmed premature atrial stimulation, suggesting a nonreentrant mechanism. These authors speculated that delayed afterdepolarizations could have a determining role in these ATs. Evaluation of studies, such as those noted here, that have attempted to categorize the mechanism of focal AT based on their responses to pacing and pharmacologic maneuvers in the clinical electrophysiology laboratory is difficult, as most have included small, heterogeneous populations and patients with a variety of ATs. Thus, given the lack of definitive criteria to identify the mechanism of focal AT in the electrophysiology laboratory, these studies remain largely descriptive. A major limitation to an approach for identifying the electrophysiological mechanism of focal AT based on responses to drugs is that there is important overlap in the electrophysiological and pharmacologic characterization of mechanisms. For example, adenosine-sensitivity can be highly useful and specific for distinguishing focal from macroreentrant ATs, but it is less helpful in definitively identifying the electrophysiological mechanism of a focal AT. Whereas triggered ATs are usually terminated by adenosine and verapamil, the use of these pharmacologic agents to differentiate AT mechanisms has produced some inconsistent and variable results.15,16 For example, some studies suggest that verapamil and adenosine both terminate ATs caused by microreentry and triggered activity, whereas others suggest that adenosine-insensitive focal ATs are caused by microreentry.9,10 In addition, adenosine administration can result in tachycardia termination by nonspecific effects via induction of atrial extrasystoles. Thus, pharmacologic interventions might not be a reliable means to identify AT mechanism. Extensive activation sequence mapping is typically used in the electrophysiology laboratory to define the presumptive mechanism of AT and plan an ablation strategy. Technologies for mapping arrhythmias include basket mapping, electroanatomic mapping, and noncontact mapping systems. The mapping technologies have definite advantages over point-by-point catheter mapping, including the ability to map unstable, poorly reproducible, and nonsustained arrhythmias. With these technologies, short episodes of arrhythmias can be mapped with one or several beats, or the arrhythmia substrate can be mapped for areas of low voltage or double potentials. Many series describing the use of each of these new technologies to map and ablate ATs have been reported.17,18 These technologies typically are accompanied by decreased fluoroscopic exposure for the operator, more precise localization of tachycardia, and a better appreciation of atrial anatomy. In one study, electroanatomic mapping (CARTO; Biosense, Webster, California) of the right atrium was performed during 13 tachycardia episodes in 10 patients who had previous cardiac surgery.19 Focal ATs were defined in three patients, and macroreentrant circuits were found in seven patients. The mapping system allowed rapid distinction between a focal AT and a macroreentrant mechanism. In the patients with focal mechanisms, a radial spread of activation was noted from the site of earliest activation in all directions on an isochronal map (Figure 73-1). The right atrial activation time was markedly shorter than the tachycardia cycle length, accounting for, an average of 14% of the tachycardia cycle length. In patients with a macroreentrant mechanism, isochronal maps showed a continuous progression of activation around the right or left atrium, with close proximity of earliest and latest local activation (Figure 73-2). The right atrial activation time was in a range similar to that of tachycardia cycle length, occupying 70% or more of the tachycardia cycle length. Figure 73-1 Computerized electroanatomic mapping from a patient with a focal atrial tachycardia arising from the epicardial surface of the left atrial appendage. Structural heart disease is absent, but the patient has an incessant tachycardia. The site of origin is focal, with rapid radial spread of atrial activation from the earliest site of activation. Figure 73-2 Left atrial electroanatomic map of a macroreentrant atrial tachycardia. This electroanatomic map shows a mitral isthmus reentrant tachycardia. This patient previously underwent minimally invasive surgical atrial fibrillation ablation More than 90 points were mapped, and the map shows an “earliest meets latest” or “head meets tail” on the lateral mitral valve isthmus. The postpacing interval minus the tachycardia cycle length (PPI-TCL) was less than 10 ms from the distal coronary sinus (see Figure 73-16). Sanders et al.20 reported on the use of high-density mapping of focal AT. They used a high-density mapping catheter (PentaRay; Biosense) to characterize a group of patients in whom prior attempts at atria tachycardia ablation or atrial fibrillation ablation were unsuccessful.20 They noted that a localized focus was found in 70%, whereas 30% had evidence of localized reentry characterized by the ability to record electrograms during 95% of the tachycardia cycle length. They demonstrated that with high-density mapping, it was possible to define regions of preferential conduction and intraatrial conduction delay. Higa et al.21 associates made similar observations using the technique of noncontact mapping. These investigators demonstrated that focal AT originates from a small area of tissue but spreads through the atrium by way of regions of preferential (rather than centrifugal) conduction. These investigators made several other notable observations: most ATs originate near a border of a low-voltage zone or an area of anisotropic conduction, and the site of successful ablation is near the site of tachycardia origin or the proximal portion of the preferential conduction pathway, rather than at the “breakout” point. These algorithms are useful despite considerable overlap in P wave morphology, because most ATs originate from relatively few sites. However, it is important to appreciate that the P wave configuration is in large part dependent on left atrial activation. Therefore, despite differences in site of origin, similar sequences of left atrial activation could yield nearly identical P waves. For example, P waves resulting from foci in the coronary sinus muscle can resemble flutter waves in patients with typical counterclockwise flutter. The overlap in P wave morphology reflects the limited spatial resolution of the P wave of at best 2 cm, based on discrimination between two different atrial pacing sites from mapping studies. In addition, the P wave often is obscured by the T wave or QRS complex during tachycardia. To better define P wave morphology and help to establish a fiducial point for mapping, spontaneous ventricular ectopy, ventricular pacing or adenosine infusion may be useful to uncover the true P wave morphology. Finally, the algorithms for differentiation of AT origin have been based largely on analysis of tracings from patients without structural heart disease or atrial dilatation. Notwithstanding these limitations, P wave morphology can provide useful clues to tachycardia location. Published algorithms help to determine the localization of AT site of origin22–26 (Figures 73-3, 73-4). Figure 73-3 A schematic representation of the anatomic distribution of focal atrial tachycardias. The atrioventricular valvular annuli have been removed. CS, Coronary sinus; CT, crista terminalis; LA, left atrium; LAA, left atrial appendage; MA, mitral annulus; PV, pulmonary vein; RA, right atrium; RAA, right atrial appendage; TA, tricuspid annulus. (From Kistler PM, Roberts-Thompson KC, Haqqani HM, et al: P-wave morphology in focal atrial tachycardia: development of an algorithm to predict the anatomic site of origin. J Am Coll Cardiol 48:1010-1017, 2006.) Figure 73-4 Algorithm for localizing the site of origin for focal atrial tachycardias. The algorithm, constructed on the basis of findings from 130 atrial tachycardias, correctly localized the focus in 93%. CS, Coronary sinus; CT, crista terminalis; inf., inferior; iso, isoelectric; LA, left atrium; LAA, left atrial appendage; MA, mitral annulus; PV, pulmonary vein; RA, right atrium; RAA, right atrial appendage; SMA, superior mitral annulus; TA, tricuspid annulus. (From Kistler PM, Roberts-Thompson KC, Haqqani HM, et al: P-wave morphology in focal atrial tachycardia: development of an algorithm to predict the anatomic site of origin. J Am Coll Cardiol 48:1010-1017, 2006.) Tang et al.22 constructed an algorithm to help localize the site of AT. They studied 12-lead ECGs from 31 patients with focal AT who underwent mapping and successful ablation, and they proposed an algorithm that distinguished right atrial from left atrial foci with a sensitivity of 88% to 93% and a specificity of 79% to 88%. The P wave configurations in leads aVL and V1 were most helpful in differentiating right atrial from left atrial foci. A positive or biphasic P wave in aVL predicted a right atrial focus, whereas a positive P wave in V1 predicted a left atrial focus. The algorithm incorrectly predicted the location of AT in patients with a right superior pulmonary vein focus, showing a positive P wave in aVL instead of the expected negative P wave, probably because of the close location of the right superior pulmonary vein to the high lateral right atrium. In these patients, close inspection of the P wave morphology during sinus rhythm and during AT showed the change in P wave morphology in V1 from biphasic to a positive P wave with a right superior pulmonary vein tachycardia. This algorithm was further refined for right ATs by Tada et al.23 Based on the left anterior oblique view of the right atrium, tachycardias were classified as occurring at superolateral, inferolateral, and inferomedial locations. A negative P wave in lead aVR identified an AT lying on the CT with 100% sensitivity and 93% specificity. A positive P wave in the inferior leads differentiated superolateral ATs from inferolateral ATs with a sensitivity of 86% and a specificity of 100%. In any AT with inferomedial or inferolateral foci, the P wave in at least one of the inferior leads was negative. Negative P waves in leads V5 and V6 identified inferomedial ATs with a sensitivity of 92% and a specificity of 100%. In ATs coming from the triangle of Koch, the P wave duration in the inferior leads was shorter than during sinus rhythm (see Figure 73-4). Foci from the right atrial appendage have a characteristic P wave morphology, a negative P wave in lead V1 becoming progressively positive across the precordial leads, and low-amplitude positive P waves in the inferior leads in a majority of patients. Another refinement of the algorithm for pulmonary vein foci was reported by Haissaguerre et al.24 Criteria were devised to distinguish right from left pulmonary vein sites: a positive and relatively flat P wave in lead aVL and a positive P wave in lead I of greater than 50 µV indicated a right pulmonary vein origin with a specificities of 100% and 97% and a sensitivities of 38% and 72%, respectively. The positive predictive values of these two criteria were 100% and 98%, respectively. A notched P wave in lead II was a predictor of left pulmonary vein origin, with a specificity of 95% and sensitivity of 39%. An amplitude ratio of lead III/II of 0.8 or greater and the duration of positivity in lead V1 (longer than 80 ms) also were helpful in differentiating left from right pulmonary vein origin. These two criteria had specificities of 75% and 73%, sensitivities of 96% and 85%, and positive predictive values for left pulmonary vein sites of 79% and 76%, respectively. Left pulmonary vein sites were characterized by low-amplitude and flat P waves in lead I, negative polarity in lead aVL, similar amplitudes in both limb leads III and II, and longer duration of positivity in lead V1. Superior pulmonary veins were distinguished from inferior pulmonary veins on the basis of P wave amplitude for superior pulmonary vein origin in lead II of 100 µV or greater. This value differentiated superior from inferior P waves, with a specificity of 74%, a sensitivity of 81%, and a positive predictive value of 86%. Focal ATs arising from the left atrial appendage can be distinguished from left or right pulmonary vein tachycardias by a deeply negative P wave in lead I. In addition, left atrial appendage (LAA) ATs also have a P wave that is upright or biphasic in lead V1 and highly positive in the inferior leads. Hachiya et al.24 further refined and simplified the algorithm for left AT. Their algorithm involves two steps: a positive P wave in V1 localizes the site of origin to the pulmonary veins, and a biphasic or negative P wave in V1 localizes the septal or superior mitral annulus or left atrial appendage.25 Kistler et al.26, building on prior algorithms and using data from a series of 126 patients with 130 ATs, devised another algorithm that identifies tachycardia site of origin.26 This algorithm is presented as Figure 73-4; once again V1 was critical. They found that a negative or a positive-negative P wave in V1 demonstrated a specificity of 100% for a right atrial focus, and a positive or negative-positive P wave in V1 demonstrated a sensitivity of 100% for a left atrial focus. Potential limitations of this algorithm include possible inaccuracies in distinguishing between the left and right PVs and localizing tachycardias close to the interatrial septum and that it considers the CT as a single location. A refinement of the P wave algorithm based on a computational simulation study aimed to improve this algorithm’s ability to distinguish between various focal origins along the CT.27 If the peak of the P wave in lead III is positive with the amplitude greater than that in V1, then the origin is in the superior CT. In addition, the larger the difference, the more superior the excitation. If the peak P wave in lead III is negative or has a smaller amplitude than the positive peak of V1, then the excitation origin is in the inferior CT. A newer P wave morphology algorithm was designed to further improve the localization of focal AT.28 A combination of the inferior ECG leads along with the aVR lead and regrouping of atrial sites of origin into two areas that had similar ECG patterns (high atrial and right low septal origins) improved predictive accuracy compared with the algorithm by Kistler et al.26 Positive P waves in inferior leads and a negative P wave in the aVR lead indicated high atrial origins (high CT, superior PVs, and right atrial appendage [RAA]), and negative P waves in inferior leads and a positive P wave in the aVR lead suggested right low septal origins (coronary sinus [CS] ostium and inferior tricuspid annulus). Noninvasive electrocardiographic imaging or electrocardiographic mapping (ECM) is a promising tool for diagnosis of tachycardia origin and could be useful in procedure planning before catheter ablation.29 As noted previously, the standard 12-lead surface ECG remains a useful tool for providing an initial approximation of the site of origin of AT, but it has numerous limitations. Body surface potential mapping incorporates a much larger number of electrodes, but does not provide anatomic information. The recent development of electrocardiographic imaging represents further advancement in high-resolution noninvasive mapping by combining body surface electrodes and heart-torso geometric information to produce detailed electroanatomic maps of the epicardial surface through the application of inverse solution mathematical algorithms. This methodology has permitted accurate localization of focal, microreentrant, and macroreentrant ATs.30–32 Roten et al.32 described a case report in which ECM was performed before an ablation procedure in a patient who developed AT 2 years after bilateral pulmonary transplantation. Tachycardia origin was located in a scar region medial to the anastomosis of the left inferior pulmonary donor vein. ECM matched with results of invasive electroanatomic (Carto) mapping and predicted both tachycardia mechanism and origin. In this case, tachycardia mechanism was microreentry from a scar region at the medial anastomosis of the left inferior pulmonary vein, as more than 75% of the tachycardia cycle length was recordable within a few millimeters. Atrial tachycardias can be located all along the CT, which has been described as a “ring of fire” because it is a common location for ATs in patients without structural heart disease, accounting for two thirds of right ATs in one study (Figures 73-5, 73-6). One physiological factor contributing to the clustering of ATs in this area is that the CT demonstrates marked anisotropy because of poor transverse cell-to-cell coupling, which could contribute to slow conduction and microreentry. Another contributing factor is that the CT contains clusters of cells with automaticity. The ECG characteristics of these tachycardias were described earlier and depend on site of origin from the CT (e.g., superior versus inferior). Intracardiac echocardiography can be useful to demonstrate the close anatomic proximity of the tachycardia focus to the crista during mapping. Ablation of tachycardias arising from the superior CT carries a small risk of damage to the phrenic nerve resulting in diaphragmatic paralysis. Figure 73-5 Electrocardiogram during atrial tachycardia arising from the crista terminalis in a 60-year-old female patient who developed a tachycardia-induced cardiomyopathy. Note that the P wave morphology is positive in lead aVL and biphasic (positive/negative) in lead V1 consistent with a right atrial focus. Figure 73-6 Electroanatomic map of the right atrium (right anterior oblique projection; left panel) and fluoroscopic image (left anterior oblique projection; right panel) obtained during mapping and ablation of a focal atrial tachycardia arising from the crista terminalis (electrocardiogram during this tachycardia is shown in figure 38-5). Red dots indicate the site of successful tachycardia ablation. The patient’s cardiomyopathy resolved after successful ablation of this tachycardia. AB, ablation catheter; His, His bundle catheter; SVC, superior vena cava; IVC, inferior vena cava; CS Os, coronary sinus ostium; RAA, right atrial appendage; RV, RV catheter). The tricuspid annulus probably represents the second most common location of right-sided ATs. In several series, tachycardias arising from the tricuspid annulus accounted for 13% to 22% of right ATs.33 Tricuspid annular AT has negative or notched P waves in V1 and invariably positive P waves in lead aVL. Reports describe foci from around the entire circumference of the tricuspid annulus. Inferior foci tend to have negative P waves in leads II, III, and aVF, whereas superior foci are usually isoelectric or positive in these leads. Foci from the superior tricuspid annulus and the RAA have similarity P wave morphologies, consistent with their close proximity. The presence of myocytes with AV nodal-type electrophysiologic characteristics around the entire tricuspid annulus has been described in animals.34 These cells are histologically similar to the atrial cells but resemble nodal cells in their cellular electrophysiology, response to adenosine, and lack of connexin43. These cells can serve as the substrate for AT originating from around the tricuspid annulus. The RAA is an uncommon site of origin for AT (<5% of ectopic ATs in several series), although both appendages are a more common site for incessant ATs.35–37 The appendage is composed of ridges formed by pectinate muscles, which arise from the CT. The characteristic electrocardiographic pattern associated with RAA tachycardia shows negative P waves in lead V1 that become progressively positive across the rest of the precordial leads, along with upright P waves in the inferior leads, positive or isoelectric-positive in lead I, and an inverted P wave in lead aVR. As with other right ATs that arise from the superior crista, RAA can be confused with sinus tachycardia. At least one case series has suggested that RAA tachycardias arise more commonly in younger male patients and can manifest as an incessant tachycardia resulting in left ventricular dysfunction secondary to tachycardia-induced cardiomyopathy.35,38 Catheter ablation of focal RAA tachycardia is relatively straightforward and has high success rates.35,38 However, there are at least two case reports of RAA tachycardias that were more challenging to eliminate with catheter ablation. One case of RAA tachycardia that which originated in the inferior/lateral aspect of the appendage could not be ablated despite multiple attempts using manual catheter ablation, but it was successfully ablated using magnetic navigation.39 Another case of an AT that originated at the apex of the RAA was resistant to catheter ablation and required surgical right atrial appendectomy to eliminate the tachycardia.40 The SVC is an uncommon site of origin for focal ATs (<2%).41,42 Cardiac muscle extends for a distance into the SVC in human hearts, and the electrophysiological characteristics of the SVC and RA muscle are similar. AT originating in the SVC can arise from 1 to 3 cm above the SVC-RA junction and conduct to the right atrium in a 1 : 1 manner or with variable conduction delay or block. AT arising from the area of the SVC demonstrates a P wave morphology that is positive in leads I, II, III, and aVF, isoelectric or negative in lead aVL, biphasic (positive then negative) in lead V1, and positive or isoelectric in leads V2 to V6 (Figures 73-7, 73-8). Radiofrequency (RF) catheter ablation of SVC foci is usually successful in eliminating tachycardia. Rather than directly targeting the AT focus in the SVC, an alternative strategy is electrical disconnection of the SVC muscle sleeve at the SVC-RA junction in a circumferential or segmental fashion or isolation of the arrhythmogenic area from the rest of the SVC. Careful attention should be paid to avoid injury to the phrenic nerve during ablation in this region, and complete SVC isolation is best avoided because of the risk of SVC stenosis.43 The SVC also has been reported as having a role in arrhythmia initiation and maintenance in 5% to 10% of patients with paroxysmal AF.44 Fibrillatory conduction from a focus in the SVC with exit block to the right atrium masquerading as a focal right AT also has been reported.45 Figure 73-7 Spontaneous, ambulatory monitor recording (A, top panel) and electrocardiogram (ECG; B, bottom panel) during focal atrial tachycardia arising from the superior vena cava. The patient was a 25-year-old woman with recurrent episodes of highly symptomatic tachycardia at rates of 170 to 180 beats/min that were refractory to β-blockers, calcium channel blockers, and sotalol. During tachycardia, the P wave morphology is positive in leads I, II, III, and aVF, negative in lead aVR, isoelectric in lead aVL, biphasic (positive then negative) in lead V1, and positive or isoelectric in leads V2 to V6. Figure 73-8 Fluoroscopic image (right anterior oblique projection; left panel), electrocardiographic and intracardiac electrograms (middle panel) and electroanatomic map (left anterior oblique projection; right panel) obtained during mapping and ablation of a focal atrial tachycardia arising from the superior vena cava (electrocardiogram shown in Figures 73-7). The electrogram recorded at the site of tachycardia origin (arrow, middle panel) preceded the onset of the P wave by 15 to 20 ms. Red dots
Atrial Tachycardia
Classification and Mechanisms
Focal Atrial Tachycardias
Impact of Mapping Technologies
Electrocardiographic Localization of Focal Atrial Tachycardia
Atrial Tachycardia Arising from the Crista Terminalis
Atrial Tachycardia Arising from the Tricuspid Atrioventricular Annulus
Atrial Tachycardia Arising from the Right Atrial Appendage and Superior Vena Cava
![]()
Stay updated, free articles. Join our Telegram channel

Full access? Get Clinical Tree


Atrial Tachycardia
