Transcatheter aortic valve implantation (TAVI) is considered a suitable treatment for patients with severe symptomatic aortic stenosis and high operative risk. Our aim was to evaluate the effect of preprocedural and new-onset atrial fibrillation (NOAF) on mortality and stroke in patients who underwent TAVI. We performed a single-center study of 380 consecutive patients enrolled to a TAVI registry. NOAF was defined as postprocedural atrial fibrillation (AF) occurring within 30 days after the procedure. Patients were followed up for a mean of 528 ± 364 days. During follow-up, 19 (5%) new episodes of stroke occurred, of whom 6 and 18 cases occurred within 30 days and 1 year, respectively. Overall mortality during the follow-up was 68 (20%), of those 12 and 58 patients died within 30 days and 1 year, respectively. NOAF occurred in 31 (8.2%) patients and was not associated with higher stroke or mortality rates at 30 days or 1 year of follow-up. Notably, compared with patients without previous AF, patients with previous AF at baseline had increased rates of stroke and mortality at 1-year follow-up (2.1% vs 9.6%, p = 0.01, and 8.2% vs 34.9%, p <0.01; respectively). In multivariate analysis, AF at baseline but not NOAF was a significant predictor of mortality throughout the follow-up period (HR 2.2, 95% confidence interval 1.3 to 3.8, p = 0.003, and HR 1.5, 95% confidence interval 0.5 to 4.1, p = 0.390, respectively). In conclusion, previous AF at baseline but not NOAF significantly increases stroke and mortality rates after TAVI. The inclusion of AF into future TAVI risk stratification scores should be strongly considered.
Transcatheter aortic valve implantation (TAVI) is an alternative to surgery for patients with severe aortic stenosis and high operative risk. The overall safety of TAVI is comparable with that of surgery, but stroke occurring during or immediately after the procedure account for significant morbidity and mortality. Atrial fibrillation (AF) is the most prevalent cardiac arrhythmia, particularly in the elderly, with a prevalence of more than 9% in octogenarians. In light of the increased risk for stroke in AF, it is important to understand the potential interaction between TAVI and AF during and after the procedure. The aim of the present study was to determine the occurrence of AF diagnosed before TAVI (previous AF) and its new onset (new-onset atrial fibrillation [NOAF]) after TAVI and to investigate their association with procedural complications, including stroke and mortality.
Methods
We retrospectively analyzed the 380 consecutive patients who underwent TAVI at the Tel Aviv Sourasky Medical Center between September 2008 and April 2013. Data were collected prospectively as part of the Tel-Aviv Prospective Angiography Study, after obtaining informed consent from each patient as approved by the institutional ethics committee. Severe aortic stenosis was diagnosed by a combination of clinical, echocardiographic, and hemodynamic criteria. A dedicated “heart team,” consisting of an interventional cardiologist, a cardiac surgeon, and a senior echocardiographist, decided on patient eligibility for TAVI based on predetermined criteria. TAVI was performed as previously described mainly through a transfemoral approach (98% of patients). A single team performed all procedures. After the valve was implanted, the patients were monitored at the cardiac intensive care unit where vital signs were recorded continuously during the first 24 hours after the procedure and at least 3 times daily afterward. Continuous electrocardiographic telemetry was performed throughout the hospitalization.
The diagnosis of previous AF was documented according to patient history using a prespecified registry questionnaire, current admission, and past medical records and baseline and past electrocardiograms. Unless contraindicated, a 6-month course of dual antiplatelet therapy with aspirin and clopidogrel was initiated after TAVI, and additional treatment with anticoagulants was provided according to current guidelines. NOAF was defined as AF lasting ≥30 seconds during the actual TAVI procedure or during the subsequent 30 days. In case of NOAF occurring during hospitalization or when acknowledged during follow-up, anticoagulation was introduced according to guidelines.
Baseline data collection and follow-up were performed as previously described. Stroke during hospitalization was determined by accepted clinical criteria and validated by computerized tomography. Cerebrovascular events during follow-up were adjudicated by a senior neurologist after reviewing all the hospital reports and imaging studies.
All data are displayed as mean ± SD for continuous variables and as the number and percentage of patients in each group for categorical variables. Significance for continuous variables was determined with the Student t test after Levean’s test for homogeneity. Significance for categorical variables was determined with the chi-square and Fisher’s exact tests. Logistic regression models that were fitted for NOAF was the dependent variable and adjusted to multiple possible variables contributing to the occurrence of AF after TAVI. Cox proportional hazard ratio models for all-cause mortality were adjusted to previous AF at baseline and NOAF referenced to no occurrence of AF and to other known predictors of mortality after TAVI. All the analyses were considered significant at a 2-tailed p value <0.05. The SPSS was used to perform all statistical evaluation (SPSS, Chicago, IL).
Results
We studied 380 consecutive patients who underwent TAVI between September 2008 and April 2013, with the baseline characteristics described in Table 1 . The overall rate of previous AF was 31%. In patients with previous AF, the arrhythmia was paroxysmal in 72 patients (19%) and permanent in 46 (12%) patients. CHADS 2 and CHA 2 DS 2 VASC did not differ between patients with and without previous AF.
| Coefficients | Total (n=380) | NOAF vs. no NOAF (n=262) | p Value | Prior AF vs. no prior AF (n=380) | p Value | ||
|---|---|---|---|---|---|---|---|
| NOAF (n=31) | No NOAF (n=231) | Prior AF (n=118) | No Prior AF (n=262) | ||||
| Age, mean (standard deviation) | 83.0 (5.6) | 82.4 (6.59) | 82.7 (5.59%) | 0.820 | 83.9 (5.5%) | 82.7 (5.7%) | 0.047 |
| Women | 226 (59.5%) | 20 (64.5%) | 138 (59.7%) | 0.61 | 68 (57.6%) | 158 (60.3%) | 0.623 |
| Hypertension | 331 (87.1%) | 25 (80.6%) | 200 (86.6%) | 0.373 | 106 (89.8%) | 225 (85.9%) | 0.287 |
| Diabetes mellitus | 124 (32.6%) | 8 (25.8d%) | 77 (33.3%) | 0.401 | 39 (33.1%) | 85 (32.4%) | 0.907 |
| Hyperlipidemia | 294 (77.4%) | 25 (80.6%) | 184 (79.7%) | 0.894 | 85 (72%) | 209 (79.8%) | 0.095 |
| Smoker | 83 (21.9%) | 4 (12.9%) | 57 (24.7%) | 0.145 | 22 (18.6%) | 61 (23.3%) | 0.145 |
| Peripheral vascular disease | 29 (7.6%) | 3 (9.7%) | 17 (7.4%) | 0.684 | 9 (7.6%) | 20 (7.6%) | 0.998 |
| Systolic heart failure | 67 (17.6%) | 9 (29%) | 35 (15.2%) | 0.052 | 23 (19.5%) | 44 (16.8%) | 0.523 |
| Coronary artery disease | 214 (56.3%) | 16 (51.6%) | 132 (57.1%) | 0.56 | 66 (55.9%) | 148 (56.5%) | 0.919 |
| Prior myocardial infarction | 63 (16.6%) | 8 (25.8%) | 32 (13.9%) | 0.082 | 23 (19.5%) | 40 (15.3%) | 0.306 |
| Percutaneous coronary intervention | 161 (42.4%) | 11 (35.5%) | 95 (41.1%) | 0.548 | 55 (46.6%) | 106 (40.5%) | 0.261 |
| Permanent pacemaker | 40 (10.5%) | 3 (9.7%) | 16 (6.9%) | 0.579 | 21 (17.8%) | 19 (7.3%) | 0.002 |
| Coronary bypass | 17.6 (6.7%) | 0 (0%) | 43 (18.6%) | 0.009 | 40 (20.3%) | 43 (16.4%) | 0.303 |
| Stroke | 38 (10%) | 3 (9.7%) | 21 (9.1%) | 0.915 | 14 (11.9%) | 24 (9.2%) | 0.416 |
| Chronic obstructive pulmonary disease | 18.4 (70%) | 7 (22.6%) | 42 (18.2%) | 0.555 | 21 (17.8%) | 49 (18.7%) | 0.833 |
| Creatinine clearance (ml/min) | 51.3 ± 19.8 | 58.09 ± 24.4 | 52.3 ± 20.34 | 0.135 | 47.7 ± 18.3 | 52.9 ± 20.3 | 0.018 |
| Body mass index (kg/m 2 ) | 27.2 ± 5.1 | 28.06 ± 6.46 | 27.3 ± 4.93 | 0.444 | 27.1 ± 5.1 | 27.4 ± 5.1 | 0.540 |
| Weight (kg) | 72.2 ± 14.5 | 73.6 ± 17.7 | 72.1 ± 13.8 | 0.591 | 72.0 ± 15.2 | 72.3 ± 14.3 | 0.869 |
| Height (cm) | 162.5 ± 8.6 | 161.93 ± 8.22 | 162.4 ± 8.72 | 0.760 | 162.9 ± 8.7 | 162.38 ± 8.6 | 0.542 |
| CHADS 2 score | 2.5 ± 0.9 | 2.4 ± 1.02 | 2.4 ± 0.86 | 0.131 | 2.6 ± 0.9 | 2.4 ± 0.8 | 0.168 |
| CHA 2 DS 2 VAS c score | 4.6 ± 1.09 | 4.6 ± 1.3 | 4.6 ± 1.1 | 0.928 | 4.7 ± 1.1 | 4.6 ± 1.1 | 0.246 |
| EUROSCORE | 24.3 ± 14.1 | 21.88 ± 11.6 | 23.3 ± 13.9 | 0.158 | 26.9 ± 14.8 | 23.2 ± 13.7 | 0.017 |
| Ejection fraction (%) | 55.8 ± 7.8 | 53.3 ± 8.49 | 56.6 ± 7.5 | 0.048 | 55.1 ± 8.03 | 56.2 ± 7.7 | 0.194 |
| Peak AV pressure gradient (mm Hg) | 78.0 ± 23.1 | 81.12 ± 24.74 | 79.2 ± 20.9 | 0.635 | 74.9 ± 26.5 | 79.4 ± 21.4 | 0.107 |
| Mean AV pressure gradient (mm Hg) | 47.3 ± 15 | 50.8 ± 15.57 | 48.0 ± 13.8 | 0.299 | 45.1 ± 16.8 | 48.3 ± 14.0 | 0.055 |
| Aortic valve area (cm 2 ) | 0.71 ± 0.19 | 0.68 ± 0.21 | 0.71 ± 0.18 | 0.419 | 0.68 ± 0.19 | 0.71 ± 0.19 | 0.304 |
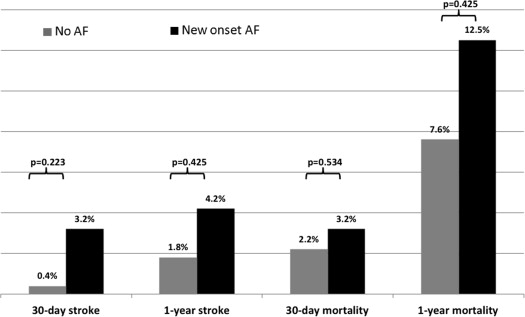
Mean follow-up time was 528 ± 364 days. Thirty-day follow-up was available for all patients, and 1-year follow-up was available for 280 (73%) patients. During follow-up, 19 (5%) new episodes of stroke occurred, of whom 6 and 18 cases occurred within 30 days and 1 year, respectively. Overall mortality during the follow-up was 68 (20%), of those 12 and 58 patients died within 30 days and 1 year, respectively. The rate of NOAF occurring within 30 days of TAVI was 8.2% (n = 31), and 6 additional patients developed AF later on. Patients with NOAF were similar to patients without NOAF in their degree of aortic disease, their co-morbidities, and procedural features ( Table 1 ). However, patients with NOAF had slightly lower ejection fraction. In multivariate analysis ( Table 2 ), reduced EF was the single significant predictor of NOAF after TAVI (p = 0.04). Not surprisingly, patients with NOAF had longer hospital stay than patients without AF or previous AF (10.5 vs 7.5 days, respectively; p = 0.04). There was no significant difference in the cumulative stroke or mortality rates between patients with NOAF versus those without NOAF or previous AF at 30 days and at 1 year ( Figure 1 ). Notably, stroke rate in our cohort was low, with just 1 patient in each group having stroke during the first 30 days after TAVI, resulting in a rate of 3% in the NOAF group and 0.4% in patients without AF.
| Coefficients | OR | 95% CI | p Value | |
|---|---|---|---|---|
| Lower | Upper | |||
| Age | 1.02 | 0.93 | 1.12 | 0.59 |
| Gender | 1.06 | 0.42 | 2.66 | 0.89 |
| Coronary artery disease | 0.70 | 0.29 | 1.70 | 0.44 |
| Peripheral artery disease | 2.22 | 0.50 | 9.84 | 0.29 |
| Hypertension | 0.62 | 0.21 | 1.85 | 0.39 |
| Diabetes mellitus | 0.91 | 0.36 | 2.29 | 0.84 |
| Prior stroke | 1.07 | 0.26 | 4.35 | 0.91 |
| EUROSCORE | 0.98 | 0.94 | 1.01 | 0.36 |
| Mild mitral regurgitation and above | 1.66 | 0.63 | 4.40 | 0.30 |
| Aortic mean pressure gradient | 1.01 | 0.98 | 1.04 | 0.27 |
| Creatinine clearance | 1.01 | 0.98 | 1.04 | 0.39 |
| Body mass index | 1.04 | 0.95 | 1.13 | 0.41 |
| Ejection fraction | 0.93 | 0.88 | 0.99 | 0.02 |
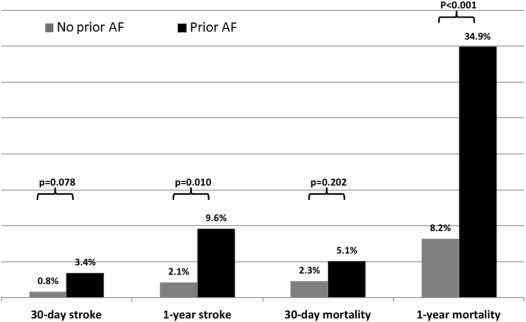
Comparing with patients without AF, patients with previous AF were older, had a higher rate of previously implanted pacemakers, had worse kidney function, and a higher European System for Cardiac Operative Risk Evaluation (EUROSCORE) ( Table 1 ). There was a nonsignificant trend toward increased stroke rate at 30 days (3.4% vs 0.8%, p = 0.078) and a markedly higher stroke rate at 1 year in the previous AF group (9.6% vs 2.1%, p = 0.01; Figure 2 ). In multivariate logistic regression analysis ( Supplementary Tables 1 and 2 ) adjusted for known predictors of stroke, previous AF showed a trend toward increased risk for stroke at 30 days (odds ratio = 8.7, p = 0.058) and was a significant predictor of stroke at 1 year after the procedure (odds ratio = 5.9, p = 0.015). Mortality rates at 1 year were strikingly higher in patients with previous AF at baseline (34.9% vs 8.2%; p <0.01). Multivariate adjusted Cox proportional hazard analysis ( Table 3 and Figure 3 ) showed that previous AF (HR 2.2, 95% confidence interval 1.3 to 3.8, p = 0.003), but not NOAF (HR 1.5, 95% confidence interval 0.5 to 4.1, p = 0.390), was the most significant predictor of mortality throughout the follow-up period.
| Coefficients | HR | 95% CI | p value | |
|---|---|---|---|---|
| Lower | Upper | |||
| No atrial fibrillation | Reference | |||
| Prior atrial fibrillation | 2.270 | 1.334 | 3.862 | 0.003 |
| New onset atrial fibrillation | 1.536 | 0.578 | 4.080 | 0.390 |
| Gender | 0.853 | 0.466 | 1.562 | 0.607 |
| Age | 1.073 | 1.010 | 1.141 | 0.024 |
| Body mass index | 0.973 | 0.913 | 1.036 | 0.392 |
| Systolic heart failure | 1.187 | 0.607 | 2.320 | 0.617 |
| Prior coronary bypass | 1.353 | 0.616 | 2.975 | 0.452 |
| Pulmonary disease | 1.574 | 0.835 | 2.965 | 0.161 |
| EUROSCORE | 1.025 | 1.006 | 1.045 | 0.012 |
| Mean aortic valve pressure gradient | 0.983 | 0.965 | 1.001 | 0.068 |
| Previous coronary intervention | 0.535 | 0.309 | 0.926 | 0.025 |
| Creatinine clearance | 0.996 | 0.976 | 1.016 | 0.710 |
Stay updated, free articles. Join our Telegram channel

Full access? Get Clinical Tree


