ATLAS OF ELECTROCARDIOGRAPHY
The electrocardiograms (ECGs) in this Atlas supplement those illustrated in Chap. 11. The interpretations emphasize findings of specific teaching value.
All of the figures are from ECG Wave-Maven, Copyright 2003, Beth Israel Deaconess Medical Center, http://ecg.bidmc.harvard.edu.
The abbreviations used in this chapter are as follows:
AF—atrial fibrillation
HCM—hypertrophic cardiomyopathy
LVH—left ventricular hypertrophy
MI—myocardial infarction
NSR—normal sinus rhythm
RBBB—right bundle branch block
RV—right ventricular
RVH—right ventricular hypertrophy
MYOCARDIAL ISCHEMIA AND INFARCTION
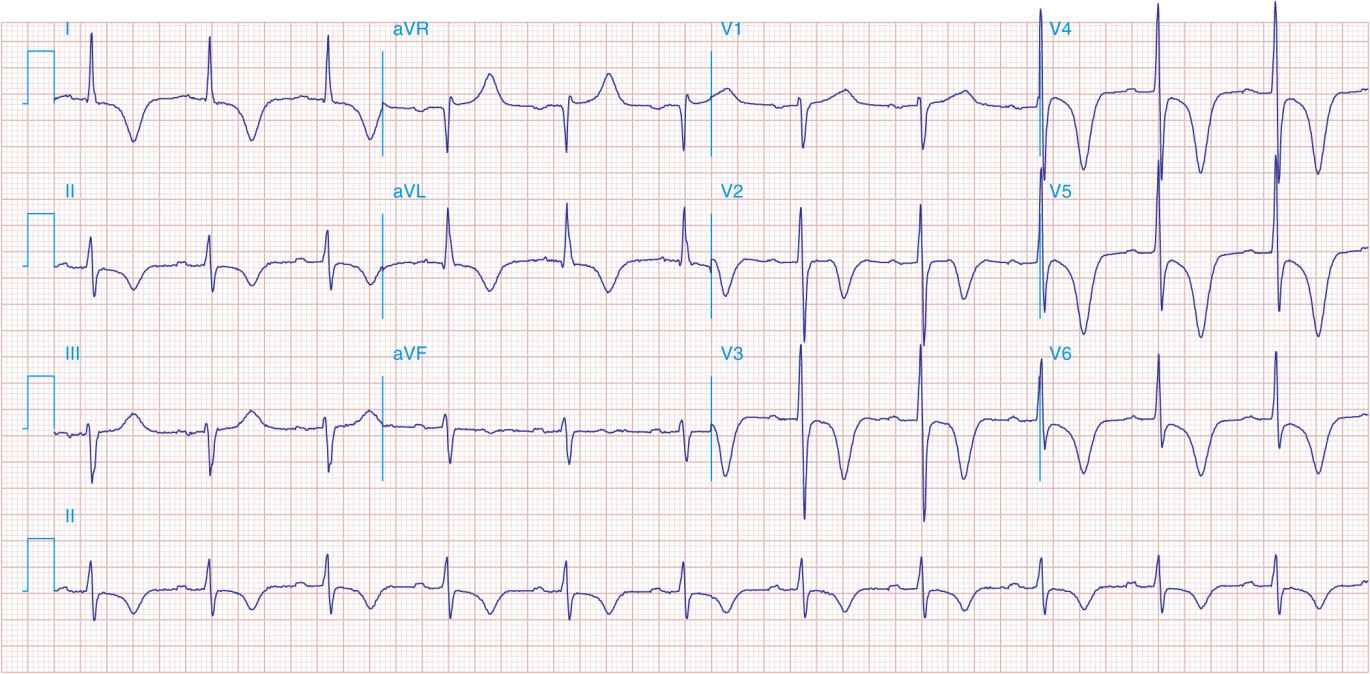
FIGURE 41-1
Anterior wall ischemia (deep T-wave inversions and ST-segment depressions in I, aVL, V3 V6) in a patient with LVH (increased voltage in V2–V5).
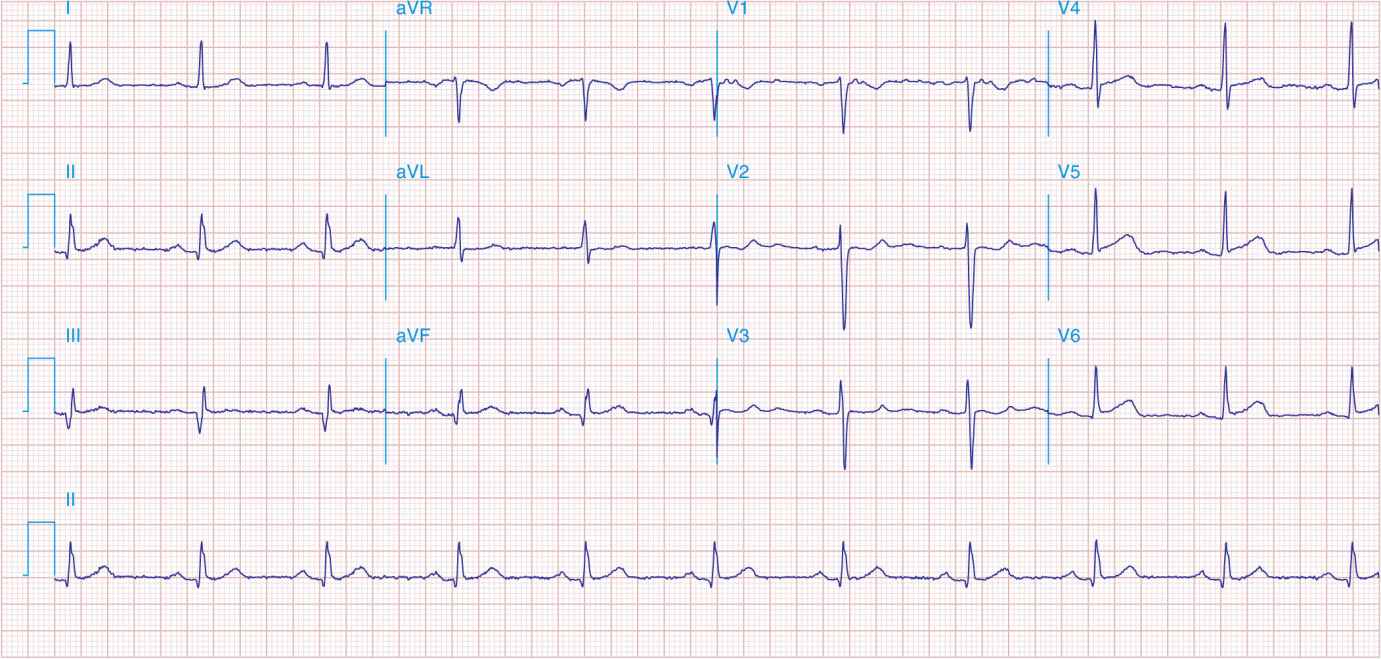
FIGURE 41-2
Acute anterolateral wall ischemia with ST elevations in V4–V6. Probable prior inferior MI with Q waves in leads II, III, and aVF.
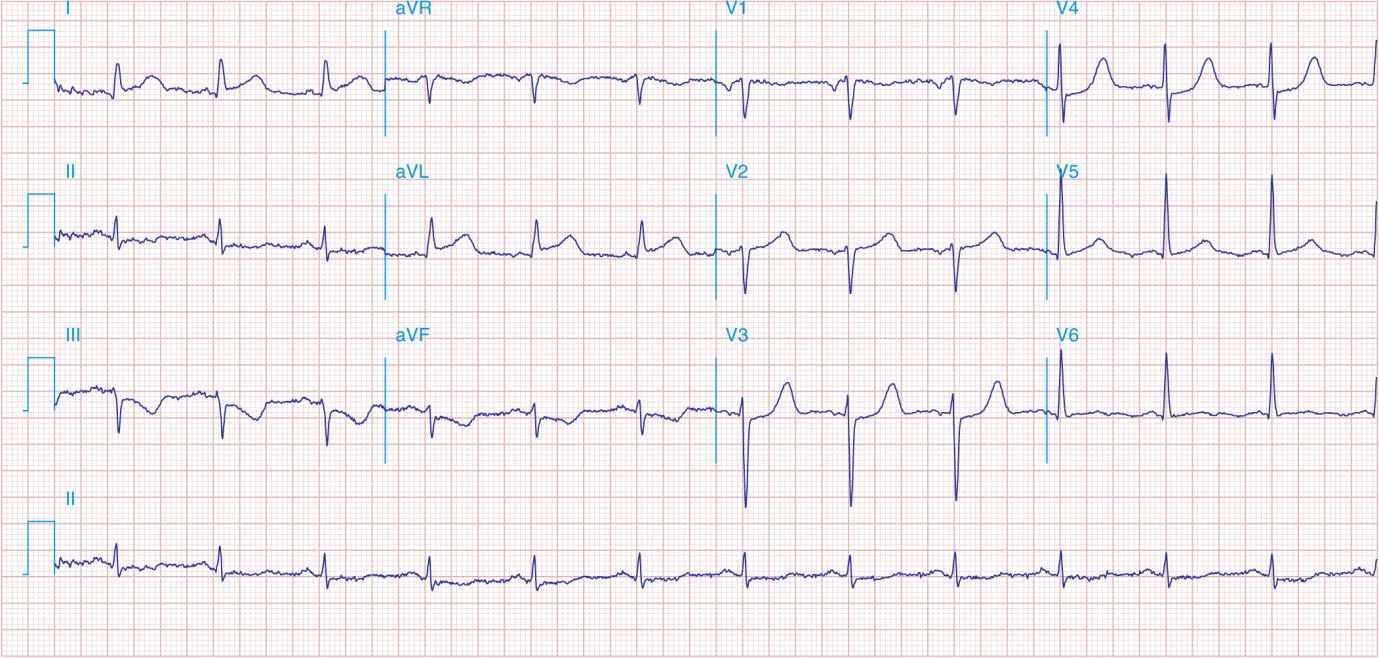
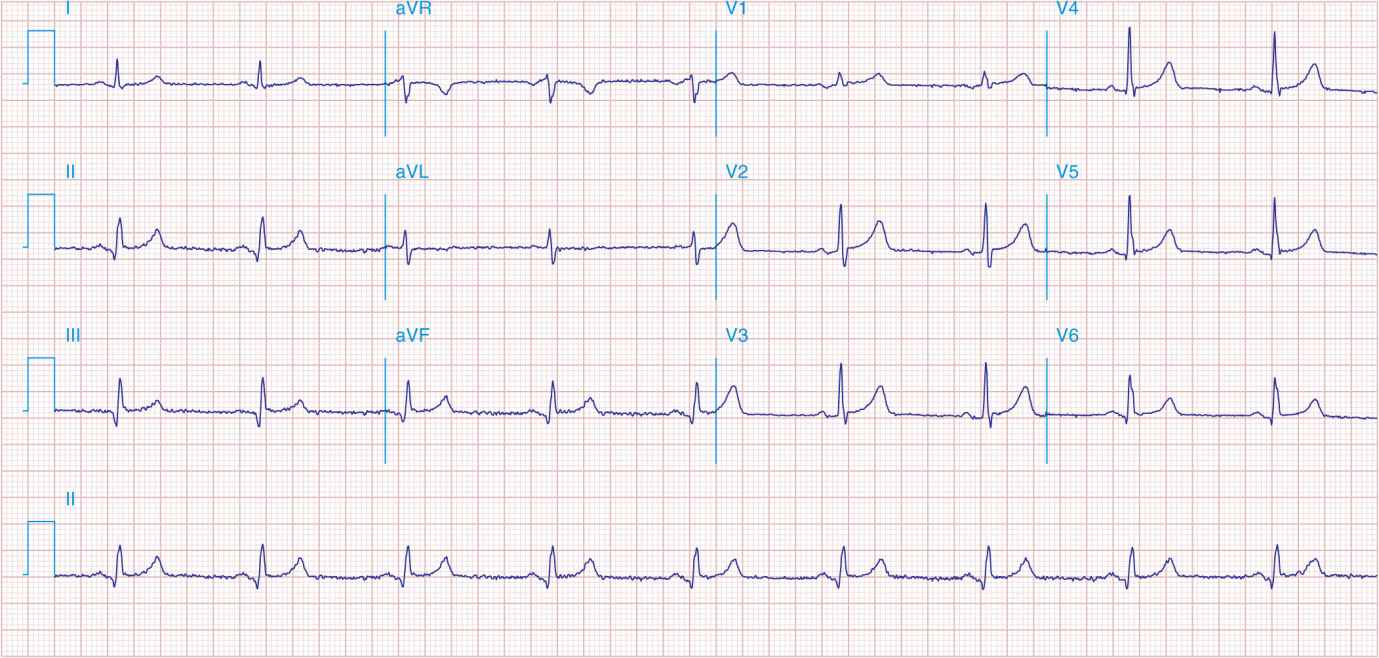
FIGURE 41-3
Acute lateral ischemia with ST elevations in I and aVL with probable reciprocal ST depressions inferiorly (II, III, and aVF). Ischemic ST depressions also in V3 and V4. Left atrial abnormality.
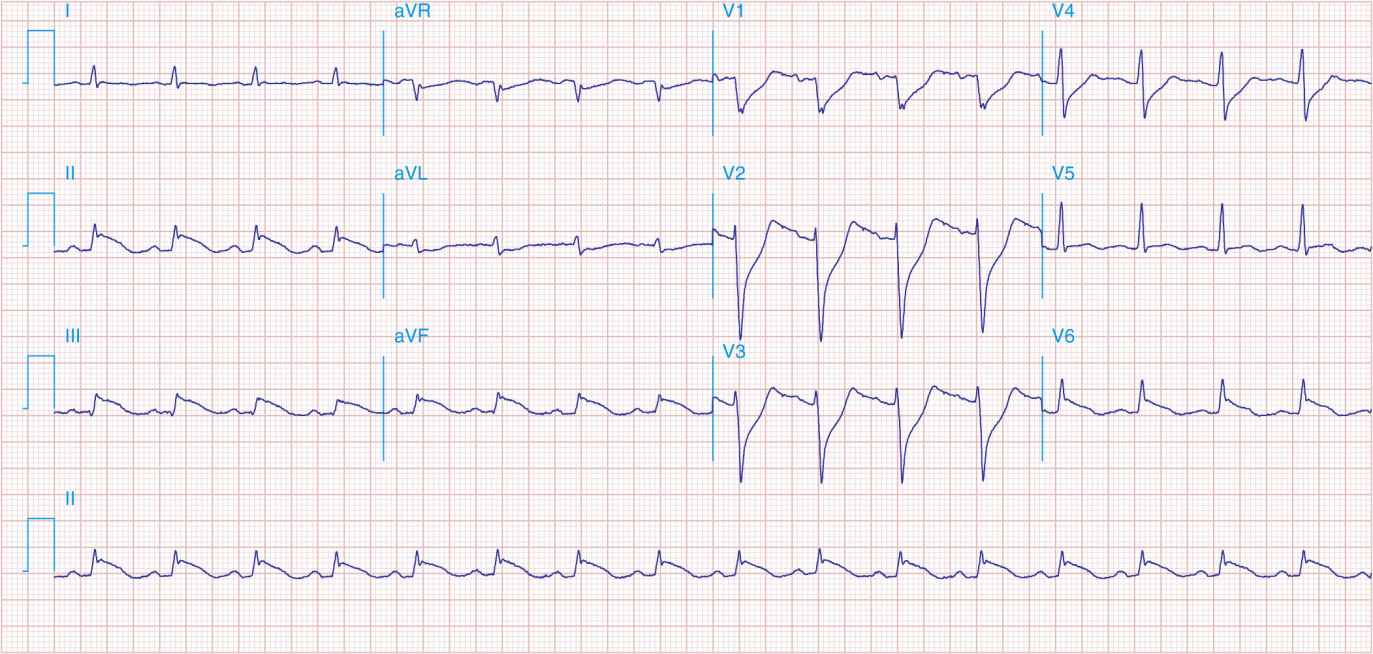
FIGURE 41-4
Sinus tachycardia. Marked ischemic ST-segment elevations in inferior limb leads (II, III, aVF) and laterally (V6) suggestive of acute inferolateral MI, and prominent ST-segment depressions with upright T waves in V1–V4 are consistent with associated acute posterior MI.
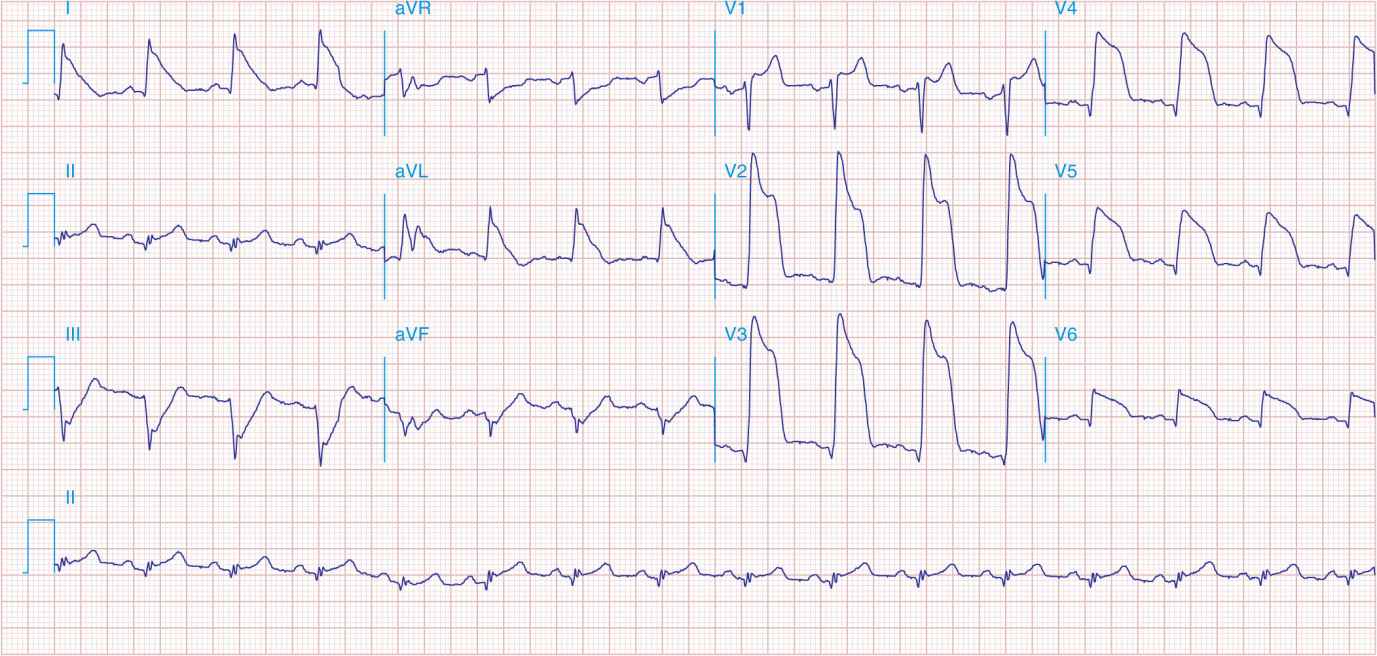
FIGURE 41-5
Acute, extensive anterior MI with marked ST elevations in I, aVL, V1–V6 and small pathologic Q waves in V3 – V6. Marked reciprocal ST-segment depressions in III and aVF.
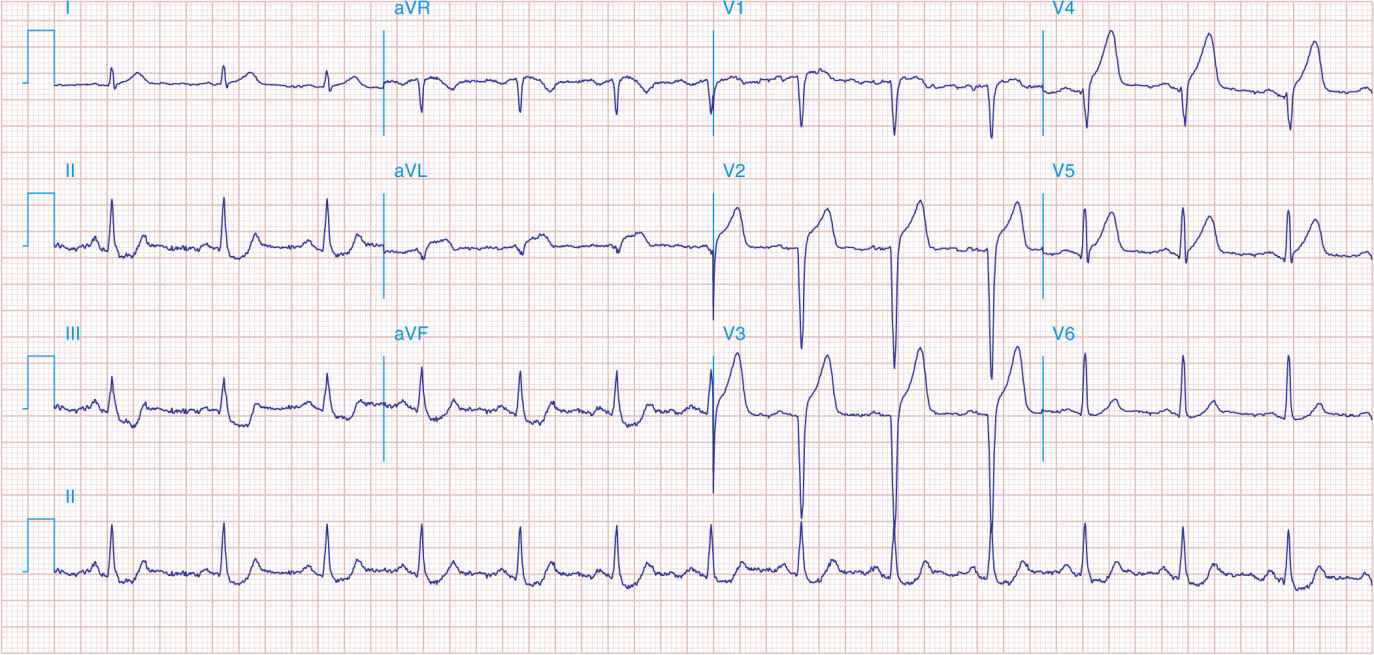
FIGURE 41-6
Acute anterior wall MI with ST elevations and Q waves in V1–V4 and aVL and reciprocal inferior ST depressions.
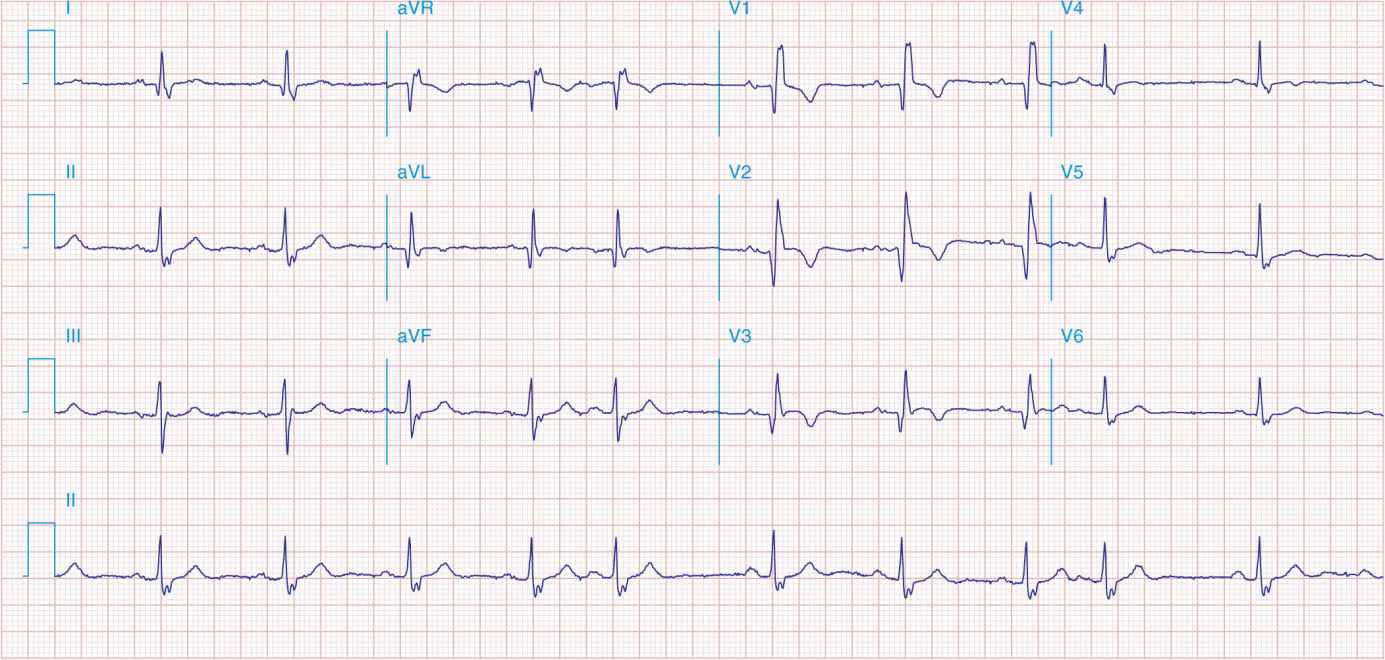
FIGURE 41-7
NSR with premature atrial complexes. RBBB; pathologic Q waves and ST elevation due to acute anterior/septal MI in V1–V3.
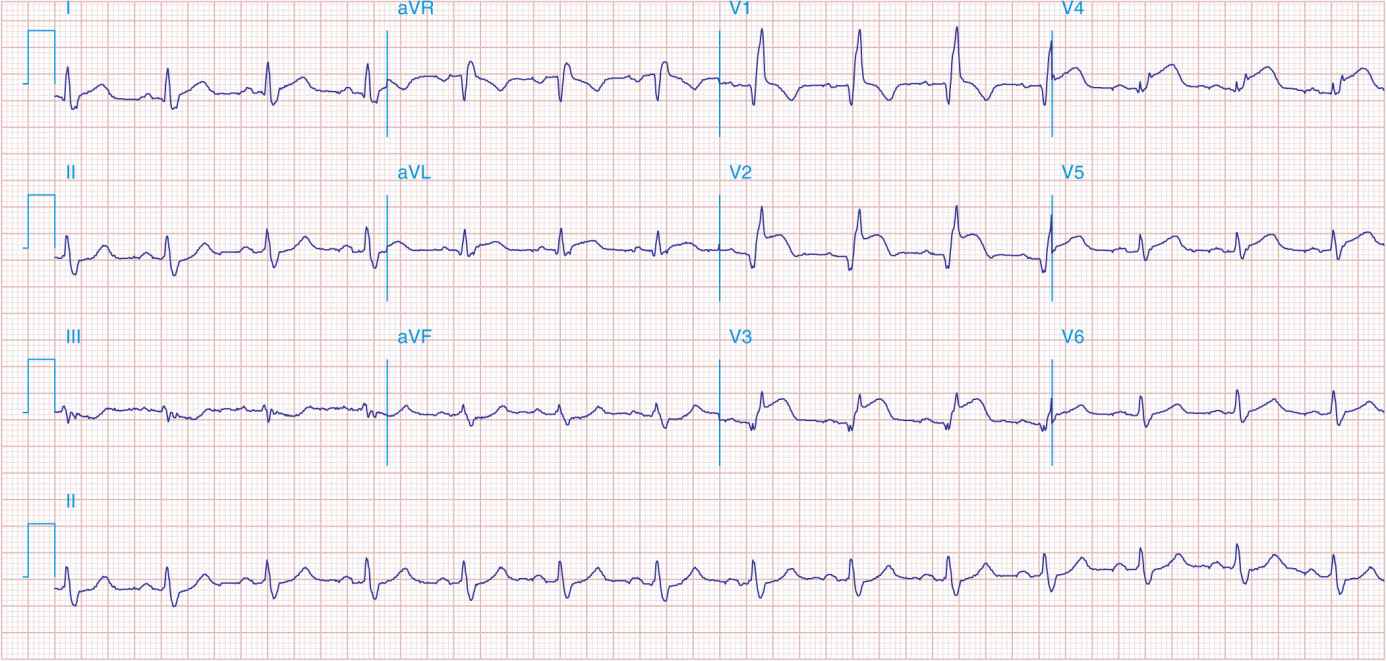
FIGURE 41-8
Acute anteroseptal MI (Q waves and ST elevations in V1–V4) with RBBB (note terminal R waves in V1).
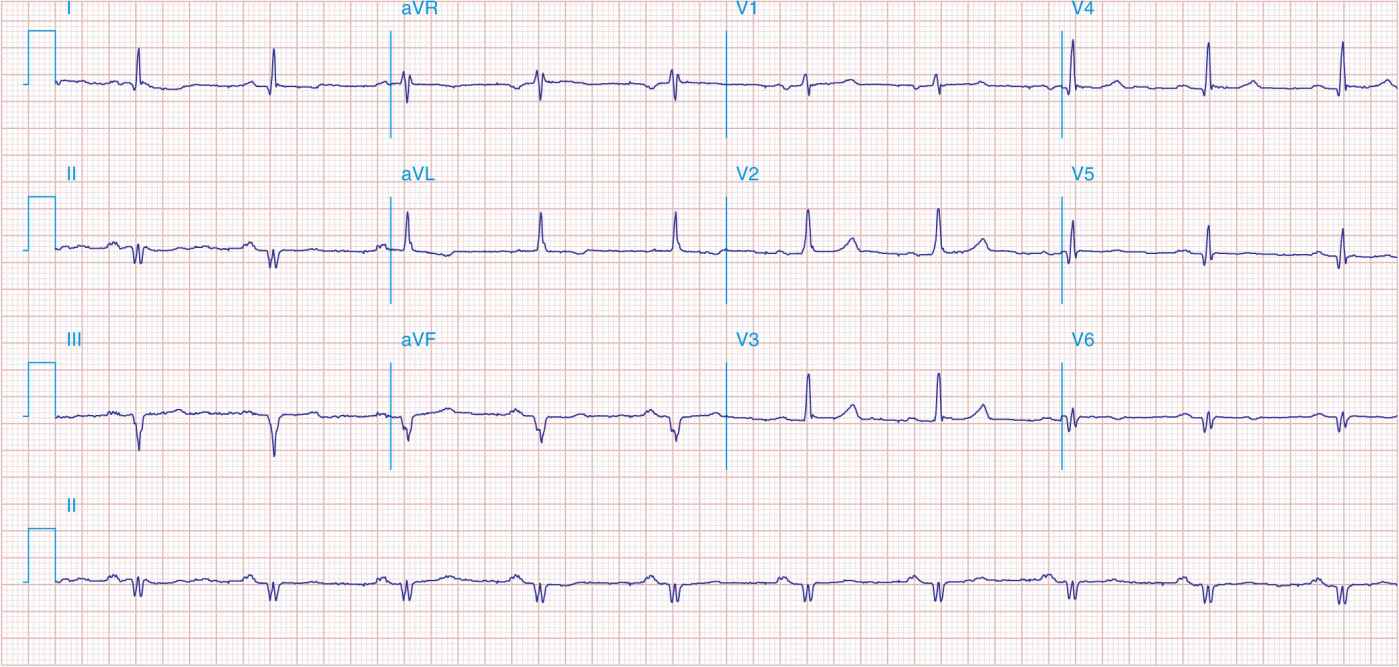
FIGURE 41-9
Extensive prior MI involving inferior-posterior-lateral wall (Q waves in leads II, III, aVF, tall R waves in V1, V2, and Q waves in V5, V6). T-wave abnormalities in leads I and aVL, V5, and V6.
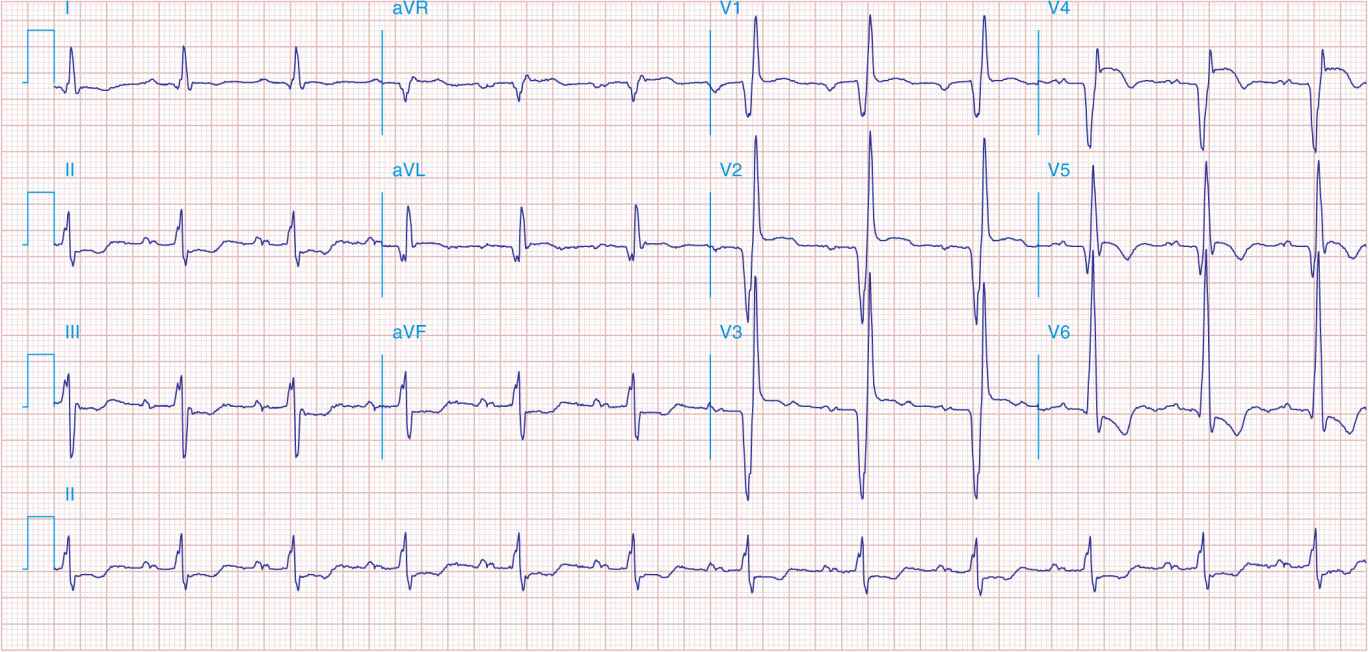
FIGURE 41-10
NSR with PR prolongation (“1st-degree AV block”), left atrial abnormality, LVH, and RBBB. Pathologic Q waves in V1–V5 and aVL with ST elevations (a chronic finding in this patient). Findings compatible with prior anterolateral MI and LV aneurysm.
Stay updated, free articles. Join our Telegram channel

Full access? Get Clinical Tree


