Chapter 10
Arterial Physiology
R. Eugene Zierler, David S. Sumner
Based on a chapter in the seventh edition by R. Eugene Zierler and David S. Sumner
Obstruction of the vessel lumen is the primary physiologic abnormality in arterial disease—whether it be the result of atherosclerosis, fibromuscular dysplasia, thrombi, emboli, dissection, trauma, or external compression. The consequences of arterial obstruction are related to the degree of narrowing and can be analyzed in terms of hemodynamic principles. Effects on the distal vascular bed depend not only on the severity of the local obstructive lesion but also on its location and the ability of the body to compensate by increasing cardiac work, dilating peripheral arterioles, and enlarging collateral pathways. Except for thrombus formation and occasional dissection, aneurysms seldom produce symptoms of obstruction. The tendency for aneurysms to rupture is determined by both intraluminal pressure and arterial diameter.
The first part of this chapter deals with the basic principles of blood flow and the hemodynamic alterations produced by arterial obstruction. Pressure and flow relationships in the normal and abnormal human circulation are then considered. Finally, some examples of how these principles can be applied to the diagnosis and treatment of arterial disease are discussed.
Arterial Hemodynamics
Basic Concepts
The flow of blood in the arterial circulation is governed by the fundamental laws of fluid dynamics. Knowledge of these principles permits better understanding of normal arterial circulation and the physiologic abnormalities associated with arterial obstruction.
Fluid Energy
Pressure is generally regarded as the force responsible for the motion of blood. Although pressure is the most obvious and most important of the forces involved, other forms of energy also play a role. Blood moves from one point to another in the vascular system in response to differences in total fluid energy (E), which consists of potential energy and kinetic energy. The potential energy component can be broken down into intravascular pressure (P) and gravitational potential energy. P represents the dynamic pressure produced by contraction of the heart, hydrostatic pressure, and the static filling pressure of the resting circulation.1 Hydrostatic pressure is proportional to the weight of the blood and is represented by the following equation:
 (10.1)
where ρ is the density of blood (about 1.056 g/cm2), g is acceleration secondary to gravity (980 cm/sec2), and h is the distance in centimeters above a given reference point. In the human body, this reference point is usually assumed to be at the level of the right atrium. Hydrostatic pressure may be large in relation to dynamic pressure. For example, at ankle level in a standing man 5 feet 8 inches tall, this pressure is about 89 mm Hg. In contrast, static filling pressure is low, usually about 7 mm Hg.2 This pressure is related to the elasticity of the vascular walls and the volume of blood contained within them.
Gravitational potential energy (+ρgh) is calculated the same way as hydrostatic pressure but has an opposite sign. It represents the ability of a volume of blood to do work because of its elevation above a given reference point. In most circumstances, gravitational potential energy and hydrostatic pressure cancel each other out. Finally, kinetic energy represents the ability of blood to do work because of its motion ( ).
).
Putting these values together allows an expression for total fluid energy per unit volume of blood (E) to be obtained:
 (10.2)
where E is in ergs per cubic centimeter and v refers to the velocity (cm/sec) of a particle of blood moving steadily in a straight line.
Bernoulli’s Principle
When fluid flows steadily (without accelerating or decelerating) from one point in a system to another, its total energy content along any given streamline remains constant, provided that there are no frictional losses:
 (10.3)
The previous equation, the one-dimensional Bernoulli equation, is derivable from Newton’s laws of motion and is a fundamental formula in fluid mechanics.3
Bernoulli’s principle establishes a relationship among kinetic energy, gravitational potential energy, and intravascular pressure in a frictionless fluid system. Several apparent paradoxes of fluid flow are explained by this equation. For example, in Figure 10-1A, fluid with the density of blood enters the top of an inclined tube at a pressure of 100 mm Hg and flows out at a pressure of 178 mm Hg. Thus, fluid moves against a pressure gradient from a point of low pressure to a point where its pressure is higher. However, the total fluid energy remains constant because the gravitational potential energy decreases by an amount exactly equal to the increase in pressure. This situation is analogous to that in the arteries of a standing person, in whom blood pressure at ankle level is greater than blood pressure in the aortic arch.
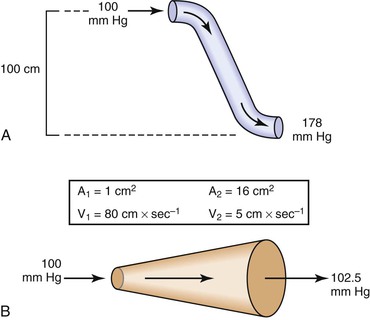
Figure 10-1 A, Effect of vertical height on pressure in a frictionless fluid flowing downhill. B, Effect of increasing cross-sectional area on pressure in a frictionless fluid system. A1 and A2, areas at the entrance and exit of the system, respectively; V1 and V2, velocities at the entrance and exit of the system, respectively.
In Figure 10-1B, fluid flows through a horizontal tube while the cross-sectional area increases 16 times. This results in a proportional decrease in fluid velocity. Again, the fluid moves against a pressure gradient, the pressure at the exit of the tube being 2.5 mm Hg greater than the pressure at the entrance to the tube. The total fluid energy remains the same because of the decrease in kinetic energy. This phenomenon is seldom observed in the human circulation because associated energy losses effectively mask the slight rise in pressure.
Intravascular pressure measurements made with catheters are subject to error related to the effect of kinetic energy. If the catheter faces the oncoming blood end-on, the pressure recorded is too high by a factor of  . On the other hand, if the catheter faces downstream, the recorded pressure is too low by the same factor. At a velocity of 50 cm/sec, these errors would equal about 1.0 mm Hg and would be inconsequential in a high-pressure system such as the aorta. Nevertheless, they could be of importance in low-pressure, high-flow systems such as the vena cava and pulmonary artery.4,5
Poiseuille’s Law
The conditions required to fulfill the rigid specifications of the Bernoulli equation are theoretical and never achieved in the human circulation or in any other real fluid system. Mechanical energy is always lost (converted to heat) in the movement of blood or fluid from one point to another. Energy loss in the peripheral circulation is related primarily to the viscosity of blood and its inertia. In fluids, viscosity can be defined as the friction between contiguous layers of fluid. This friction is due to strong intermolecular attractions between fluid layers. The equation known as Poiseuille’s law describes the viscous energy losses occurring in an idealized situation, as follows:
 (10.4)
where P1 − P2 represents the drop in potential energy (dyn/cm2) between two points separated by the distance L (cm), Q is the volume flow (cm3/sec), and  is the mean flow velocity (cm/sec) across a tube with an inside radius of r (cm). The coefficient of viscosity, η, is expressed in poise (dyn/sec/cm2).
Under the conditions specified by Poiseuille’s law, the velocities of each concentric layer of fluid describe a parabolic profile, with velocity being highest in the center of the stream and becoming progressively lower toward the vessel wall. The layer of fluid or blood in contact with the wall is stationary. The ratio of the change in velocity (Δv) to the change in the radius (Δr) between each cylindrical layer is known as the shear rate (D), the force required to “shear” the fluid is known as shear stress (τ), and the coefficient of viscosity (η) is the ratio of shear stress to shear rate:
 (10.5)
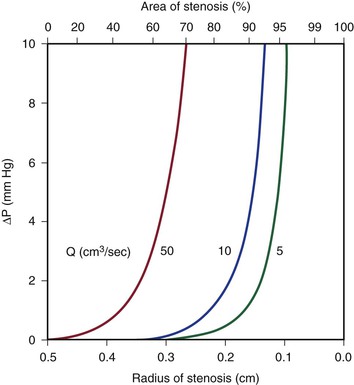
Because energy losses are inversely proportional to the fourth power of the radius (Eq. 10.4), graphs based on Poiseuille’s law are sharply curved. Figure 10-2 shows that as the diameter of a vessel or conduit is reduced, there is little effect on the pressure gradient until a certain degree of narrowing is reached; beyond that point, further reductions in diameter cause the pressure gradient to rise rapidly. Although increasing the flow rate shifts the curves to the left and linearly increases the pressure gradient at any given radius, these effects are much less marked than those caused by changes in radius.
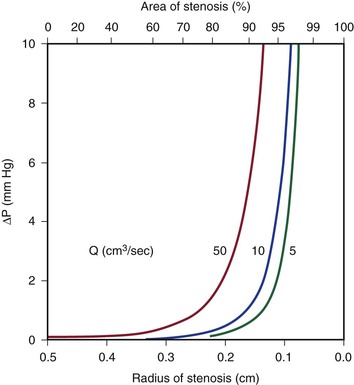
Figure 10-2 Curves derived from Poiseuille’s law (Eq. 10.4). The stenotic segment is assumed to be 1.0 cm long. Viscosity is 0.035 poise. ΔP, Pressure gradient.
Poiseuille’s law applies only to steady (nonpulsatile), laminar flow in a straight cylindrical tube with rigid walls. The tube must also be long enough to allow a parabolic flow profile to develop. The “entrance length” required to develop a parabolic profile depends on the radius of the tube and the Reynolds number (Re), which is described later in this chapter. Although velocity profiles in smaller arteries (e.g., radial, mesenteric) may be essentially parabolic, in larger arteries (e.g., iliac, common carotid), the entrance length approaches the length of the artery, and flow profiles remain blunt. The flow profile in the human abdominal aorta is blunted.6,7 Entrance effects are only one of many factors modulating the velocity profile. At branch points or in regions where the vessel curves, the momentum of blood near one wall exceeds that on the other side. As a result, velocity profiles are skewed toward one wall, and complicated helical flow patterns develop.8,9 Thus, the strict conditions required by Poiseuille’s law are seldom, if ever, present in the human circulation. In addition, energy losses during fluid flow are almost never totally viscous, and in many situations viscous losses are less significant than energy losses related to inertia.
Inertia
Inertial energy losses depend on the mass or density of the blood (ρ) and on the square of the flow velocity (v):
 (10.6)
Because ρ is a constant, the quantity that changes in this equation is v. Changes in velocity occur when blood is accelerated or decelerated in pulsatile flow and when blood passes from a large-lumen vessel (where the velocity is low) to a small-lumen vessel (where the velocity is high), or vice versa. In addition, v is a vector quantity, so any change in direction of flow also represents an acceleration.
Flow changes direction whenever the blood vessel forms a curve and at all bifurcations and branch points. There is also a change in direction when the blood vessel gradually narrows or in pathologic situations characterized by sudden narrowing and expansion of the flow stream, as in atherosclerotic stenosis and post-stenotic dilatation. Moreover, as a result of the expansile nature of the arterial wall, velocity vectors must be directed outward during the systolic portion of the pressure wave and inward during the diastolic portion.
According to the equation of continuity (conservation of mass), the product of flow velocity and cross-sectional area (A) is the same at any point along a tube, provided that there are no intervening branches:
 (10.7)
Because kinetic energy losses depend on the square of the velocity (Eq. 10.6) and because the velocity in a stenotic segment is inversely proportional to the square of its radius, kinetic energy losses—like those attributable to viscosity—are inversely proportional to the fourth power of the radius (see Eq. 10.4). As illustrated in Figure 10-3, the resulting curves display little sensitivity to reduction in radius until a certain point is reached, beyond which energy losses increase rapidly. Increasing the velocity of flow has a more marked effect on kinetic energy losses than it does on viscous losses (compare Figures 10-2 and 10-3). This conclusion follows from the fact that the velocity term is squared in Equation 10.6 but enters Equation 10.4 only in the first power.
Turbulence
Turbulence is a flow pattern characterized by random velocity vectors that result in an overall reduction in total fluid energy. The point at which flow changes from laminar to turbulent is best defined in terms of a dimensionless quantity known as the Reynolds number, Re. Re is proportional to the ratio of inertial forces to viscous forces acting on the fluid, as follows:
 (10.8)
where d is the diameter of the conduit, ρ is the density of blood,  is mean flow velocity, and η is viscosity. When Re exceeds 2000, local disturbances in the laminar flow pattern result in fully developed turbulence. With Re less than 2000, local disturbances are damped out by the viscous forces. Because Re values are well below 2000 in most peripheral arteries, turbulence is unlikely to occur under normal circumstances. However, turbulence does appear to develop in the ascending aorta during the peak systolic ejection phase and may persist during deceleration.10 These turbulent flashes are short lived, but the pattern of blood flow in a large portion of the circulation may be characterized as “disturbed.”11,12 Energy losses calculated with the use of turbulent friction factors may more closely approximate experimental results than losses calculated with Poiseuille’s law.13
Resistance
The concept of hemodynamic resistance is essential for understanding the physiology of arterial occlusive disease. When hemodynamic resistance is defined simply as the ratio of the energy drop between two points along a blood vessel (E1 − E2) to the mean blood flow in the vessel (Q), the equation for hemodynamic resistance (R) is analogous to Ohm’s law in electrical circuits:
 (10.9)
It is often convenient to drop the kinetic energy term ( ) in Equation 10.2 because it seldom contributes appreciably to total energy. In addition, calculations are simplified if the assumption can be made that the subject is supine. This assumption permits the gravitational terms (ρgh) to cancel out. Hence, resistance can be approximated by the ratio of the drop in pressure (P1 − P2) to flow (Eq. 10.9).
Unlike electrical resistance, hemodynamic resistance does not remain constant over a wide range of flow rates. The minimal possible resistance is given by Poiseuille’s law and is related to viscous effects:
 (10.10)
Because of additional energy losses related to inertial effects (acceleration, disturbed flow, and turbulence), all of which are a function of  , the resistance of a given vascular segment tends to increase as flow velocity increases, provided that there is no concomitant change in vascular diameter (Figs. 10-4 and 10-5). The dimensions of hemodynamic resistance are dyn × cm−5 × sec. However, it is usually more convenient to use the peripheral resistance unit (PRU), which is millimeters of mercury per milliliter per minute. Thus, 1 PRU is approximately equal to 8 × 10⁴ dyn × cm−5 × sec.
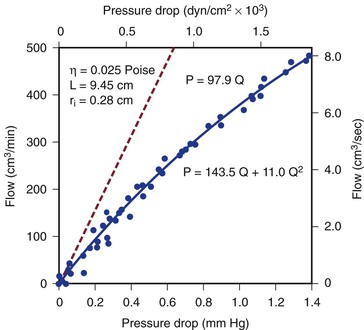
Figure 10-4 Pressure drop across a 9.45-cm length (L) of canine femoral artery at varying flow rates. Differential pressure was measured with a specially designed transducer (D. E. Hokanson, Bellevue, Washington) and flow with an electromagnetic flowmeter. Flow rate was varied by constriction of a distally located arteriovenous fistula. The line that fits the experimental data best (solid line) has both a linear term and a squared term, corresponding to Poiseuille’s law plus kinetic energy losses. The pressure-flow curve predicted from Poiseuille’s law (dashed line) depicts much less energy loss than is actually the case. η, Viscosity; P, pressure; ri, inside radius; Q, flow.
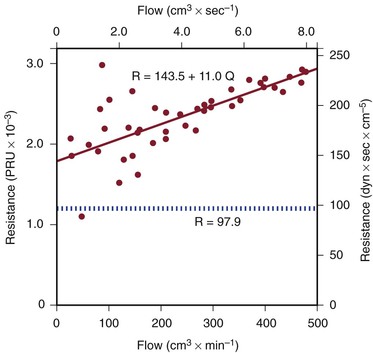
Figure 10-5 Resistance derived from the pressure-flow curve in Figure 10-4. The constant resistance predicted by Poiseuille’s law is depicted by the dotted line. Note that resistance (R) rises with increasing flow. PRU, Peripheral resistance unit.
Pulsatile Flow
Applying any of these equations to pulsatile blood flow is very difficult. For example, during steady flow, kinetic energy can be estimated from the square of the space-averaged velocity of blood flowing past a given point (see Eq. 10.6). During pulsatile flow, a more complicated expression must be used that integrates the instantaneous product of mass flux and the square of the velocity. This method sometimes predicts kinetic energies that are 10 times as great as would be suspected on the basis of the average velocity of blood flow.14,15
In addition, the shape of the velocity profile must be known before the spatially averaged velocity across the lumen of a blood vessel can be used to estimate loss of kinetic energy (Fig. 10-6). When the profile is nearly flat, as it is with turbulent flow or when the site of flow measurement is within the entrance length of a blood vessel, k in Equation 10.6 will be 1.06.3 When the profile is parabolic, k becomes 2.0. With pulsatile flow, a parabolic profile is never really attained (Fig. 10-7).16 As mentioned previously, in larger blood vessels such as the aorta, the velocity profile may be quite flat or blunt and is often skewed. In smaller arteries, a parabolic profile may be approached, especially during the peak forward phase of the flow pulse.
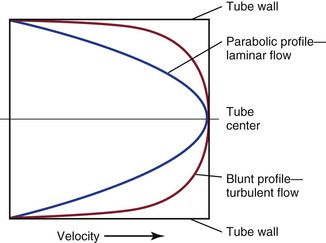
Figure 10-6 Velocity profiles of steady laminar flow and turbulent flow. Velocity is zero at the tube wall and reaches its peak value in the center. A blunt profile is also typical of flow within the entrance length of a vessel.
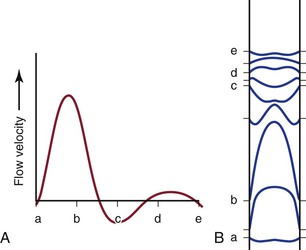
Figure 10-7 Various phases of a typical femoral arterial flow pulse (A) and their velocity profiles (B). Lower case letters indicate corresponding points in the pulse cycle. In all profiles, the velocity at the wall is zero. At point b, forward flow is nearly maximal and the profile is almost parabolic. At the next point, flow near the wall is reversed but that in the center continues forward. Several profiles, both forward and reverse, are blunt. (Adapted from McDonald DA: Blood flow in arteries, ed 2, Baltimore, 1974, Williams & Wilkins.)
All these complexities merely add to the energy losses that occur in the circulation. Thus, for a given level of blood flow, the pressure (energy) drop between any two points in the arterial tree may be several times that predicted by Poiseuille’s law (see Eq. 10.4).17–19 Furthermore, the relationship between pressure gradient and flow is not linear but defines a curve that is concave to the pressure axis (see Fig. 10-4). These nonlinearities are all functions of inertial losses and represent the effect of the v2 term. Thus, Poiseuille’s law cannot be used to predict pressure-flow relationships in the arterial tree, but it can be used to define the minimal energy losses that can be expected under any given flow situation.
Arterial Stenosis
Energy Losses Associated with Stenoses
Most of the abnormal energy losses in the arterial system result from stenosis or obstruction of the vascular lumen. In accordance with Poiseuille’s law (see Eqs. 10.4 and 10.10), the viscous energy losses within a stenotic segment are inversely proportional to the fourth power of the radius at the stenosis and are directly proportional to the length of the stenosis (see Fig. 10-2). Therefore, the radius of a stenosis is much more significant than its length.20–23 In addition, inertial energy losses are encountered at both the entrance to and the exit from a stenosis.14,23–25 The magnitude of these losses varies greatly with the shape of the entrance and exit, being much less for gradual tapering of the lumen than for an abrupt change. Moreover, the energy losses associated with asymmetrical stenoses exceed those associated with axisymmetrical stenoses, even when the lumen is compromised to the same extent.26 Although energy losses at the entrance can be appreciable, they are usually greater at the exit, where much of the excess kinetic energy resulting from the increased fluid velocity within the stenosis is dissipated in a turbulent jet. Figure 10-8 illustrates these concepts and emphasizes the relatively small contribution of viscous losses to the total decrease in fluid energy produced by the stenosis. Even if the obstruction were very short or diaphragm-like (L in Eq. 10.4 approaching zero), the energy losses would still be 85% of those with a 1-cm-long stenosis; in other words, most of the energy losses in this situation can be attributed to inertial effects.
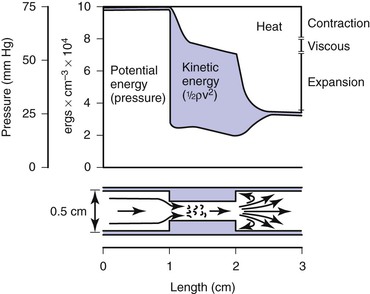
Figure 10-8 Diagram illustrating energy losses experienced by blood passing through a stenosis 1 cm long. Flow is assumed to be unidirectional and steady. Very little of the total energy loss is attributable to “viscous” losses. Thus, applications of Poiseuille’s law greatly underestimate the drop in pressure across an arterial stenosis.
Critical Stenosis
How severe does a stenosis have to be to produce a measurable pressure gradient or a decrease in blood flow? This is an important question for clinicians who attempt to assess the severity of an arterial obstruction from its angiographic appearance. Experimentally, appreciable changes in pressure and flow do not occur until the cross-sectional area of a vessel has been reduced by more than 75%.27,28 Assuming that the obstructing lesion is symmetrical, this reduction in cross-sectional area corresponds to at least a 50% reduction in diameter. The degree of narrowing at which pressure and flow begin to be affected has been called the “critical stenosis.”
Energy losses associated with arterial lesions are inversely proportional to the fourth power of the radius of the stenosis (see Eq. 10.4) and to the fourth power of the ratio of the radius of the stenosis to that of the nonstenotic segment. Because these are exponential functions, graphs relating energy losses across a stenosis to the percentage reduction in cross-sectional area are sharply curved, thus providing theoretical support for the concept of critical stenosis (Fig. 10-9).14,20,23,25,29
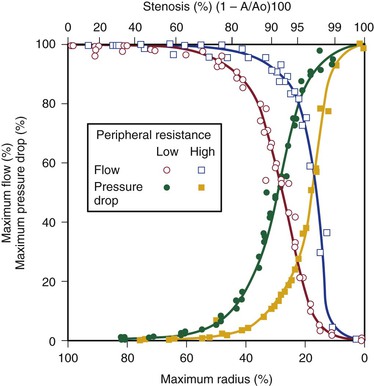
Figure 10-9 Relationship of pressure and flow to the degree of stenosis in a canine femoral artery. When peripheral resistance is high, the curves are shifted to the right. The percentage change in flow through the stenosis is essentially a mirror image of the percentage maximal drop in pressure across the stenosis.
Energy losses across stenotic segments also depend on the velocity of blood flow (see Eq. 10.4 and Figs. 10-4 and 10-5). Significant drops in pressure and flow occur with less severe narrowing in high-flow (low-resistance) systems than in low-flow systems.27,28,30,31 Consequently, critical stenosis varies with the resistance of the runoff bed. When peripheral resistance is low, as in the carotid, renal, and coronary systems, critical stenosis may be reached with less narrowing of the lumen than in higher-resistance arterial systems, such as the resting lower extremity. Even in the leg, lowering peripheral resistance sufficiently with exercise or reactive hyperemia may cause a stenosis that is noncritical at rest to become critical.32–34 This process explains the common clinical observation that an iliac artery lesion may severely restrict the patient during exercise even though it causes no symptoms at rest and may not appear particularly significant on arteriography.35,36
Precise attempts to relate pressure and flow restriction to percentage stenosis have been frustrated by the irregular geometry of arterial lesions and by the nonlinearities introduced by pulsatile blood flow. For practical purposes, any lesion that potentially decreases the arterial lumen by about 75% cross-sectional area or 50% diameter must be suspect, and its hemodynamic significance must be determined by objective physiologic tests.
Length of Stenosis and Stenoses in Series
When a series of stenotic lesions are found in a single unbranched arterial segment, the question arises whether repair of one of the lesions will improve blood flow significantly. This issue is particularly pertinent when one of the lesions is in a relatively inaccessible location, such as stenosis at the origin of the internal carotid artery combined with a similar stenosis in the ipsilateral carotid siphon. The length of a stenosis primarily affects energy losses related to viscosity and enters Poiseuille’s equation (see Eq. 10.4) only in the first power, whereas the radius of the stenosis is raised to the fourth power. Therefore, the effect of a change in length on viscous energy losses is far less than the effect of a change in radius. For example, doubling the length of a stenosis would merely double the viscous energy losses, but reducing the radius of the lumen by half would increase the losses by a factor of 16. In addition, inertial effects at the exit are independent of the length of the stenosis and are related to the fourth power of the ratio of the diameters of the nonstenosed and stenosed portions of the vessel. On the basis of these considerations, the length of a stenosis is far less important than its diameter.20,21,23,37,38
Because entrance and exit effects contribute a large portion of the resistance offered by a stenosis, doubling the length of a lesion without changing its diameter would not double its resistance (see Fig. 10-8). In contrast, the total resistance of two separate lesions of equal length and diameter is approximately double that of the individual lesions because entrance and exit effects occur at each of the stenoses.39,40 Consequently, separate stenoses of equal diameter are of more significance than a single stenosis of the same diameter whose length equals the sum of the lengths of the two shorter lesions.
When two stenoses of unequal diameter are in series, the tighter of the two has the greater effect on resistance. Total resistance is not affected by the sequence of the stenoses; it makes no difference whether the more severe lesion is proximal or distal.38 The resistance of stenoses in series is roughly additive, although the cumulative effect may be somewhat less than would be anticipated on the basis of the sum of the individual resistances. Therefore, multiple noncritical stenoses may act as a single critical stenosis.39,40 When two stenotic lesions are of similar caliber, removal of one provides only a modest improvement in blood flow. If the stenoses are of unequal caliber, removal of the less severe lesion results in little increase in blood flow, whereas removal of the more severe stenosis may provide significant improvement.
These principles apply only to unbranched arteries; they do not apply to the situation in which the proximal lesion is in an artery feeding a collateral bed that parallels the distal lesion. Thus, angioplasty and stenting of a stenotic iliac artery is usually beneficial even when the superficial femoral artery is completely occluded. In this case, the profunda femoris artery carries most of the blood to the lower part of the leg, and removal of the proximal iliac lesion will improve perfusion pressure to the collateral bed supplied by the profunda femoris artery.36,41–44
Arterial Flow Patterns in the Human Circulation
Normal Arteries
Pressure and Flow
Under resting conditions, blood flow to the normal human leg averages about 300 to 400 mL/min.45–48 Calf blood flow is in the range of 1.5 to 6.5 mL per gram of calf per minute, with an average value of about 3.5 mL/g/min.49,50 Blood flow to the gastrocnemius muscle is usually about 2.0 mL/g/min.51 This rate of flow is more than adequate to supply all the nutritional needs of the resting limb. When blood flow is restored to a normal limb that has been rendered ischemic for 5 minutes by means of a proximally placed pneumatic tourniquet, the peripheral arteriolar bed becomes vasodilated. The resulting “reactive hyperemia” reaches peak values of 30 to 40 mL/g/min and then rapidly subsides to resting levels within a minute or two.31,50,52 Moderate exercise normally increases total leg blood flow by 5 to 10 times.45,53,54 Muscle blood flow rises to 30 ± 14 mL/g/min and reaches 70 mL/g/min during strenuous exercise (Fig. 10-10).53 On cessation of exercise, blood flow decreases rapidly, often reaching pre-exercise levels within 1 to 5 minutes.
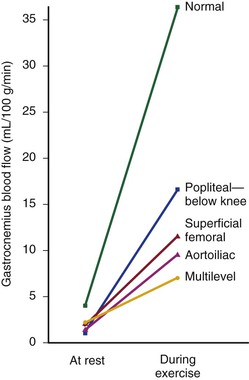
Figure 10-10 Mean blood flow at rest and after exercise in normal subjects and in patients with arteriosclerosis obliterans. The locations of occlusion are indicated. Blood flow was measured in the gastrocnemius muscle via the xenon-133 clearance technique. (Data from Wolf EA, et al: Correlation between nutritive blood flow and pressure in limbs of patients with intermittent claudication. Surg Forum 23:238, 1972.)
The mean drop in blood pressure across normal arteries from the heart to the ankle is only a few millimeters of mercury.4 As the pressure wave travels distally, systolic pressure increases, diastolic pressure decreases, and the pulse pressure widens (Fig. 10-11).55 These pressure changes are due to reflection of waves from the high-resistance peripheral arteriolar bed. Under resting conditions, ankle systolic pressure exceeds brachial systolic pressure in normal individuals by about 10% (Fig. 10-12).56 This explains why the normal resting ankle-brachial pressure index is greater than 1.0 (see Chapter 15). In normal extremities, moderate exercise produces little or no drop in systolic pressure at ankle level. With very strenuous exercise, the pressure may fall a few millimeters of mercury, but it rapidly recovers within several minutes.57 These findings contrast sharply with the extreme drops in ankle pressure that follow exercise in limbs with occlusive arterial disease, as illustrated in Figure 10-12.
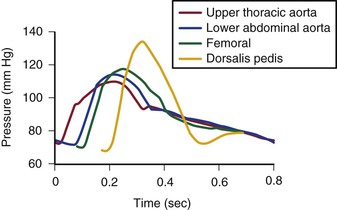
Figure 10-11 Pressure pulse contours in a normal subject. (From Strandness DE, Jr, et al: Hemodynamics for surgeons, New York, 1975, Grune & Stratton; redrawn from Remington JW, Wood EH: Formation of peripheral pulse contour in man. J Appl Physiol 9:433, 1956.)
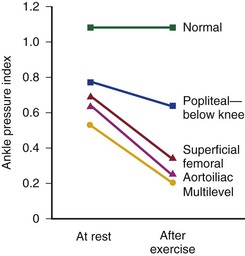
Figure 10-12 Mean ankle pressure indices (ankle systolic blood pressure/brachial systolic blood pressure) at rest and after exercise in normal subjects and in patients with arteriosclerosis obliterans. The locations of occlusion are indicated. (Data from Wolf EA, Jr, et al: Correlation between nutritive blood flow and pressure in limbs of patients with intermittent claudication. Surg Forum 23:238, 1972.)
Control of Peripheral Vascular Resistance
Blood vessels in the skin are well supplied with sympathetic vasoconstrictor fibers, especially in the terminal portions such as the fingers, hands, and feet. Therefore, most reflex vasodilatation of cutaneous vessels results from withdrawal of sympathetic impulses.58 In contrast, blood vessels within skeletal muscles are innervated by both vasodilator and vasoconstrictor fibers. The former respond to emotional stress and the latter to postural changes.58 However, these actions are easily overcome by the powerful vasodilator effect of locally produced metabolites that accumulate during exercise or ischemia.59,60 Exercise is perhaps the single best vasodilator of resistance vessels within skeletal muscle.45,53,54 Arteriolar constriction also occurs in response to dependency (the venoarterial reflex).61 By restricting arterial inflow, this reflex serves to limit the increase in venous blood volume that accompanies elevated hydrostatic pressure.
“Autoregulation” is a term used to describe the ability of most vascular beds to maintain a constant level of blood flow over a wide range of perfusion pressures.62–65 It occurs when the resistance vessels constrict in response to an increase in blood pressure and dilate in response to a decrease. The mechanism of autoregulation appears to involve a myogenic response to stretch that is modified by local chemical factors and sympathetic control.66 Autoregulation can compensate for a drop in perfusion pressure only until it falls below a critical level (e.g., about 20 to 30 mm Hg for skeletal muscle and about 50 to 60 mm Hg for the brain). With pressures below this level, normal blood flow is no longer maintained, and flow responds passively to changes in perfusion pressure (Fig. 10-13).
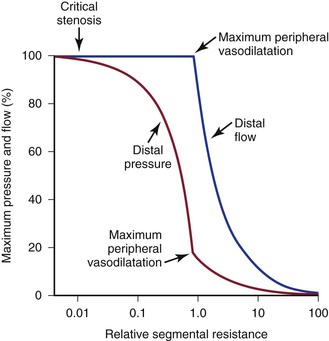
Figure 10-13 Although blood pressure distal to a critical stenosis falls progressively with growing severity of the stenosis, autoregulation maintains normal blood flow to the tissues until maximum peripheral vasodilatation is reached. Beyond this point, pressure and flow are linearly related; increasing stenosis results in marked decreases in both pressure and flow, and the tissues become ischemic. (Compare with Figure 10-9.) (Redrawn from Sumner DS: Correlation of lesion configuration with functional significance. In Bond MG, et al, editors: Clinical diagnosis of atherosclerosis: quantitative methods of evaluation, New York, 1983, Springer-Verlag.)
Stay updated, free articles. Join our Telegram channel

Full access? Get Clinical Tree


