In 2004 the British Cardiac Society redefined myocardial infarction by cardiac troponin I (cTnI) concentration: ≤0.06 μg/L (unstable angina), >0.06 to <0.5 μg/L (myocardial necrosis), and ≥0.5 μg/L (myocardial infarction). We investigated the effects of this classification on all-cause mortality in 1,285 patients from the Evaluation of the Methods and Management of Acute Coronary Events (EMMACE)-2 registry. There were 528 deaths (6.6-year all-cause mortality 41.1%). Survival was greatest in the cTnI ≤0.06-μg/L subgroup at 30 days (p = 0.005), 6 months (p = 0.015), 1 year (p = 0.002), and 6.6 years (p = 0.045). After adjustment there was no significant difference in survival between the cTnI >0.06- to <0.5-μg/L and ≥0.5-μg/L subgroups. Increased mortality (hazard ratio, 95% confidence interval) was associated with ages 70 to 80 years (2.58, 1.17 to 3.91) and >80 years (3.30, 3.50 to 5.06), peripheral vascular disease (1.50, 1.16 to 1.94), heart failure (1.36, 1.05 to 1.83), diabetes mellitus (1.68, 1.36 to 2.07), severe left ventricular systolic dysfunction (1.50, 1.00 to 2.21), and creatinine per 10 μmol/L (1.65, 1.02 to 1.08), whereas ages 50 to 60 years (0.55, 0.32 to 0.96), β blockers (0.53, 0.44 to 0.64), aspirin (0.80 0.65 to 0.99), angiotensin-converting enzyme inhibitors (0.67, 0.56 to 0.80), statins (0.73, 0.59 to 0.90), and revascularization (0.33, 0.12 to 0.92) were associated with a lower risk of death. In conclusion, although quantitative evaluation of cTnI concentration in patients with acute coronary syndrome with cTnI >0.06 μg/L was associated with no added prognostic information, the dichotomization of patients by cTnI status (“positive” and “negative”) facilitates acute coronary syndrome risk stratification.
Serum troponin concentration is widely recognized as the preferred biomarker in the risk stratification of acute coronary syndromes (ACSs). In the United Kingdom until 2007, when acute myocardial infarction (AMI) was universally defined, the spectrum of ACSs was transitionally categorized by the British Cardiac Society (BCS) into 3 subgroups: (1) ACS with unstable angina, (2) ACS with myocyte necrosis, and (3) ACS with clinical MI. These groups corresponded to cardiac troponin I (cTnI) levels measured with the Beckman Coulter AccuTnI at ≤0.06 μg/L (troponin “negative”), >0.06 to <0.5 μg/L, and ≥0.5 μg/L, respectively. Accordingly, management of ACSs was influenced by this classification—patients with myocyte necrosis were less likely to receive evidence-based therapies because at the time those with clinical MI (cTnI ≥0.5 μg/L) were judged to be at the highest mortality risk. This prognostic differential appeared to extend to only 30 days. Our previous work (using data from the Evaluation of the Methods and Management of Acute Coronary Events [EMMACE]-2 study) demonstrated that despite higher 30-day mortality for MI, 6-month mortality rates for patients with myocardial necrosis (cTnI >0.06 to <0.5 μg/L) and MI (cTnI ≥0.5 μg/L) troponin groups were similar—thus suggesting an “ACS mortality lag time.” We report on the survival over a median of 6.2 years of EMMACE-2 patients stratified by the 3 BCS subgroups.
Methods
Over 6 months (April 28 through October 28, 2003) ACS cases were identified from the 11 EMMACE-2 hospitals. Patients with confirmed cases of ACS (after evaluation of medical records, electrocardiograms, and results of cardiac troponin and creatine kinase assays) were identified and recruited into the study. Patients with potential ACS were identified from coronary care unit registers and from biochemistry lists of requests for cardiac troponin and creatine kinase measurements. All patients were enrolled in the study regardless of age or medical or surgical specialty. The study was approved by a multicenter research ethics committee and the local research ethics committee from each hospital. Patients provided written consent for evaluation of their medical notes, monitoring of their health status through the Office of National Statistics, and storage of a blood sample (taken routinely 12 to 24 hours after onset of symptoms), and measurement of peak cTnI.
Patients were potentially eligible if they were admitted to a hospital through casualty or directly to the ward with an admission diagnosis of suspected ACS. Appropriateness of inclusion was judged by a specialist cardiology research nurse in conjunction with a cardiology research registrar (R.D. and N.K.) and taking into account the views and opinions of the attending medical team. This decision was based (1) on clinical context and (2) on the results of cardiac biomarkers. Specifically, patients were included in the study if they fulfilled a revised European Society of Cardiology/American College of Cardiology definition of MI—increased cardiac troponin concentration >10% coefficient of variation taken 12 to 24 hours after onset of symptoms or increased creatine kinase concentration >2 times the upper limit of normal accompanied by ≥1 of the following: (1) ischemic symptoms, (2) development of pathologic Q waves on electrocardiogram, (3) electrocardiographic changes indicative of ischemia, (4) delivery of primary coronary angioplasty, and (5) compatible postmortem findings. Patients were excluded if they did not provide consent or were judged not to have a diagnosis of ACS.
A 150-item case record form was completed for each patient according to a standardized operations manual and entered into a computer database. Only 1 event was included (the first ACS presentation during the recruitment window) and patients transferred to a tertiary center were counted only 1 time for the index admission. Ten experienced research nurses and 2 cardiology registrars (R.D. and N.K.) abstracted data from the medical notes. Fifty-five percent of randomly generated cases were verified by double data entry in key fields. All 11 centers were visited to confirm that screening methods and source data were adequate.
Patients were categorized into 3 BCS groups based on cTnI level according to the AccuTnI assay (Beckman Coulter, Ltd., High Wycombe, United Kingdom): (1) ≤0.06 μg/L, (2) >0.06 to <0.5 μg/L, and (3) ≥0.5 μg/L. The cTnI was biochemically analyzed with the AccuTnI assay by an immunometric technique. Cardiac troponin was measured in 6 local hospital laboratories routinely using the AccuTnI assay and at a central core laboratory (Leeds General Infirmary) for the 5 other hospitals. We used the 10% coefficient of variation for the assay, which corresponds to an AccuTnI of 0.06 μg/L.
Data were analyzed with R 2.10.1 ( http://www.r-project.org/ ). The population was described by absolute numbers, percentages with 95% confidence intervals with respect to discrete data, and medians and interquartile range or mean ± 1.96 SD for continuous variables. Groups were compared using chi-square test for categorical data and independent t test for continuous variables. Kaplan–Meier survival curves were used to compare unadjusted survival of patients (response variable time to death) in the 3 different ACS subgroups. A Cox regression model using complete cases (n = 1,285) was fitted to investigate the effect of patient characteristics and ACS subgroup on survival time. Initially we considered the following covariates: age, gender, history of AMI, angina, hypertension, cerebrovascular disease, peripheral vascular disease, chronic obstructive pulmonary disease, chronic renal failure, heart failure, diabetes mellitus, smoking status, previous percutaneous coronary intervention (PCI), previous coronary artery bypass grafting (CABG), systolic blood pressure, heart rate, electrocardiographic changes, left ventricular systolic dysfunction, admitting consultant, use of aspirin, clopidogrel, β blockers, angiotensin-converting enzyme inhibitors, statins, low-molecular-weight heparin, thrombolysis, PCI after admission, cardiac rehabilitation, creatinine, weight, and fasting glucose. Age was categorized into 4 groups: <40, 40 to 60, 60 to 80, and >80 years. Electrocardiographic changes were defined as ST-segment elevation, ST-segment depression, left bundle branch block, other abnormalities, and normal electrocardiogram. The model was refined using manual selection according to clinically and statistically significant covariates and excluded those that were colinear. Assumptions were tested for each covariate. We used a locally weighted scatterplot smoothing smoother to overcome nonlinear relations. We considered potential interactions between covariates and ACS subgroups. A log-likelihood test was used to compare survival times between groups. For all tests p values <0.05 were considered statistically significant.
Results
Of the 1,285 cases there were 177 (13.8%) with cTnI ≤0.06 μg/L, 368 (28.6%) with cTnI >0.06 to <0.5 μg/L, and 740 (57.6%) with cTnI ≥0.5 μg/L. The mean age ± SD for the cohort was 64.6 ± 21.0 years and there were 806 men (62.7%). There were 528 deaths over a total follow-up period of 9,001.3 years (maximum 6.6, median 6.2). Mortality rate at 6.6 years was 41.1%. Time to 30% mortality of all cases was 35.7 months.
Clinical characteristics of the 3 cTnI ACS subgroups are listed in Table 1 . There were a larger proportion of patients with ST-segment elevation MI and non–ST-segment elevation MI in the cTnI >0.06- to <0.5-μg/L and ≥0.5-μg/L subgroups (20.1% and 51.2% respectively, p <0.001). Except for the presence of diabetes mellitus, patients in the cTnI ≥0.5-μg/L subgroup were less likely to have co-morbidities. There were few differences in rates of prescribing of evidence-based therapies between the cTnI ≤0.06-μg/L and the >0.06- to <0.5-μg/L and ≥0.5-μg/L groups. Clopidogrel was prescribed more often at discharge in the cTnI >0.06- to <0.5-μg/L subgroup compared to the ≤0.06-μg/L subgroup (55.2% vs 35.0%, p = 0.034). Rates of PCI were significantly higher in the cTnI >0.06- to <0.5-μg/L subgroup compared to the ≤0.06-μg/L subgroup (9.6% vs 22.0%, p = 0.027) and rates of thrombolysis were higher in the cTnI ≥0.5-μg/L subgroup compared to the ≤0.06-μg/L subgroup (1.1% vs 16.4%, p <0.001).
| Covariate | Peak AccuTnI Concentration by BCS ACS Subgroup | ||||
|---|---|---|---|---|---|
| AccuTnI <0.06 μg/L | AccuTnI >0.06–<0.5 μg/L | p Value (vs AccuTnI <0.06 μg/L) | AccuTnI >0.5 μg/L | p Value (vs AccuTnI <0.06 μg/L) | |
| Number | 177 (13.8%) | 368 (28.6%) | N/A | 740 (57.6%) | N/A |
| Age (years), mean ± SD | 60.9 ± 24.2 | 65.8 ± 19.7 | 0.02 | 65.0 ± 20.7 | 0.04 |
| Men | 55.9% | 63.3% | 0.499 | 64.1% | 0.548 |
| Medical history | |||||
| Previous acute myocardial infarction | 37.9% | 32.1% | 0.489 | 23.5% | 0.067 |
| Previous angina pectoris | 58.8% | 58.2% | 0.955 | 39.6% | 0.053 |
| Hypertension | 52.0% | 44.3% | 0.433 | 42.0% | 0.305 |
| Peripheral vascular disease | 10.2% | 10.9% | 0.879 | 8.1% | 0.630 |
| Chronic obstructive pulmonary disease | 11.9% | 18.8% | 0.213 | 14.2% | 0.649 |
| Heart failure | 8.5% | 8.2% | 0.937 | 5.8% | 0.481 |
| Diabetes mellitus | 17.0% | 15.2% | 0.760 | 18.2% | 0.827 |
| Systolic blood pressure (mm Hg), mean ± SD | 144.2 ± 29.3 | 144.1 ± 30.0 | 0.982 | 141.7 ± 30.0 | 0.310 |
| Heart rate (beats/min), mean ± SD | 77.3 ± 21.1 | 85.4 ± 25.4 | <0.001 | 83.2 ± 22.7 | 0.001 |
| Treatment | |||||
| Aspirin on discharge | 78.0% | 78.5% | 0.964 | 82.3% | 0.732 |
| Clopidogrel on discharge | 35.0% | 55.2% | 0.034 | 47.2% | 0.181 |
| β Blockers on discharge | 55.9% | 60.3% | 0.684 | 69.7% | 0.218 |
| Angiotensin-converting enzyme inhibitor on discharge | 52.5% | 55.4% | 0.781 | 65.4% | 0.236 |
| Statin on discharge | 68.9% | 79.1% | 0.401 | 84.3% | 0.214 |
| Revascularization (percutaneous coronary intervention/coronary artery bypass grafting) | 9.6% | 22.0% | 0.027 | 18.7% | 0.089 |
| Thrombolysis | 1.1% | 3.5% | 0.266 | 16.4% | <0.001 |
| Investigations | |||||
| Left ventricular systolic dysfunction | |||||
| Normal | 78.5% | 75.0% | 0.776 | 64.2% | 0.230 |
| Mild | 10.2% | 12.0% | 0.704 | 16.6% | 0.213 |
| Moderate | 7.9% | 10.6% | 0.532 | 15.4% | 0.121 |
| Severe | 3.4% | 2.4% | 0.696 | 3.7% | 0.883 |
| Creatinine (μmol/L), mean ± SD | 107.6 ± 39.1 | 111.8 ± 45.3 | 0.269 | 113.8 ± 63.3 | 0.093 |
| Weight (kg), mean ± SD | 73.5 ± 16.2 | 74.0 ± 20.7 | 0.741 | 75.1 ± 17.1 | 0.248 |
| Electrocardiogram | |||||
| ST-segment elevation | 4.8% | 6.8% | 0.387 | 29.3% | <0.001 |
| ST-segment depression | 11.9% | 19.8% | 0.157 | 28.1% | 0.010 |
| Left bundle branch block | 5.6% | 6.8% | 0.746 | 6.9% | 0.726 |
| Other abnormality | 55.4% | 50.0% | 0.601 | 26.8% | 0.002 |
| Discharge diagnosis | |||||
| ST-segment elevation myocardial infarction | 0.6% | 4.1% | 0.103 | 26.4% | <0.001 |
| Non–ST-segment elevation myocardial infarction | 1.1% | 20.1% | <0.001 | 51.2% | <0.001 |
| Mortality rate | |||||
| 30 days | 1.7% | 6.0% | 0.122 | 8.4% | 0.035 |
| 1 year | 8.5% | 17.4% | 0.080 | 19.6% | 0.036 |
| 6.6 years | 36.7% | 46.2% | 0.298 | 39.6% | 0.742 |
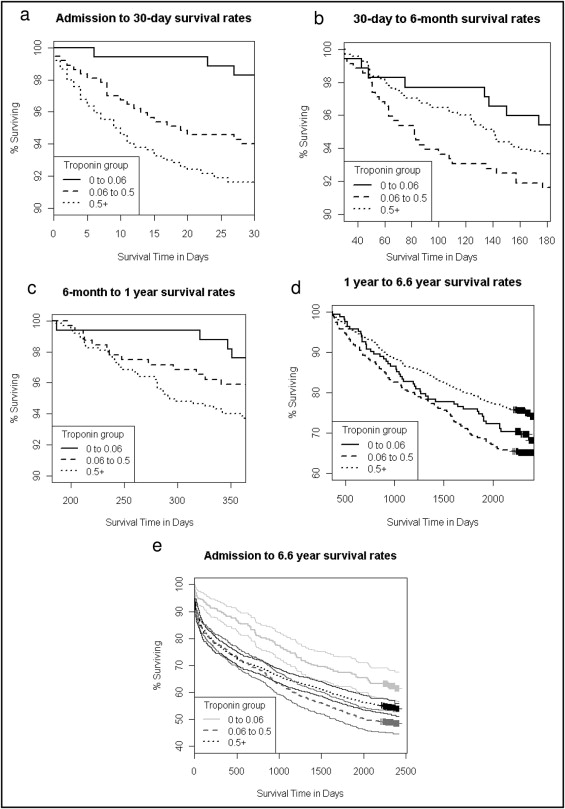
Figure 1 depicts the Kaplan–Meier curves for unadjusted events from admission to 6.6 years. Survival was greater in the cTnI ≤0.06-μg/L subgroup and worse in the cTnI >0.06- to <0.5-μg/L and ≥0.5-μg/L subgroups at 30 days (p = 0.005), 6 months (p = 0.015), 1 year (p = 0.002), and 6.6 years (p = 0.045). Although a cTnI >0.06 μg/L was associated with a significantly increased risk of death at all time points ( Table 2 ), after adjustment there were no significant differences in survival between the cTnI >0.06- to <0.5-μg/L and >0.5-μg/L subgroups compared to the cTnI ≤0.06-μg/L subgroup at 30 days, 6 months, 1 year, and 6.6 years ( Figure 2 ) . Compared to the cTnI ≥0.5-μg/L subgroup there was a difference in risk of death in the cTnI >0.06- to <0.5-μg/L group at 30 days and 1 year but not at 6 months or 6.6 years ( Figure 2 ). When survival (adjusted for covariates listed in Figure 2 ) was regressed on cTnI (as a continuous variable), no significant effect was identified for patients with ACS and a cTnI level >0.06 μg/L.