Implantable loop recorders have been developed for long-term monitoring of cardiac arrhythmia, but their accuracy for atrial fibrillation (AF) detection is unsatisfactory. We sought to develop and evaluate a simple method for detecting AF using RR intervals. The new AF detection algorithm is based on a map that plots RR intervals versus change of RR intervals (RdR). The map is divided by a grid with 25-ms resolution in 2 axes and nonempty cells are counted to classify AF and non-AF episodes. We evaluated the performance of the method using 4 PhysioNet databases: MIT-BIH AF database, MIT-BIH arrhythmia database, MIT-BIH normal sinus rhythm (NSR) database, and NSR RR interval database (total 145 patients, 1,826 hours NSR, 96 hours AF, and 11 hours other rhythms). Each record is divided into consecutive windows containing 32, 64, or 128 RR intervals. AF detection is performed for each window and classification results are compared to annotations. A window is labeled true AF if >1/2 of cycles in the window are annotated as AF or non-AF otherwise. The RdR map shows signature patterns corresponding to various heart rhythms. Optimal nonempty cell cut-off threshold for AF detection was determined by receiver operating characteristic curve analysis, which yields excellent sensitivity and specificity for window sizes 32 (94.4% and 92.6%, respectively), 64 (95.8% and 94.3%), and 128 (95.9% and 95.4%). In conclusion, a single metric derived from the RdR map can achieve robust AF detection within as few as 32 heart beats.
Many atrial fibrillation (AF) episodes are asymptomatic ; thus reliable AF detection is needed to gauge the success of antiarrhythmic therapy. Many algorithms have been developed to detect AF by assessing regularity of RR intervals. However, these algorithms are limited by their computational complexity or unsatisfactory performance. In the present report, we present a simple yet robust method for AF detection using RR intervals.
Methods
The new AF detection algorithm is based on a map that shows the scatterplot of RR intervals versus change of RR intervals (dRRs; RdR map). Denote RR i , a series of RR intervals, where RR i represents the i-th RR interval. Further denote dRR i , a series of differences between 2 adjacent RR intervals, i.e., dRR i = RR i − RR i−1 . The RdR map is constructed by plotting the RR interval series in 1 axis (e.g., x) against the dRR series in another axis (e.g., y). Number of data points in the RdR map equals the length of the dRR series, and each data point represents 1 pair of RR interval and corresponding dRR interval.
Different from the conventional Lorenz plot, which is based on RR intervals or dRR intervals, the RdR map embeds RR intervals and dRR intervals in the same plot. As a result, heart rate (RR interval) and heart rate change (dRR) information are readily available for use in cardiac rhythm classification.
As would be appreciated from the following examples ( Figure 1 ), different heart rhythms show distinctive spatial distribution patterns in their RdR maps. In particular, AF rhythm is characterized by random data points scattered in a large area of the RdR map, reflecting irregularity in RR intervals and change of RR intervals. To quantify the sparseness of data points, the RdR map is divided by a 2-dimensional grid with 25-ms resolution in the 2 axes, and nonempty cells (NECs; i.e., contain ≥1 data point) are counted. For an episode of cardiac cycles (number of data points set to 32, 64, and 128 in this study), detection of AF rhythm is made if NEC exceeds a predefined threshold. Otherwise, non-AF classification is made.

Performance of the new AF detection algorithm was evaluated using 4 annotated PhysioNet databases (MIT-BIH AF database, MIT-BIH arrhythmia database, MIT-BIH normal sinus rhythm [NSR] database, and NSR RR interval database; Table 1 ). All together, these databases include 144 patients and provide RR interval data that include 1,826 hours NSR, 96 hours AF rhythm, and 11 hours other rhythms.
| Database | Number of Records | Duration of NSR Rhythm (hours) | Duration of AF Rhythm (hours) | Duration of Other Rhythms (hours) |
|---|---|---|---|---|
| MIT-BIH normal sinus rhythm database | 18 | 384 | 0 | 0 |
| Normal sinus rhythm RR interval database | 54 | 1276 | 0 | 0 |
| MIT-BIH atrial fibrillation database | 25 | 149.1 | 93.3 | 6.6 |
| MIT-BIH arrhythmia database | 48 | 17.3 | 2.2 | 4.5 |
| Combined databases | 145 | 1826.4 | 95.5 | 11.1 |
Each patient’s record is divided into consecutive (nonoverlapping) windows containing 32, 64, or 128 RR intervals. For reference, a window is labeled a true AF episode if >1/2 of cycles in the window are annotated as AF; otherwise the episode is non-AF. For each window, AF detection is performed and the classification result (AF or non-AF) is compared to the reference (labeled based on annotations) to determine if it is true positive, false positive, true negative, or false negative. Sensitivity and specificity of AF detection are then calculated for each database and the combined databases. For each window size, receiver operating characteristic curve is obtained by changing the NEC threshold and area under the receiver operating characteristic curve is calculated. Optimal NEC cut-off threshold for AF detection is determined by searching for the shortest distance to the upper left corner.
Results
Figure 1 shows representative examples of RdR maps corresponding to various heart rhythms. In general, distribution of data points is oriented from the lower left to the upper right of the RdR map because longer RR intervals tend to have positive dRR intervals, whereas shorter RR intervals are often associated with negative dRR intervals.
Clearly different cardiac rhythms show distinctive patterns on an RdR map. AF rhythm is characterized by scattered data points distributed in a large area ( Figure 1 ), reflecting the irregularity of heart rate and change of heart rate. In contrast, other rhythms show ≥1 cluster in their RdR maps ( Figure 1 ), implying the presence of a certain degree of rate and/or rhythm regularity. Note that a single premature ventricular complex during NSR generated 3 isolated data points because of the short premature ventricular complex coupling interval, long pause after the premature ventricular complex, and the following return to normal RR interval ( Figure 1 ). Similarly, 3 additional clusters are generated in ventricular trigeminy rhythm, which has multiple “short–long–normal” cycles ( Figure 1 ). In contrast, persistent ventricular bigeminy has a signature pattern of dual clusters because of the repetitive short–long sequence ( Figure 1 ).
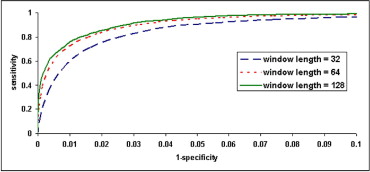
Calculated from the combined databases, Figure 2 shows AF detection receiver operating characteristic curves corresponding to 3 different window sizes (32, 64, and 128) by changing the NEC cut-off threshold. Areas under receiver operating characteristic curves are 0.978, 0.986, and 0.989 for the 3 window sizes, respectively. As expected, larger window size yields more robust AF detection. Optimal NEC cut-off thresholds were 23, 40, and 65 corresponding to window sizes 32, 64, and 128, respectively. Using optimal NEC cut-off threshold for each window size, Table 2 presents AF detection results in each dataset and combined databases. Overall, excellent sensitivity and specificity for AF detection are obtained for window sizes 32 (94.4% and 92.6%, respectively), 64 (95.8% and 94.3%), and 128 (95.9% and 95.4%).