Atrial fibrillation (AF) is common and increases stroke risk and mortality. Many knowledge gaps remain with respect to practice patterns and outcomes. Electronic medical records (EMRs) may serve as powerful research tools if AF status can be properly ascertained. We sought to develop an algorithm for identifying subjects with and without AF in the EMR and compare it to previous methods. Using a hospital network EMR (n = 5,737,846), we randomly selected 8,200 subjects seen at a large academic medical center in January 2014 to derive and validate 7 AF classification schemas (4 cases and 3 controls) to construct a composite AF algorithm. In an independent sample of 172,138 subjects, we compared this algorithm against published AF classification methods. In total, we performed manual adjudication of AF in 700 subjects. Three AF schemas (AF1, AF2, and AF4) achieved positive predictive value (PPV) >0.9. Two control schemas achieved PPV >0.9 (control 1 and control 3). A combination algorithm AF1, AF2, and AF4 (PPV 88%; 8.2% classified) outperformed published classification methods including >1 outpatient International Statistical Classification of Diseases, Ninth Revision code or 1 outpatient code with an electrocardiogram demonstrating AF (PPV 82%; 5.9% classified), ≥1 inpatient International Statistical Classification of Diseases, Ninth Revision code or electrocardiogram demonstrating AF (PPV 88%; 6.1% classified), or the intersection of these (PPV 84%; 7.4% classified). When applied simultaneously, the case and control algorithms classified 98.4% of the cohort with zero disagreement. In conclusion, we derived a parsimonious and portable algorithm to identify subjects with and without AF with high sensitivity. If broadly applied, this algorithm can provide optimal power for EMR-based AF research.
Atrial fibrillation (AF) is a prevalent arrhythmia of public health importance owing to its associated mortality, stroke risk, and economic costs. Many knowledge gaps remain with respect to AF epidemiology, practice patterns, and resource utilization. To date, research addressing these gaps has largely used cohorts, registries, and claims-related databases. In contrast, electronic medical records (EMRs) are extensive repositories of clinical information that may serve as powerful tools for facilitating AF-related research if AF status can be properly and efficiently ascertained. Although several large registry and cohort studies have relied on EMRs to study AF, identification of AF was performed either solely or primarily using billing codes, which demonstrate modest and inconsistent accuracy. Methods to identify AF in the EMR can likely be improved by supplementing billing codes with clinical information already available in most EMRs. We therefore sought to develop a simple and portable algorithm for identifying subjects with and without AF in the EMR. We then compared our algorithm to existing AF ascertainment algorithms previously used in cohort-related and claims-related studies.
Methods
We studied the Partners HealthCare EMR, which is used by 7 hospitals: Massachusetts General Hospital (MGH), Brigham and Women’s Hospital, Faulkner Hospital, McLean Hospital, Newton-Wellesley Hospital, North Shore Medical Center, and Spaulding Rehabilitation Center. This repository represents a total of 5,737,846 subjects during the period of 1979 to 2015 (date of last assessment March 31, 2015). To facilitate a manual chart review, we limited the scope to records generated by encounters at MGH for this analysis.
The Research Patient Database Query Tool (RPDR) is a large database built entirely from data contained in the Partners HealthCare EMR. This tool allows researchers to query deidentified data in the EMR to generate data sets of interest. The RPDR matching tool also allows for the generation of age- and gender-matched controls for specific data sets. Once data sets of interest are built, one can request specific types of detailed EMR data on records contained within the data sets. For this analysis, we obtained detailed data regarding (1) medications, (2) cardiology tests, (3) procedure codes (current procedural terminology format), (4) diagnoses ( International Statistical Classification of Diseases, Ninth Revision [ICD-9] codes), and (5) laboratory tests. Data within these categories served as source data for classification schema.
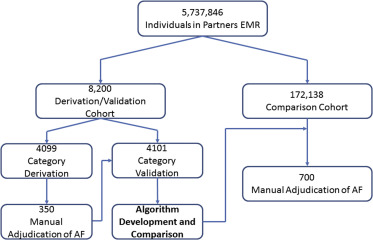
To build an initial data set, we obtained a cohort of all patients seen at MGH during January 2014 with ≥1 ICD-9 code for AF or flutter (ICD-9 codes 427.31 and 427.32) at any time in their longitudinal medical record within the EMR ( Figure 1 ). Using the RPDR matching tool, we identified age- and gender-matched individuals without any ICD-9 codes for AF. These cohorts were partitioned into derivation (n = 4,099) and validation (n = 4,101) sets.
A priori , we selected variables that we hypothesized would identify subjects with AF and that would be easily ascertained in other data sets. These variables included AF presence on an electrocardiogram (ECG), number of ECGs with AF, electrical cardioversion, AF or atrial flutter ablation, antiarrhythmic use, warfarin use, novel oral anticoagulant use, missing PR interval on an ECG, and number of ICD-9 codes for AF. We then compared pairwise agreement between each of these variables by measuring the Cohen’s κ coefficient between each variable. Agreement ranged from poor to modest between variables (−0.02 to 0.50), and therefore, we assumed that each would potentially contribute independent information to AF classification. As such, all the variables were retained in efforts to derive classification schemas.
From these 9 preselected variables, we derived 7 a priori candidate classification schemas (4 for AF cases and 3 for controls). We applied these 7 schemas to the derivation set. Each schema attempted to identify the presence or absence of AF using a combination of billing codes and clinical variables. We manually adjudicated AF in a random sample of patients chosen by each schema comprising a total of 350 subjects. Schemas meeting a prespecified threshold with a positive predictive value (PPV) >0.9 for AF or its absence were retained and internally validated in the independent validation set. For each PPV, we report the 95% CI calculated using an exact binomial method.
We then manually adjudicated AF within an independent random sample of 172,138 subjects treated at MGH in 2014 by combining AF case and control classification schemas into composite algorithms that maximized both the PPV and percent of subjects classified in the data set. During the process, we iteratively adjusted the schemas to maximize performance and reevaluated modified algorithms in independent samples after each iteration. In total, we manually adjudicated 700 cases. After identifying 2 composite algorithms that maximized both PPV and the percent of subjects classified for AF cases and controls, we applied them to the entire sample of 172,138 subjects to assess misclassification and no-classification rates.
After constructing our composite algorithms, we compared them to previously used methods of classifying AF. We applied our algorithms to 2 previously published comparator methods and 2 additional related methods. To allow for uniform assessments, all comparator algorithms were modified to include atrial flutter. Comparison methods are outlined in Table 1 . The primary metrics for assessing algorithm performance were PPV for the presence of AF (case algorithms) or for the absence of AF (control algorithms) and percentage of the total cohort classified by each algorithm. We then compared the concordance of ascertainment status between our algorithm and the best comparator with McNemar’s test.
| A. Schemas | Definition |
|---|---|
| AF1 | AF on ECG or AF/flutter ablation or cardioversion |
| AF2 | not AF1 and ≥2 ICD-9 codes for AF |
| AF3 | not AF1 and ≥5 ICD-9 codes for AF |
| AF4 | not AF1 and 0 or 1 ICD-9 code for AF and on antiarrhythmic or anticoagulant or missing PR interval |
| Control 1 | ≥1 ECG and no ECG with AF and no ICD-9 code for AF and no AF/flutter ablation and no cardioversion |
| Control 2 | not AF1 and not Control 1 and 1 ICD-9 code for AF and no antiarrhythmic and no anticoagulant |
| Control 3 | not AF1 and not Control 1 and no ICD-9 code for AF and no antiarrhythmic and no anticoagulant |
| B. Composite Algorithms | Definition |
|---|---|
| Composite AF Algorithm | AF1 or AF2 or AF4 |
| Modified AF Algorithm | AF1 or AF2 |
| Comparator 1 | >1 outpatient ICD9 code or 1 outpatient ICD9 code and ECG with AF |
| Comparator 2 | ≥1 inpatient ICD9 code or ECG with AF |
| Comparator 3 | comparator 1 or comparator 2 |
| Comparator 4 | ≥1 inpatient ICD9 code or ≥1 outpatient ICD9 code |
Results
Three AF case schemas achieved PPV >0.9 in the derivation set ( Tables 1 and 2 ): AF1 (AF on ECG, AF/flutter ablation, or cardioversion); AF2 (not AF1, ≥2 ICD-9 codes for AF); and AF4 (not AF1, 0 or 1 ICD-9 code for AF, on antiarrhythmic or anticoagulant or missing PR interval). Two control schemas achieved a PPV >0.9: control 1 (≥1 ECG, no ECG with AF, no ICD-9 code for AF, no AF/flutter ablation, and no cardioversion) and control 3 (not AF1, not control 1, no ICD-9 code for AF, no antiarrhythmic, and no anticoagulant). Each of these algorithms performed similarly in the validation set ( Table 2 ).
| A. Derivation | |||
|---|---|---|---|
| Schema | No. in Sample (%) | No. Reviewed | PPV (95% CI) |
| AF1 | 508 (12%) | 50 | 98 (94 – 100) |
| AF2 | 1,504 (37%) | 50 | 96 (91 – 100) |
| AF3 | 1,316 (32%) | 50 | 20 (09 – 31) |
| AF4 | 306 (7%) | 50 | 92 (84 – 100) |
| Control 1 | 1,153 (28%) | 50 | 96 (91 – 100) |
| Control 2 | 56 (1%) | 50 | 34 (21 – 47) |
| Control 3 | 807 (20%) | 50 | 98 (94 – 100) |
| B. Validation | ||
|---|---|---|
| Schema | No. in Sample (%) [Derivation Cohort] | No. in Sample (%) [Validation Cohort] |
| AF1 | 508 (12%) | 485 (12%) |
| AF2 | 1,504 (37%) | 1,541 (38%) |
| AF4 | 306 (7%) | 283 (7%) |
| Control 1 | 1,153 (28%) | 1,170 (29%) |
| Control 3 | 807 (20%) | 798 (19%) |
| Unclassified | – | 53 (1%) |
Schemas that achieved a PPV >0.9 (AF1, AF2, and AF4; control 1 and control 3) were combined into composite algorithms for AF classification. In the course of this process, the missing PR interval criterion was eliminated from AF4 after being found to be an unreliable indicator of AF on ECG during iterative adjustment, and stratification of ICD-9 code by inpatient status was incorporated into each remaining schema.
Compared with previously published algorithms in an independent sample (n = 172,138; 58% women, 78% white, median age 70 years), our composite case algorithm designated 14,116 subjects as having AF, corresponding to 8.2% capture of the cohort, while maintaining 88% PPV for AF ( Table 3 , Figure 2 ). A modified case algorithm comprising features associated with the highest probabilities of AF (AF1 and AF2) demonstrated a higher predictive value for AF (PPV 92%) with a small reduction in the proportion of the sample classified (7.2%). As expected, the composite algorithm PPVs in the independent cohort were slightly lower than those obtained in the derivation/validation cohorts because in the latter, subjects with AF were likely overrepresented by virtue of ascertainment. Compared to our primary algorithm, comparator 1 and comparator 3 captured less of the cohort with a lower PPV for AF. Comparator 2 captured less of the cohort with a similar PPV for AF. Comparator 4 captured a similar proportion of the cohort with a lower PPV for AF. Our control algorithm captured 90.2% of the cohort with a PPV of 98% for the absence of AF.
| Algorithm | Positive Predictive Value for AF (95% CI) | Proportion of Cohort Classified (%) |
|---|---|---|
| Composite AF algorithm (AF1 or AF2 or AF4 ≥1 inpatient ICD-9 code) ∗ | 88 (79 – 97) | 8.2 |
| Modified AF algorithm (AF1 or AF2) | 92 (81 – 98) | 7.2 |
| Comparator 1 † (>1 outpatient ICD9 code or 1 outpatient ICD9 code + ECG with AF) | 82 (71 – 93) | 5.9 |
| Comparator 2 ‡ (≥1 inpatient ICD9 code or ECG with AF) | 88 (79 – 97) | 6.1 |
| Comparator 3 (comparator 1 or comparator 2) | 84 (74 – 94) | 7.4 |
| Comparator 4 (≥1 inpatient ICD9 code or ≥1 outpatient ICD9 code) | 84 (74 – 94) | 8.2 |
Stay updated, free articles. Join our Telegram channel

Full access? Get Clinical Tree


