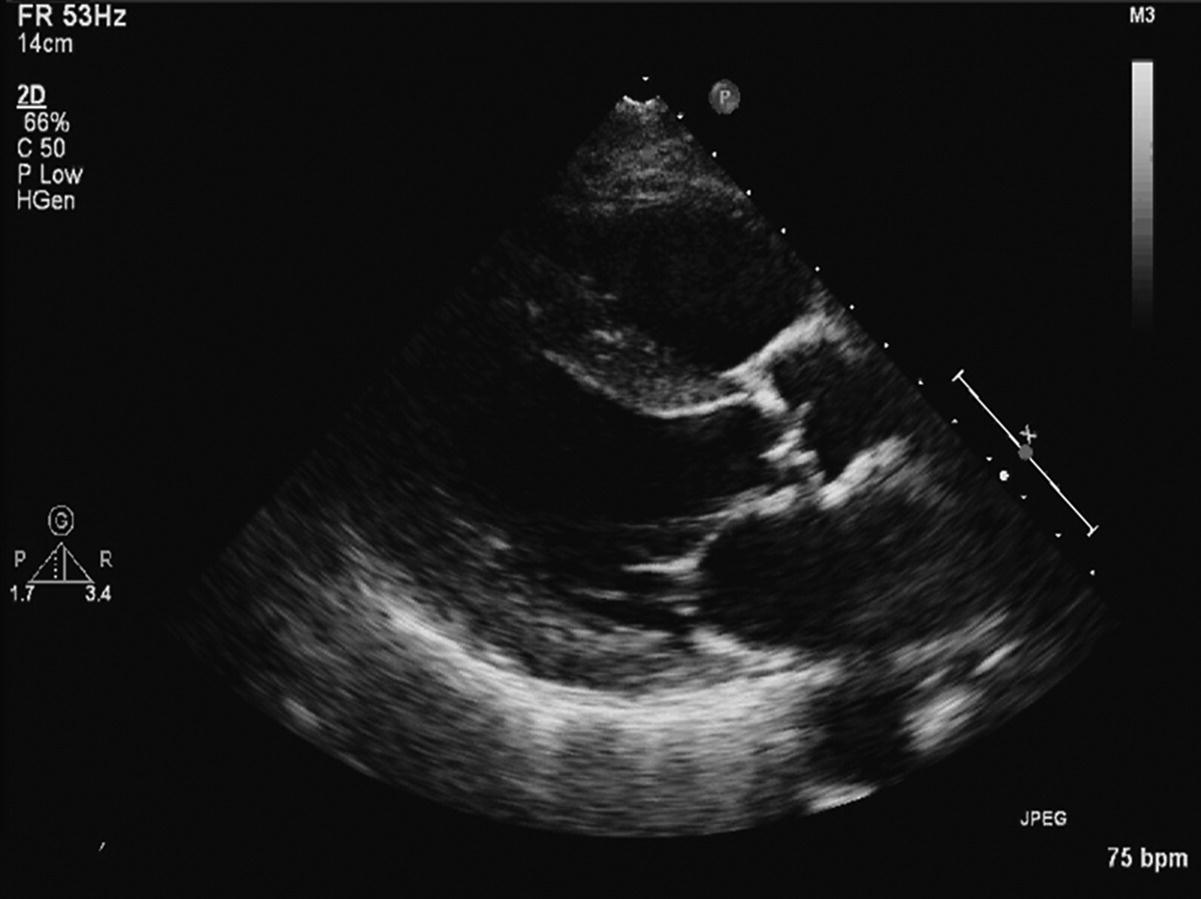
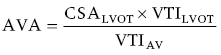
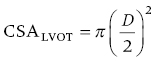
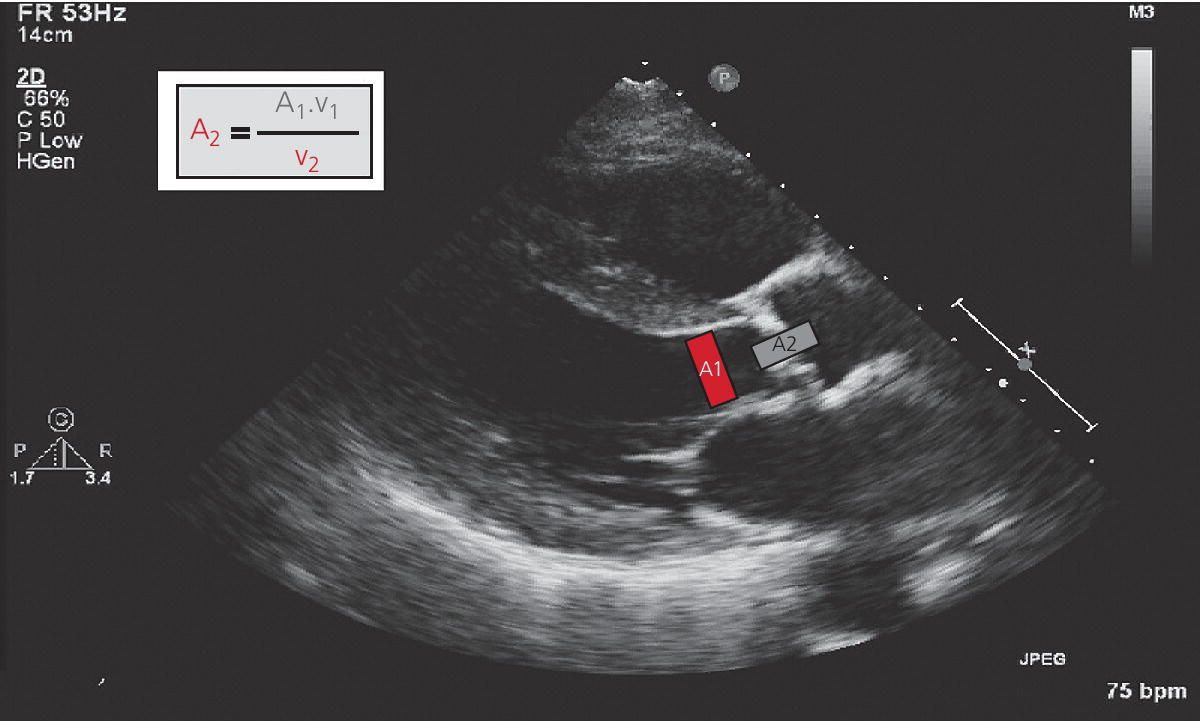
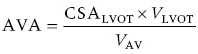
CHAPTER 8 David P. McLaughlin and George A. Stouffer The basic function of the aortic valve is to separate the aorta from the left ventricle cavity during diastole. At peak left ventricular (LV) ejection the aortic valve opens briskly to an average area of 4 cm2. In rare conditions there can be obstruction of forward flow that can occur either at the subvalvular level (e.g., subaortic membrane or hypertrophic obstructive cardiomyopathy) or supravalvular (e.g., Noonan’s syndrome). However, the overwhelming majority of cases are due to valvular stenosis. Pathologic thickening and fusion of the aortic valve leaflets results in restricted leaflet mobility and a decrease in the effective aortic valve area, leading to aortic valve stenosis (in this chapter, we will use the abbreviation AS to refer to aortic valvular stenosis). The etiology of aortic valve disease in developed countries has changed dramatically in the last few decades. With the aging of the population and concurrent decrease in rheumatic fever, degenerative calcific AS is now by far the most common cause of AS. There is evidence that AS has similar histological findings to atherosclerosis with lipid infiltration and inflammation, but statin drugs have been largely ineffective in slowing the progression of AS in clinical studies. A congenitally malformed (bicuspid) aortic valve is one of the most common congenital cardiac defects and is currently the second most common underlying lesion in AS. As aortic valve disease progresses and the valve orifice narrows, resistance to blood flow increases. In order to maintain stroke volume, the velocity of blood exiting the LV increases and a pressure gradient develops from the LV to the aorta (Figure 8.1). This leads to elevations in left ventricular systolic pressure and this “pressure overload” of the LV leads in turn to compensatory concentric LV hypertrophy. This adaptation allows the LV to generate the necessary pressure to maintain cardiac output, but can lead to abnormalities in diastolic LV function, coronary perfusion, and eventually LV systolic dysfunction. Figure 8.1 AV pressure gradient versus aortic valve area in a hypothetical patient with cardiac output = 5 L/min, HR = 80 bpm, and SEP = 0.33 seconds. Progressive increase in the pressure gradient across the aortic valve and cardiac (mal)adaptation explain the stages of hemodynamic findings that patients go through as AS progresses. In mild AS, intracardiac pressures and cardiac output will appear normal. As the valve becomes more stenotic, the patient may have normal hemodynamic findings at rest, but may be unable to increase cardiac output during exercise. Progressive narrowing of the valve leads to decreased stroke volume and cardiac output, even at rest. In moderate to severe AS, patients may develop elevated filling pressures to compensate for the increase in LV end‐diastolic pressure. In a minority of patients LV systolic failure also occurs, which may lead to further elevation in intracardiac pressures. It is important to remember that the pressure gradient across the aortic valve increases exponentially (not linearly) with decreasing aortic valve area. Thus, in patients with severe AS, small changes in aortic valve area can lead to large changes in hemodynamics (Figure 8.1). Adaptive mechanisms of the LV and circulation allow most patients to remain asymptomatic until advanced narrowing of the aortic valve orifice occurs. The prognosis of patients with asymptomatic severe AS is good, with a sudden death rate of less than 0.5% per year. The onset of symptoms, however, heralds a marked change in the natural history of AS, with poor outcomes unless the patient undergoes aortic valve replacement. The classic clinical presentation of severe AS is typically an insidious onset of any of the triad of effort angina, exertional syncope, or dyspnea [1]. The average survival in untreated patients with severe AS is classically thought to be 2, 3, or 5 years after the onset of heart failure, syncope, or chest pain, respectively. Importantly, many patients report being asymptomatic, although careful questioning reveals that they have gradually decreased their level of activity and would, in fact, be symptomatic at their previous level of exertion. Extensive questioning, often involving a family member, is imperative. Occasionally, careful exercise treadmill testing can be useful in the nominally “asymptomatic” patient. The physical examination of patients with AS can often be helpful in predicting which patients have hemodynamically severe disease. A low volume, late onset arterial pulse, referred to as parvus et tardus, is often present in severe AS. This finding can be appreciated on palpation of the carotid upstroke and radial artery. It may not be manifest in the elderly owing to a noncompliant vasculature. Other physical findings include a systolic murmur that is crescendo–decrescendo in intensity. The duration will vary with the severity of disease, but the murmur always begins after S1 and ends prior to S2. The timing of the loudest portion of the murmur correlates with the severity of AS, with late‐peaking murmurs being more common in critical AS. The murmur is generally heard best in the right second intercostal space and can radiate to the carotid arteries. A diminished aortic component of the second heart sound is not uncommon and the second heart sound can also split paradoxically in severe AS (delayed aortic component with narrowing of the splitting with inspiration). Elderly patients with heavily calcified valves may develop systolic murmurs that radiate prominently to the apex (Gallavardin’s phenomenon). Physical exam findings that are suggestive of severe AS include diminished carotid pulses, late‐peaking systolic murmur, and absent aortic component of the second heart sound; however, it is important to realize that even in experienced hands the physical exam can be unreliable in terms of quantifying AS severity (see Table 8.1). Table 8.1 Physical examination of severe AS. Echocardiographic evaluation of aortic valve disease has greatly facilitated the management of these patients [2]. Two‐dimensional (2D) echo provides important information about valve morphology (Figure 8.2) and LV function as well as important prognostic ancillary findings, such as degree of left ventricular hypertrophy, presence of mitral regurgitation, and pulmonary artery pressures. Flow through a stenotic AV is well approximated by flow through a convergent orifice (e.g., a nozzle), which causes acceleration of blood velocity as it passes from the LV outflow tract (LVOT) through the stenotic valve. The point of maximum velocity is termed the vena contracta (VC) of the jet and the area of the flow jet at the VC is known as the effective orifice area (EOA). Doppler evaluation enables the noninvasive measurement of blood flow velocity with estimation of aortic valve gradient and valve area. The LV–aortic pressure gradient is estimated by measuring blood flow velocity across the aortic valve and then using the Bernoulli equation to determine pressure gradient. Figure 8.2 2D echocardiographic still frame in the parasternal long axis in a 73‐year‐old male with severe AS. Note the calcified aortic valve and left ventricular hypertrophy. The primary hemodynamic parameters measured by echocardiography in patients with AS are (a) maximum systolic velocity across the aortic valve measured using continuous‐wave Doppler; (b) mean aortic valve pressure gradient; and (c) aortic valve area as determined by continuity equation. Maximum systolic velocity should be measured using multiple views, a time scale on the x‐axis of 100 mm/s, and a gray scale that allows visual separation of noise from the true velocity signal. In severe AS, the continuous‐wave Doppler curve is generally more rounded, reflecting a high gradient throughout systole. A few additional caveats: (a) it is essential to measure velocity parallel to blood flow, as significant deviation results in velocity underestimation (underestimation is 5% or less if the intercept angle is within 15° of parallel); (b) avoid recording the continuous‐wave Doppler signal of an eccentric mitral regurgitation jet; and (c) be careful of interpreting maximum velocity in the setting of irregular rhythms. Mean transaortic pressure gradient is the average difference in pressure between the LV and aorta during systole. Peak velocity and mean gradient provide independent information regarding AS severity, with the relationship depending on the shape of the velocity curve. The mean gradient is calculated by averaging the instantaneous gradients over the ejection period followed by calculation of pressure from velocity using a simplification of the Bernoulli equation: The mean transaortic gradient is easily measured with current echocardiography technology, but it is important to remember that the assumptions in the simplified Bernoulli equation include that (a) viscous losses and acceleration effects are negligible; (b) there is an approximation for the constant that relates to the mass density of blood; and (c) the proximal velocity can be ignored, a reasonable assumption only when the proximal velocity is <1.5 m/s and the aortic velocity is ≥3.0 m/s. Also the effects of pressure recovery, the conversion of kinetic energy into potential energy with a corresponding increase in pressure distal to a stenosis, are ignored, but these are generally small unless aortic diameter is <3 cm. Maximum velocity and mean pressure gradients across a stenotic aortic valve are both flow dependent. In contrast, aortic valve area is independent of the conditions in which it is measured (at least in theory). When using echocardiography, aortic valve area is calculated based on the continuity equation, which was derived based on the assumption that the stroke volume flowing through the LVOT and the stenotic aortic valve are the same (Figure 8.3). Because volume flow rate at any point in the LVOT is equal to the cross‐sectional area times velocity over the ejection period (the velocity time interval of the systolic velocity curve), the equation can be solved for aortic valve area: Figure 8.3 The image from Figure 8.2 is used to show the underlying assumption for the continuity equation: the amount of blood flowing through area 1 = the amount of blood flowing through area 2. where CSA = cross‐sectional area; D = diameter; VTI = velocity time integral. In practice, determination of aortic valve area by the continuity equation requires measurement of velocity across the aortic valve by continuous‐wave Doppler, LVOT diameter, and LVOT velocity by pulse‐wave Doppler. There are several important caveats to keep in mind: (a) LVOT diameter and velocity measurements should be made at the same distance from the aortic valve; (b) the LVOT becomes progressively more elliptical (the equation assumes that the LVOT is circular) near the valve in many patients; and (c) this method assumes laminar flow in the LVOT, which may not be valid if there is dynamic subaortic obstruction, a subaortic membrane, or significant aortic regurgitation. Despite these limitations, continuity equation valve area calculations have been well validated [2,3]. A simplified continuity equation can be used, although there tends to be more variability when using maximum velocities rather than velocity time integral (VTI). The simplified equation assumes that the shape of the velocity curve in the outflow tract and aorta are similar, so that the ratio of LVOT VTI to aortic valve VTI is identical to the ratio of the LVOT maximum velocity to aortic valve maximum velocity:
Aortic stenosis
Physical exam
• Parvus et tardus pulse (low amplitude, delayed upstroke)
• Sustained LV impulse
• Late‐peaking systolic murmur (although murmur can be absent)
• Diminished or absent aortic component of the second heart sound
• Parodoxical splitting of the second heart sound
• Prominent fourth heart sound
• Gallavardin’s phenomenon (radiation of murmur to apex in the elderly)
Echocardiographic hemodynamics

Stay updated, free articles. Join our Telegram channel

Full access? Get Clinical Tree


