ELECTROANATOMICAL MAPPING: COMBINED TECHNOLOGIES FOR ADVANCES IN ELECTROPHYSIOLOGY
Case presented by:
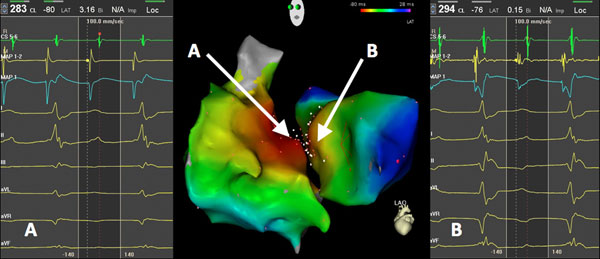
Figure 69.1. Electroanatomical map. (Image courtesy from Dr. Sabine Ernst, Royal Brampton Hospital, London, UK.)
Question No. 1: The electroanatomical map shown above represents what type of arrhythmia?
A.Reentry confined to the right atrium.
B.Focal atrial tachycardia (AT) originating from the right atrium.
C.Focal AT originating from the left atrium.
D.Impossible to distinguish without the measured local activation time (LAT).
Based on the colors alone, red is the earliest site of activation, denoting a focal AT originating in the septal region. However, from the electroanatomical map shown, there is no way to distinguish what is the earliest since both the left and the right atrium presents red color.
Question No. 2: Based on the answer to the previous question, what would you recommend?
A.To map only the right atrium.
B.To map extensively (high-points density) of both atria.
C.To map extensively both atria only in the area of interest (septum).
D.To create an anatomical map only without the electrical information.
In Figure 69.1, it can be noticed that the earliest site of activation (the origin of the focal tachycardia) is located in the septal area. In order to identify the source of the focal tachycardia and to minimize the number of RF applications, there is no need to map the whole chamber/s. It is recommended to highly dense map the area of interest only in the septal region from both atria in order to pinpoint the focus (in “EP language” this is called the “hot and cold approach”).
Question No. 3: Based on the LAT of points A and B delineated on the electroanatomical map:
A.Tachycardia originates on the right; the LAT is –80.
B.Tachycardia originates on the left; the LAT is –76.
C.Tachycardia originates on the right since the bipolar voltage is higher (3.16 mV).
D.There is more red color on the right.
Introduction
Previous CARTO® Systems consisted of only one technology, based on ultralow magnetic fields emitted by a location pad and an embedded passive sensor at the tip of a mapping catheter (NAVISTAR® Catheter, Biosense Webster, Inc., Diamond Bar, CA). The CARTO® 3 System technology combines these magnetic fields with electrical field technology. This hybrid technology not only provides accurate three-dimensional (3D) catheter location but also enables visualization of additional multielectrode catheters without a magnetic sensor. This paper provides a detailed description of the technology and its clinical applications.
Magnetic Technology
The CARTO® 3 System (hereinafter “System”) magnetic technology consists of a miniature passive magnetic sensor located at the tip of an ablation catheter, an external ultralow magnetic field emitter, and a CARTO® System hardware unit. The System uses magnetic technology to accurately determine catheter location and orientation in 6 degrees of freedom (x, y, z, roll, pitch, and yaw), and simultaneously records the intracardiac local electrogram (EGM) from the catheter tip. The location pad placed beneath the patient table generates ultralow magnetic fields (5 × 10⁻⁶ – 5 × 10⁻⁵ T), which define the mapping space around the patient’s torso. The passive sensor detects the magnetic fields from the coils of the location pad and determines the distances from each coil.1 These distances provide the 3D location and orientation in space. The catheter icon has 4 colors, red opposite to blue and yellow opposite to green (Figure 69.2). The colors provide a means of noting the rotation and orientation of the catheter tip. Moreover, since most catheters deflect to a single direction, determining the color toward which the catheter deflects may enhance catheter maneuverability without the use of fluoroscopy. To navigate to a specific location within the heart chamber, the operator first notes the color toward which the catheter deflects, and then turns that color toward the chamber wall and pushes until tissue contact is achieved. When using a bidirectional catheter, the operator must determine both colors toward which the catheter deflects in order to maximize navigation without fluoroscopy.
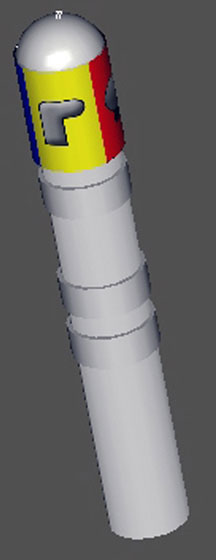
Figure 69.2. Catheter icon denoting colors around the tip.
Mapping
The mapping catheter is introduced with the aid of fluoroscopy and placed in the chamber to be mapped. As the catheter is moved within the heart chambers, the System continuously calculates the 3D location of the catheter and presents this data to the user. The visual location of the catheter can be gated to a fiducial point in the cardiac cycle (sequential mapping—or “point-by-point”) or visualized in “stable” mode along the entire cardiac cycle, termed Fast Anatomical Mapping (FAM). These 2 options maximize operator treatment options in a clinical setting. FAM provides fast acquisition of the heart chamber boundaries for anatomically guided ablations. Sequential mapping provides point-by-point sequential maps with display of precise and detailed activation and voltage maps of focal and reentrant arrhythmias. Both mapping options result in 3D reconstructions of 3D heart chamber geometry with color-coded electrical information superimposed on the anatomical map.
Fast Anatomical Mapping (FAM)
Stay updated, free articles. Join our Telegram channel

Full access? Get Clinical Tree


