ECHOCARDIOGRAPHIC PARAMETERS OF DYSSYNCHRONY
Case presented by:
A patient with wide QRS tachycardia and left ventricular ejection fraction (LVEF) of 26% prior to implantable cardioverter-defibrillation (ICD) implantation underwent three-dimensional speckle strain echocardiography (3DSTE). Time to peak systolic strain is shown in Figure 62.1.
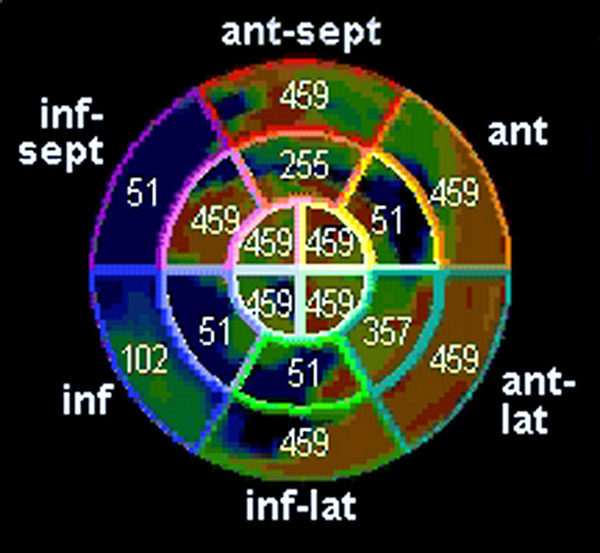
Figure 62.1. Polar plot showing time to peak systolic strain, measured in ms from onset of QRS.
Question No. 1: This case shows presence of:
A.Intraventricular dyssynchrony.
B.Site of latest mechanical activation.
C.Interventricular dyssynchrony.
D.A and B.
E.A, B, and C.
As much as 30% of patients, selected based on the electrocardiographic (ECG), heart function (New York Heart Association class), and ejection fraction (EF) criteria, do not respond to cardiac resynchronization therapy (CRT). In addition, patients with left ventricular (LV) systolic dysfunction, narrow QRS complex and subtle signs of dyssynchrony are frequently encountered in clinical practice. Since CRT is a costly therapy, varying from $45,000 to $80,000, there is a need to identify appropriate responders, as well as accurately measure dyssynchrony.
While atrioventricular (AV) dyssynchrony and interventricular dyssynchrony are identified and optimized after biventricular (BiV) ICD implantation by selecting the AV interval and VV interval associated with the highest left ventricular outflow tract (LVOT) time velocity integral (TVI) and optimal mitral Doppler inflow pattern, the measurement of intraventricular dyssynchrony for optimal patient (responder) selection has gone through several developments as new technologies were introduced over time.
Common echocardiographic methods include1:
- M-mode measurement of septal-to-posterior-wall delay of > 130 ms.
- Tissue Doppler measurement of time to peak systolic velocity with septal-to-posterior-wall delay of > 60 ms (Figure 62.2).
- Tissue Doppler measurement of time to peak systolic velocity in 12 segments and detection of standard deviation of 33 ms.
- Speckle tracking measurement of septal-to-posterior-wall delay in time to peak radial strain of > 130 ms.
- Speckle tracking measurement of time to peak systolic longitudinal strain in 12 segments and detection of standard deviation > 60 ms.
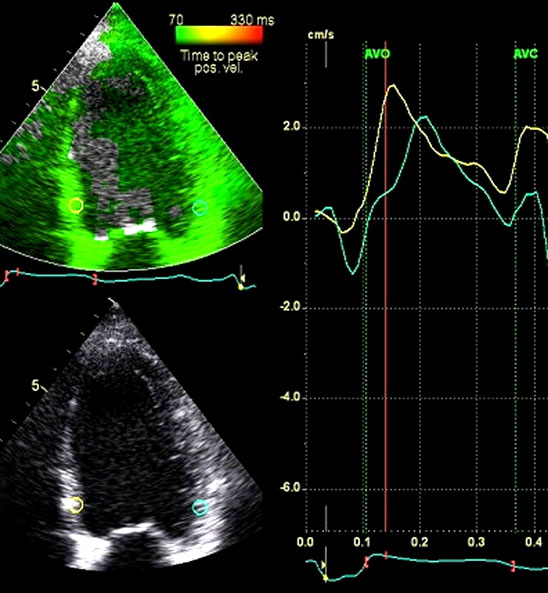
Figure 62.2. Septal-to-lateral-wall dyssynchrony as seen by tissue Doppler velocity imaging for measurement of time to peak systolic velocity. The yellow line, representing the region of interest on septum, peaks much earlier than the green line, which represents the velocity of region on interest of lateral wall. In this case it was 65 ms, indicating that the septum reaches peak systolic velocity 65 ms, hence it is dyssynchronous with the lateral wall by 65 ms.
The interest in echocardiography to predict response to CRT markedly diminished after the PROSPECT and Mayo clinic studies in which none of the studied parameters could predict response to CRT in a reproducible manner.2,3 These studies included not only tissue Doppler but, in the Mayo Clinic study, two-dimensional (2D) strain as well as 3D volume dyssynchrony indices. However, since the clinical need for measurement of dyssynchrony persists, there is continued interest in development of new methods.
Figure 62.1 represents the promise of 3DSTE for strain measurement, a new technique to assess dyssynchrony. 3DSTE was developed to conquer the limitations of 2DSTE, which was unable to track speckles in 3 dimensions. 3DSTE has a much larger scan area with the ability to track the fingerprints of myocardium, called speckles, in space and time. The time to peak contraction is measured by time to peak systolic strain. In case of dyssynchrony, the time to peak systolic strain is delayed in dyssynchronous segments. Time to peak systolic strain is similar in normal controls in all segments, between 300 and 400 ms, whether measured by 2D or 3D4, as shown in Figure 62.4.
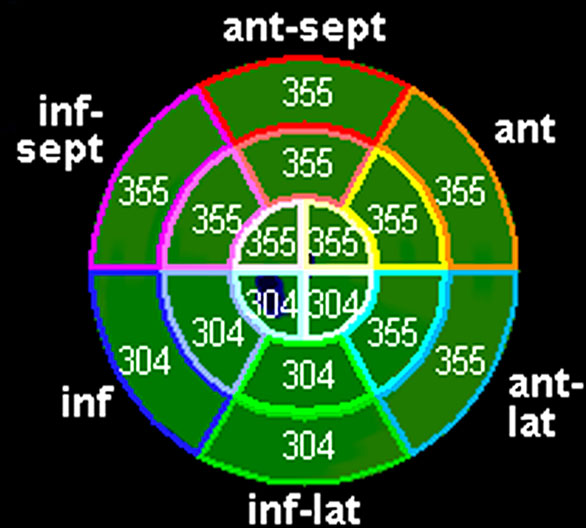
Figure 62.3. Time to peak systolic strain in a normal healthy volunteer.
Compared to Figure 62.1, the time to peak systolic radial strain in Figure 62.3
Stay updated, free articles. Join our Telegram channel

Full access? Get Clinical Tree


