RISK STRATIFICATION OF SUDDEN DEATH IN HYPERTROPHIC CARDIOMYOPATHY
Case presented by:
Patient 1
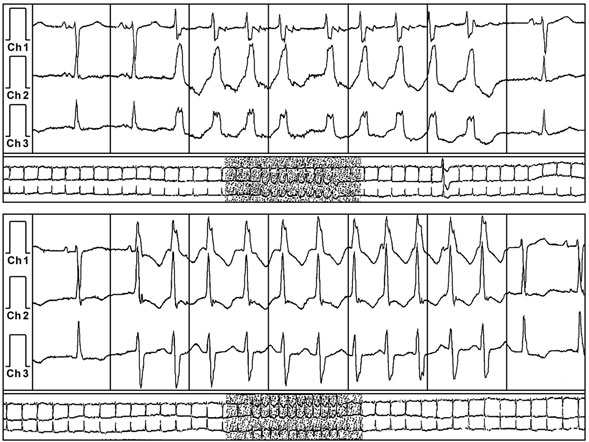
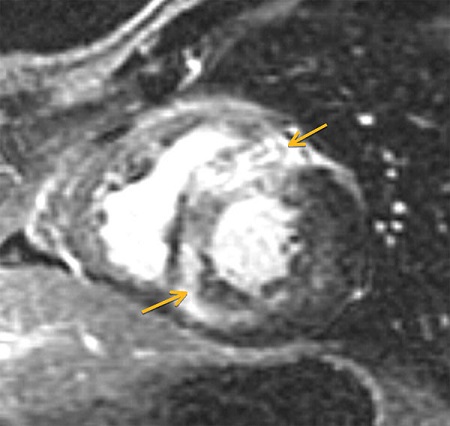
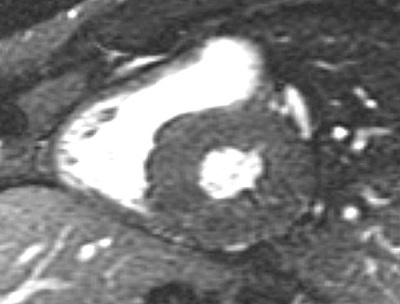
A 59-year-old man with a known history of nonobstructive hypertrophic cardiomyopathy (HCM) (Figures 49.1, 49.2, and 49.3) (diagnosed about 26 years ago), maintained on verapamil 120 mg 3 times a day and quinidine 324 mg 3 times a day, sought attention after experiencing a syncopal episode while running. A 24-hour ambulatory ECG monitor revealed several runs of nonsustained ventricular tachycardia (NSVT) (Figure 49.4). Cardiac magnetic resonance (CMR) imaging revealed extensive areas of nodular delayed hyperenhancement (DHE) (Figure 49.5), and a sleep study showed evidence of severe obstructive sleep apnea (OSA)–hypopnea syndrome.
A.Age > 55 years.
B.Left ventricular outflow tract (LVOT) gradient >60 mmHg.
C.Atrial fibrillation (AF).
D.Syncope.
Question No. 2: Based on your answer to the previous question, what would you recommend?
A.Implantation of an automatic implantable cardioverter-defibrillator (ICD).
B.Addition of a beta-blocker to therapy.
C.Discontinue verapamil and start disopyramide.
D.Exercise treadmill stress test.
Patient 2
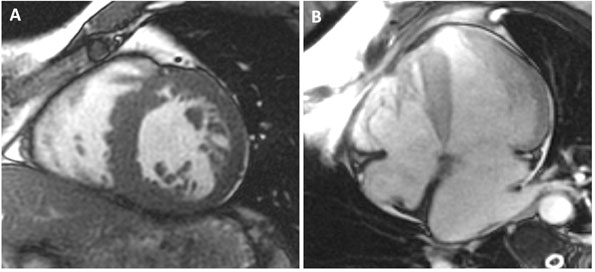
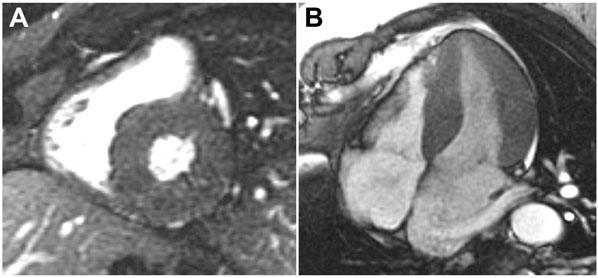
A 36-year-old man was diagnosed with obstructive HCM after a transthoracic echocardiogram for evaluation of chest pain and dyspnea on exertion (Figures 49.6 and 49.7). Appropriate blood pressure response was noted on a treadmill exercise stress test and a 24-hour Holter monitor did not reveal any episodes of NSVT. He denied any family history of HCM or SD and any syncope. CMR obtained did not reveal any DHE (Figures 49.8 and 49.9).
A.Electrophysiologic testing (programmed ventricular stimulation).
B.LV wall thickness.
C.Genetic testing for sarcomere gene mutations.
D.Coronary angiography.
A.Implantation of an automatic ICD.
B.Permanent pacemaker for alleviation of LVOT gradient.
C.Begin patient on a therapeutic trial of beta-blockade.
D.Invasive hemodynamic data assessment in the catheterization laboratory.
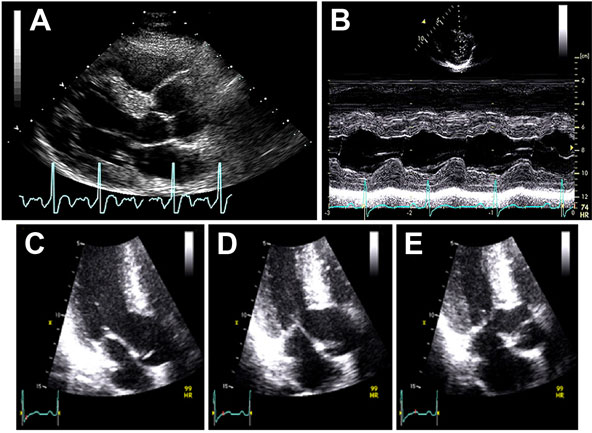
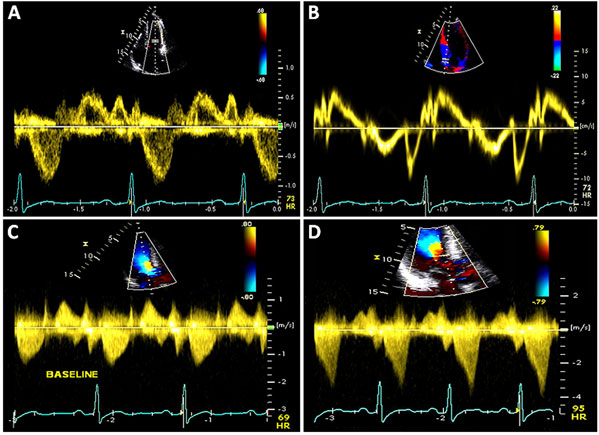
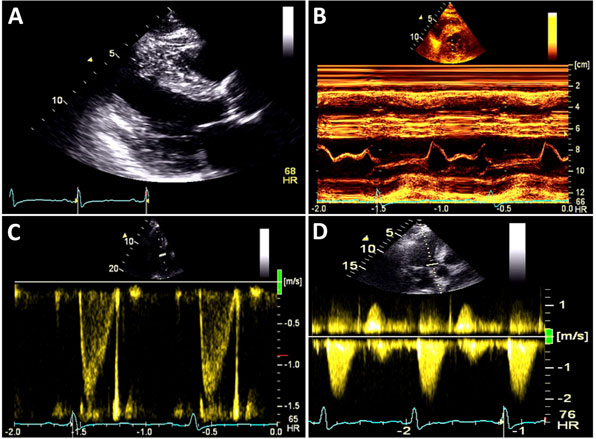
Figure 49.7 A and B: Mitral inflow and tissue Doppler recording of the medial mitral annular velocity in this patient with HCM. These Doppler tracings are suggestive of diastolic dysfunction (Grade I/IV – abnormal relaxation filling pattern with normal to mildly elevated filling pressures). C and D: CW Doppler recordings in this patient at rest (Panel C) and after a provocative maneuver of amyl nitrite inhalation (Panel D). Note that, at rest, there is no LVOT obstruction with a nonexistent resting gradient (Panel C), which increases significantly to 60 mmHg with amyl nitrite (Panel D). This corresponds to SAM where close approximation of the mitral valve with the septum occurs (see Figure 49.6E) in this patient. Note the typical shape on CW Doppler tracing – the “Dagger sign” – obtained through the orifice in the outflow tract.
Discussion
HCM is the most common inherited heart disease (autosomal dominant with incomplete penetrance) that primarily arises from mutations in the genes encoding the cardiac sarcomere myofilament proteins – “sarcomeric HCM” (Figure 49.10). However, additional subgroups (nonsarcomeric proteins), tentatively classified as “Z-disc HCM” and “calcium-binding HCM” (Table 49.1), also exist. These mutations alter the structure and function of the proteins resulting in myofibrillar disarray, marked ventricular hypertrophy (frequently asymmetric), diastolic dysfunction, and, in some patients, sudden cardiac death. The disease is characterized by extraordinary heterogeneity in its genetic substrate, its phenotypic expression, clinical presentation, and natural history, as well as management and specific therapy. HCM can present at any age and may be detected in infancy, childhood, adolescence, or as a coincidental finding at autopsy in the elderly.
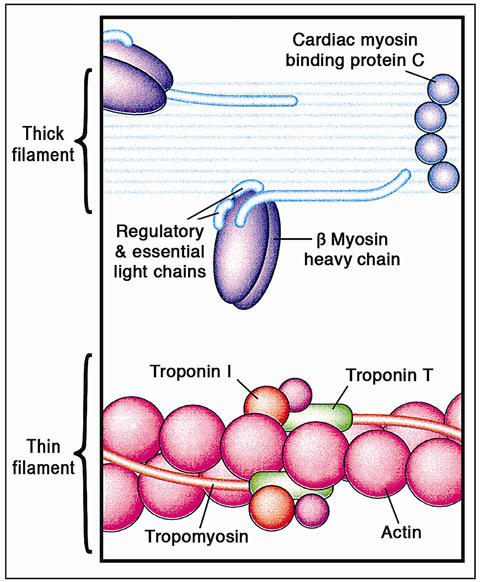
Figure 49.10 The cardiac sarcomere comprises the contractile proteins of the thick and thin filaments. Mutations in genes encoding each of the proteins labeled in this figure can cause HCM; thus, the disorder can result from abnormalities of proteins that have diverse structural, enzymatic, and regulatory functions. (Reproduced from Ashrafian et al44 with permission from Elsevier.)
Table 49.1. Summary of HCM Susceptibility Genes
| Gene | Locus | Protein | Frequency (%) |
| Myofilament HCM | |||
| TTN | 2q24.3 | Titin | <1 |
| MYH7 | 14q11.2-q12 | Beta-myosin heavy chain | 15-25 |
| MYH6 | 14q11.2-q12 | Alpha-myosin heavy chain | <1 |
| MYL2 | 12q23-q24.3 | Ventricular regulatory myosin light chain | <2 |
| MYL3 | 3p21.2-p21.3 | Ventricular essential myosin light chain | <1 |
| MYBPC3 | 11p11.2 | Cardiac myosin-binding protein C | 15-25 |
| TNNT2 | 1q32 | Cardiac troponin T | <5 |
| TNNI3 | 19p13.4 | Cardiac troponin I | <5 |
| TPM1 | 15q22.1 | Alpha-tropomyosin | <5 |
| ACTC | 15q14 | Alpha-cardiac actin | <1 |
| TNNC1 | 3p21.3-p14.3 | Cardiac troponin C | <1 |
| Z-disc HCM | |||
| LBD3 | 10q22.2-q23.3 | LIM binding domain 3 (alias: ZASP) | 1-5 |
| CSRP3 | 11p15.1 | Muscle LIM protein | <1 |
| TCAP | 17q12-q21.1 | Telethonin | <1 |
| VCL | 10q22.1-q23 | Vinculin/metavinculin | <1 |
| ACTN2 | 1q42-q43 | Alpha-actinin 2 | <1 |
| MYOZ2 | 4q26-q27 | Myozenin 2 | <1 |
| Calcium-handling HCM | |||
| JPH2 | 20q12 | Juntophilin-2 | <1 |
| PLN | 6q22.1 | Phospholamban | <1 |
Genes in bold are available as commercial genetic tests.
(Reprinted from Bos et al45 with permission from Elsevier.)
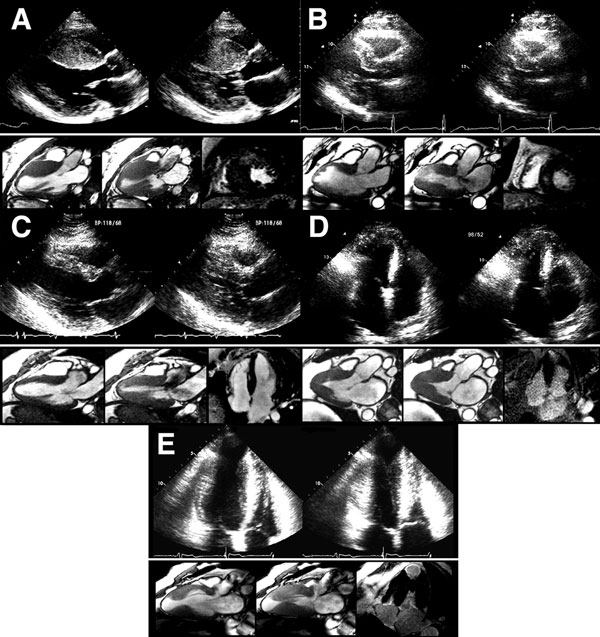
Anatomically characterized by a thick (symmetrical or asymmetrical) hypertrophied (increased mass) LV, the classic form of HCM involves thickening of the basal anterior septum, which bulges beneath the aortic valve and causes narrowing of the LVOT. However, modern studies have demonstrated a spectrum of patterns of LV wall thickening that constitute the phenotypic expression of HCM (Figure 49.11). The morphological and functional changes associated with HCM result in complex and multiple interrelated changes in cardiac physiology, including diastolic dysfunction, LVOT obstruction, mitral regurgitation, myocardial ischemia, arrhythmias, and, in a minority of patients over time, overt systolic dysfunction (Figure 49.12).
Stay updated, free articles. Join our Telegram channel

Full access? Get Clinical Tree


