THE ELECTROCARDIOGRAM IN VENTRICULAR TACHYCARDIA
Introduction
Although 90% of wide QRS tachycardias presenting in the emergency room are ventricular tachycardia (VT), errors are often made because physicians wrongly consider VT unlikely if the patient is hemodynamically stable.1 In that setting, administering drugs under the assumption that the patient is suffering from a supraventricular tachycardia (SVT) may be deleterious.2,3
Possible Causes of a Wide (Broad) QRS Tachycardia (Figure 4.1)
1.SVT with preexisting or functional bundle branch block (BBB). This includes sinus tachycardia, atrial tachycardia, atrial flutter, atrial fibrillation, and atrioventricular (AV) nodal reentrant tachycardia. Functional BBB will occur once the SVT reaches the refractory period of the bundle branch, so-called tachycardia-dependent or phase 3 BBB, or because of retrograde invasion into the bundle branch.4 (Figure 4.1A)
2.Circus movement tachycardia with AV conduction over the AV node and ventriculoatrial (VA) conduction over an accessory AV pathway with preexisting or functional BBB (Figure 4.1B).
3.SVTs as in Cause 1, but with AV conduction over an accessory AV pathway (Figure 4.1C).
4.Circus movement tachycardia with AV conduction over an accessory AV pathway and VA conduction over the AV node or a second accessory AV pathway (Figure 4.1D).
5.A tachycardia using a nodoventricular fiber in anterograde direction and the bundle branch-His system or an accessory AV pathway in retrograde direction (Figure 4.1E).
6.Ventricular tachycardia (Figure 4.1F).
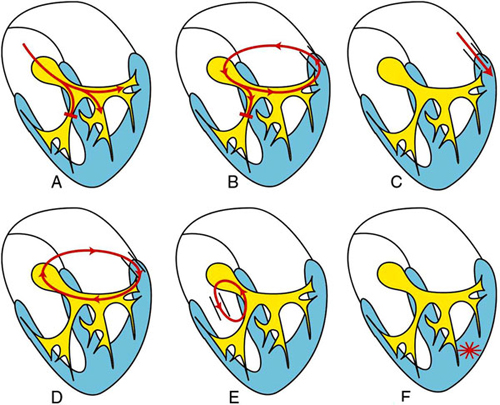
Figure 4.1. Possible causes of wide QRS tachycardia. See text for explanation.
Electrocardiographic Diagnosis of a Wide QRS Tachycardia
To come to a correct diagnosis, a 12-lead ECG is required. That ECG should be examined systematically, looking for AV dissociation and analyzing QRS characteristics such as width, axis, and configuration.5
Atrioventricular Dissociation
Dissociation between atrial and ventricular activity during tachycardia is considered to be the hallmark of VT. On physical examination it leads to canon waves in the jugular pulse, varying loudness of the first heart sound, and beat-to-beat changes in the blood pressure. The challenge with the 12-lead ECG is to identify the P wave among the QRS complexes and to note that they are dissociated. Independent beating of atria and ventricles during a wide QRS tachycardia is the hallmark of VT.
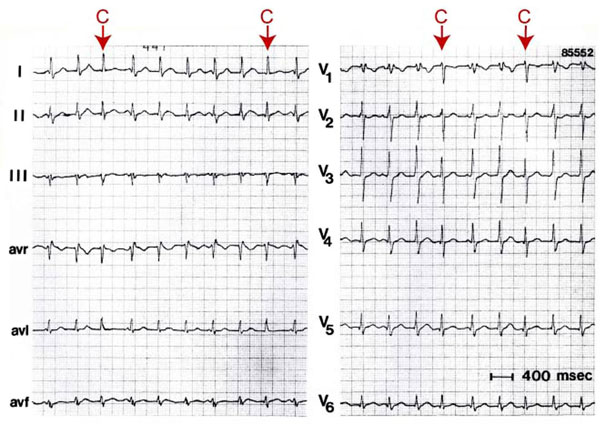
Independent beating of atria and ventricles during a VT can result in “capture” and “fusion” beats (Figure 4.2). This occurs when the ventricular rate during VT is such that an appropriately timed atrial impulse, usually originating in the sinus node, is able to traverse the AV node to depolarize the ventricles completely (“capture”) or partially (“fusion”). In the latter situation, fusion occurs because of concomitant ventricular activation from the VT focus. “Captures” and “fusion” beats are rare. They only occur when the VT rate is slow, excellent AV conduction is present, and no retrograde invasion into the intraventricular conduction system takes place during VT.
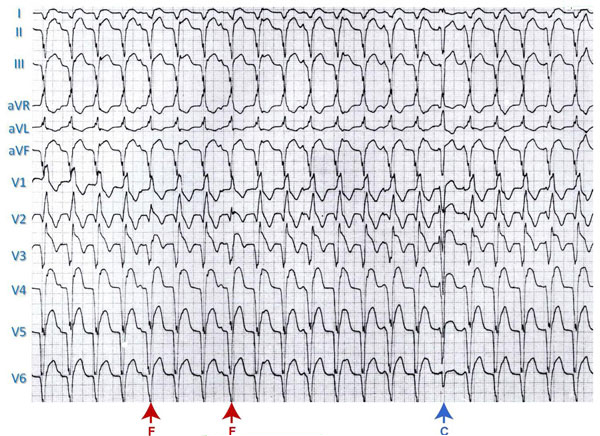
Figure 4.2. VT with “fusion” (F) and “capture” (C) beats.
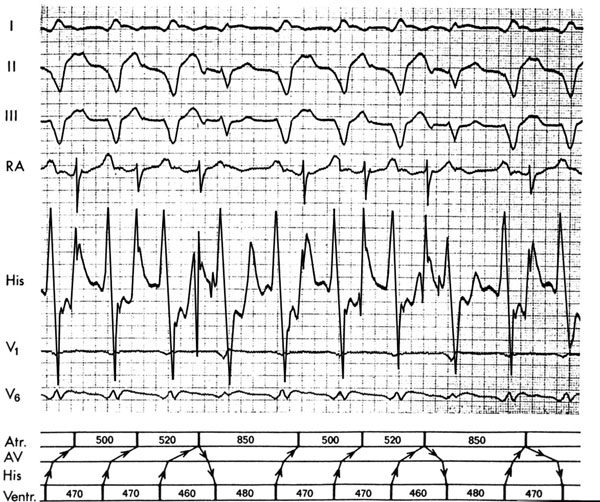
The occurrence of a more narrow QRS during VT is not always the result of a conducted supraventricular beat; it may also result from fusion with a ventricular depolarization arising in the ventricle contralateral to the ventricle in which the VT originates, or when fusion occurs with a ventricular echo beat when a retrogradely conducted impulse during VT travels to the AV node and reenters the ventricle6 (Figure 4.3).
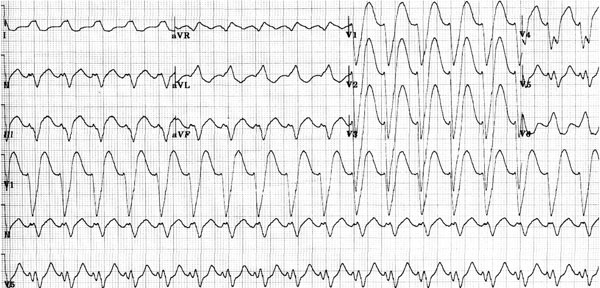
Width of the QRS Complex
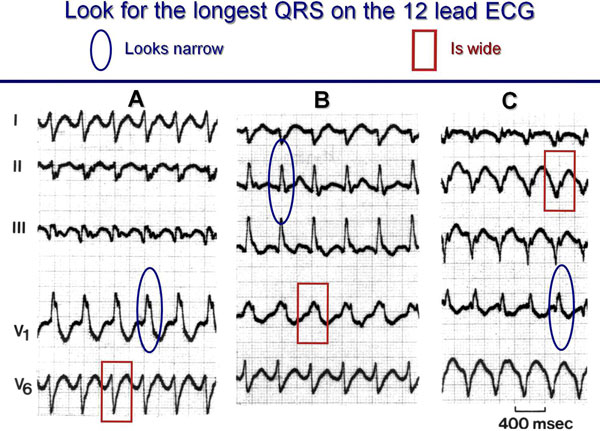
To determine the width of the QRS in a wide QRS tachycardia, it is essential to look for the widest one in the 12-lead ECG because cancellation by opposite activation forces may lead to a narrower QRS (Figure 4.4).
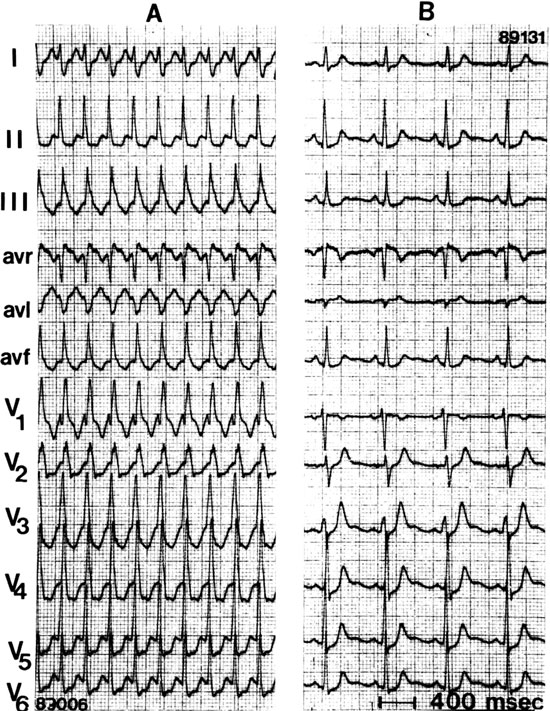
Bundle branch block will result in QRS widening, becoming maximal at 0.14 seconds for right BBB (RBBB) and 0.16 seconds for left BBB (LBBB).5 A wider QRS complex should, therefore, lead to the consideration of a VT. However, there are three situations in which an SVT can have a wider QRS than the upper limits mentioned. The first one is preexistent BBB with additional intraventricular fibrosis or scarring. The second is the SVT with AV conduction over an accessory AV pathway. And the third is marked widening of the QRS during SVT because of the presence of an antiarrhythmic drug that prolongs (usually rate-related) intraventricular conduction, most commonly flecainide (Figure 4.5).
It is important to realize that width of the QRS during VT is related to its site of origin and the underlying disease. A VT originating in or close to the interventricular septum will have a smaller QRS than the VT arising in the lateral wall because of more synchronized activation of the two ventricles in the former. Also, the underlying disease plays a role. A patient with a ventricular scar tends to have a wider QRS than the patient with an idiopathic VT. A VT originating in the interventricular septum may have a width of <0.12 seconds (Figure 4.6).
The QRS Axis
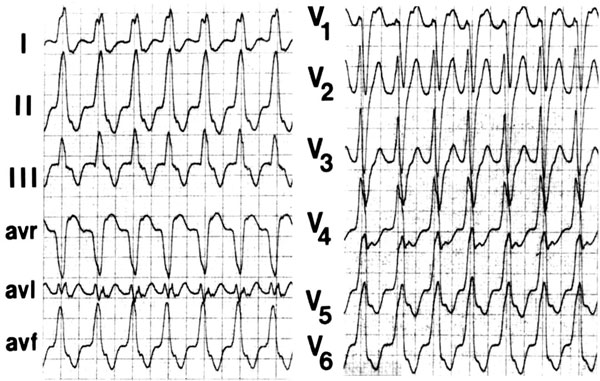
Patients with a VT frequently have an abnormal QRS axis in the frontal plane. In a VT with an RBBB-like configuration, the axis often points superiorly (marked left axis deviation), in contrast to SVT with RBBB in which the axis is more inferiorly directed.
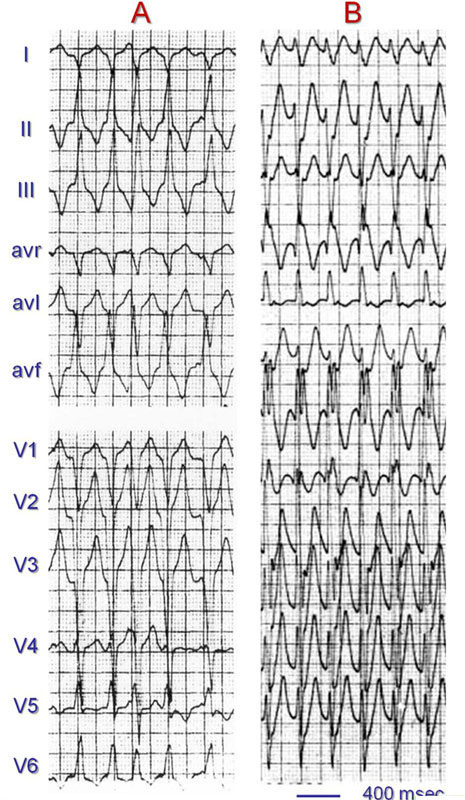
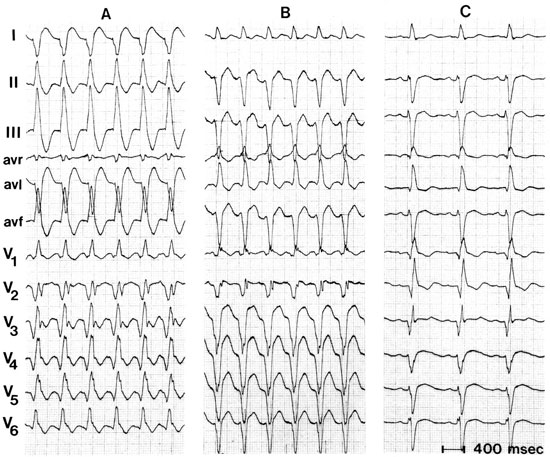
In patients with an LBBB-shaped QRS tachycardia, right axis deviation suggests VT. Patients with an idiopathic VT can have a normal QRS axis in the frontal plane, for example, those with an idiopathic VT originating in the posterolateral outflow area of the right ventricle (Figure 4.7). However, idiopathic left and right ventricular VT often have an unusual frontal QRS axis depending on their site of origin (Figure 4.8).
In the discussion of the importance of the frontal-plane QRS axis in the differential diagnosis of a wide QRS tachycardia, it is important to know that a markedly abnormal QRS axis can occur in patients with preexistent BBB during SVT (eg, the patient with preexistent RBBB and left anterior hemiblock), in patients with AV conduction over an accessory AV pathway (marked left axis deviation during AV conduction over a right-sided or posteroseptal accessory pathway, and marked right axis deviation in case of AV conduction over a left free wall accessory connection), and in patients with a tachycardia who are taking a drug that slows intraventricular conduction (eg, the class Ic antiarrhythmic drug flecainide.
As discussed below, the QRS axis is also important in determining the likely site of origin of a VT.
Configurational Characteristics of the QRS Complex
RBBB-Shaped QRS Complexes
An SVT with RBBB aberration shows a triphasic rSR pattern in lead V1 and a triphasic QRS pattern in lead V6 (Figure 4.9). The initial R wave in lead V1 reflects normal interventricular septal activation, S-wave left ventricular activation and delayed R-wave activation of the right ventricle. Lead V6 shows a narrow Q wave reflecting normal septal activation and an R:S ratio of >1.5 In VT with an RBBB-like shape, lead V1 usually shows a mono- or biphasic R wave. Figure 4.10 illustrates that the QRS configuration in lead V6 is usually determined by the frontal-plane QRS axis. It shows a deep S wave (R:S ratio <1) in case of a superior axis and an R:S ratio >1 when an inferior axis is present.)
LBBB-Shaped QRS Complexes
The leads to make the differential diagnosis between an LBBB-shaped VT and SVT with LBBB aberration are V1, V2, and V6. LBBB aberrancy is characterized by a small and narrow (<0.04 seconds) R wave and a clean and swift (no slurs or notches) S wave, with a distance from the beginning of the QRS to the nadir of the S wave of <0.07 seconds.
In contrast, an R wave of >0.04 seconds, with a slurred downstroke and a delayed interval to the nadir of the S wave in V1 and/or V2 (>0.07 seconds) supports the diagnosis of VT.7 A Q wave in lead V6 confirms VT (Figure 4.11).
Stay updated, free articles. Join our Telegram channel

Full access? Get Clinical Tree


