EPICARDIAL VENTRICULAR TACHYCARDIA IN ARVC/D
Case presented by:
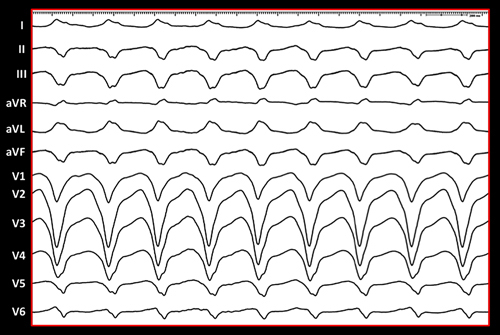
12-lead ECG of a patient with palpitations.
Question No. 1: The ECG shows:
A.Idiopathic right ventricular tachycardia (VT).
B.Epicardial VT in arrhythmogenic right ventricular cardiomyopathy/dysplasia (ARVC/D).
C.Endocardial VT in ARVC/D.
Case Report
A 39-year-old woman with a history of ARVC/D presented with recurrent VT and implantable cardioverter-defibrillator (ICD) shocks. She initially presented with sudden onset of palpitations during exercise. Her subsequent workup revealed the following: (1) right precordial T-wave inversions on electrocardiogram (ECG), (2) RV hypokinesia and dilatation on echocardiogram, (3) nonsustained VT on stress testing and event monitoring (left bundle morphology with both superior and inferior axis), (4) magnetic resonance imaging (MRI) consistent with ARVC/D, and (5) abnormal signal-averaged ECG. Two months prior to presentation, she had recurrent ICD shocks and was treated with beta-blocker therapy. Due to significant side effects, it was discontinued and she was referred for electrophysiology study (EPS)/ablation.
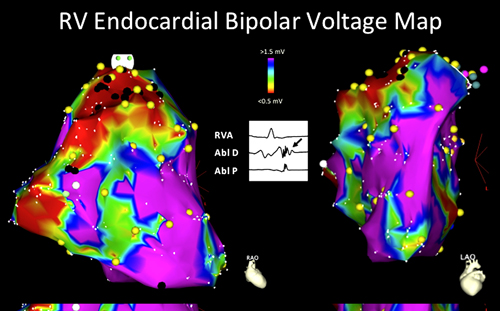
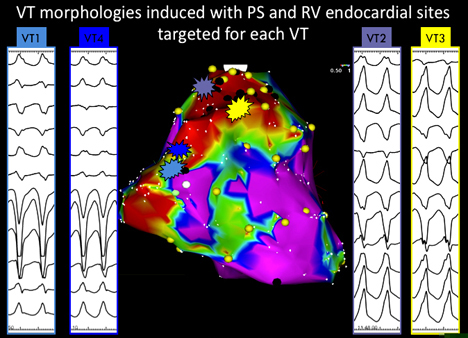
At the start of the procedure, intracardiac echocardiography (ICE) was used to assess the RV. It revealed moderate dilatation of the RV with moderate to severe hypokinesis. Left ventricular (LV) function was normal. The first step was to create a detailed voltage map of the RV. A 3D electroanatomical map (CARTO, Biosense Webster, Diamond Bar, CA) was constructed with a 7-Fr, 3.5-mm tip open-irrigated (Navistar Thermocool, Biosense Webster, Diamond Bar, CA) catheter. The map revealed a large area of low voltage on the RV basal free wall, extending inferiorly and superiorly to the right ventricular outflow tract (RVOT). This area of low voltage had late potentials, which were tagged on the endocardial map (Figure 36.1). Abnormal endocardial voltage was designated as <1.5 mV as previously described by our group. Programmed stimulation (PS) induced 4 different left bundle VTs that were not hemodynamically tolerated (Figure 36.2). VT1 and VT4 were similar, with a left bundle morphology (II > III) and a Q wave in lead V2. Pacemapping and limited activation mapping localized these VTs to the basal superior segment of the RV and were used to guide substrate-based ablation on the basal RV free wall. A linear lesion set was performed from the basal RV free wall extending to the tricuspid valve annulus (TVA). VT2 and VT3 both had left bundle morphology with an inferior axis. Pacemapping and limited activation mapping localized these VTs to the free wall of the RVOT. A linear lesion set was performed from the anterior RVOT (VT2/3 pacemaps) to the basal superior RV (VT1/4 pacemaps). After the initial RV endocardial lesions, PS was performed and both VT1 and VT3 were still inducible. Thus, epicardial mapping was performed.
Stay updated, free articles. Join our Telegram channel

Full access? Get Clinical Tree


