MAPPING, IMAGING, ACCESS, AND ABLATION: AN ILLUSTRATIVE CASE PRESENTATION
Case presented by:
A 56-year-old male presents with a history of documented ventricular tachycardia (VT) associated with presyncope and palpitations. A previously placed automated implantable cardioverter-defibrillator (ICD) has appropriately detected and delivered multiple therapies for VT. Continued ICD therapies have occurred despite attempts at medical therapy (dofetilide, mexiletine, amiodarone [toxicity], sotalol, and beta-blockers). A prior attempt at endocardial radiofrequency ablation was unsuccessful. The coronary arteries are normal. Computerized tomography (CT) (Figure 35.1) demonstrates dilatation of the right ventricle (RV) with microaneurysmal and fatty changes in the right ventricular free wall (hatched arrows).
Two Holter monitor tracings obtained during typical symptoms are shown in Figure 35.2. These episodes are very similar to multiple other documented VTs, including those that triggered ICD therapy.
A.Failed prior ablation attempt.
B.Radiographic findings suggestive of arrhythmogenic right ventricular dysplasia (ARVD, arrhythmogenic right ventricular cardiomyopathy).
C.Electrocardiographic characteristics of the VT.
D.All of the above.
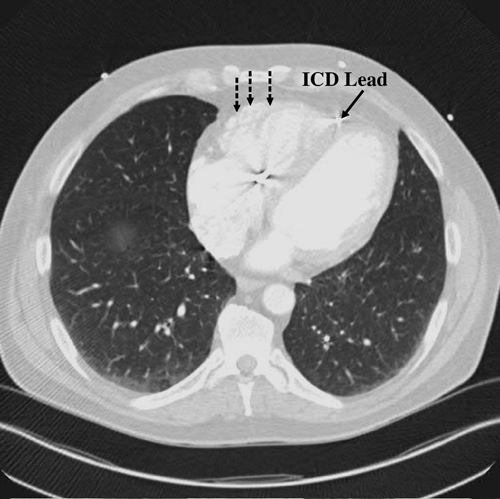
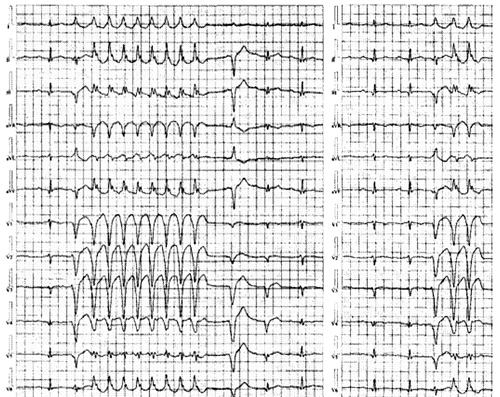
Figure 35.2. Holter monitor tracings obtained during typical symptoms.
Discussion
Failed prior ablation attempt: Success rates for VT ablation vary from about 50% to 70%,1,2,3 and most patients in whom an attempted epicardial ablation is made have failed prior endocardial procedures. In these circumstances, approximately 75% will have an identifiable epicardial substrate that is targeted for ablation.4 Reasons for failure of endocardial ablation include an epicardial substrate, epicardial focus, and limitations arising from endocardial energy delivery including coagulum formation and poor catheter contact. The latter specifically is an underappreciated cause of endocardial ablation failure, especially on the right ventricular free wall.
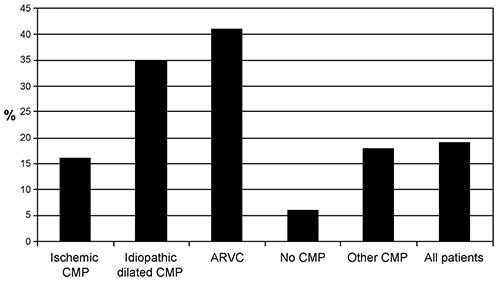
The frequency of using an epicardial approach at tertiary centers varies with the underlying cardiac pathology (Figure 35.3). In coronary disease, epicardial ablation is more frequently required after inferior infarcts5 as compared to anterior infarcts. Chagas disease-prevalent in South America, where the technique of subxiphoid pericardial access was first described6—typically requires epicardial mapping and ablation. In most of these instances, evidence of arrhythmogenic substrate enabling or constituting reentrant VT is epicardially targeted. In a few instances, automatic foci for premature ventricular contractions (PVCs) or VT in the setting of idiopathic outflow tract VT or other similar conditions may be required.7,8
Radiographic findings suggestive of ARVD (arrhythmogenic right ventricular cardiomyopathy): The cardiac CT findings in this patient are characteristic of ARVD. The fibrofatty displacement of the RV (occasionally left) begins in the subepicardium or midmyocardial layers and then progresses to the subendocardium.9 Thus, a disproportionate number of patients with ARVD and VT require an epicardial approach to ablation.5
Electrocardiographic characteristics of the VT: A critical and careful analysis of any obtained electrocardiographic (ECG) data can significantly facilitate the invasive approach for VT management. We note from the Holter data the following key points:
1.The events are prototypical and suggest a higher likelihood of success with ablation.
2.The inciting PVC is of different morphology from the induced, nonsustained VT, although each episode starts with the same PVC and produces the same VT, but the PVC and VT are different.
3.Assuming that the PVC is automatic (focal source), analyzing the QRS axis and morphology can be very revealing in terms of identifying a suitable target for ablation (in this instance, strongly suggestive of RV apical free wall origin). On the other hand, with reentrant VT, ECG analysis may help identify the exit site (transition site to normal myocardium) but may be far removed (endocardial vs epicardial) from the critical substrate that requires targeting for successful ablation.
Can the ECG morphology of the focus/exit help identify epicardial origin of VT? Such criteria have been proposed; however, a clear understanding of the concept and limitations of these proposed criteria must be appreciated. The underlying principle is that the wavefront of a VT with an epicardial focus or exit site must initially travel slowly through the myocardium toward the endocardium, away from leads facing the focus, before it reaches the endocardial His-Purkinje system. This slow conduction results in a “pseudo delta wave” and a delay to the QRS peak (Figure 35.4). A number of parameters have been used to measure this delay, including the pseudo delta wave itself (≥34 ms; sensitivity 83%, specificity 95%), maximum intrinsicoid deflection (≥85 ms; sensitivity 87%, specificity 90%), and shortest RS complex time (>121 ms; sensitivity 76%, specificity 85%).10 A Q wave may be present at the lead facing the tachycardia focus, suggesting an epicardial origin if absent during conduction via the Purkinje system.11
It is important to recognize the limitations of these surface ECG criteria. They will only be apparent in those leads aligned with the tachycardia exit site vector.12 They are also dependent on a critical mass of myocardium to be activated to register on surface leads. A midmyocardial substrate may have an epicardial exit and be amenable to ablation from the endocardium. The presence of postinfarction Q waves on the baseline ECG may influence the arrhythmia morphology. Conduction delay in regions of scar, variations in cardiac rotation and antiarrhythmic drugs can lead to confounding activation sequences that have yet to be systematically evaluated. The ECG findings for right ventricular foci are also less well-defined because of the thinness of the myocardial wall and the lower density of the Purkinje network.
Stay updated, free articles. Join our Telegram channel

Full access? Get Clinical Tree


