RIGHT VENTRICULAR OUTFLOW TRACT VENTRICULAR TACHYCARDIA
Case presented by:
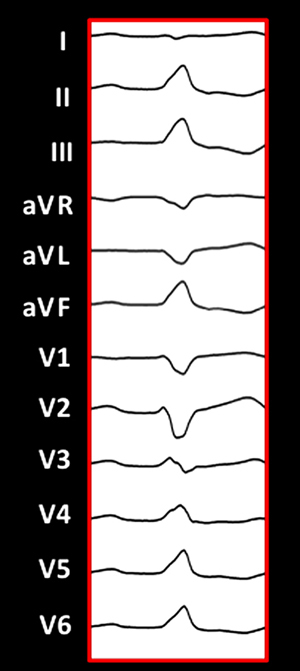
Question No. 1: The ECG in Figure 33 A.1 shows:
A.Idiopathic right ventricular outflow tract (RVOT) tachycardia from an anterior, septal site.
B.Ventricular tachycardia (VT) in arrhythmogenic right ventricular cardiomyopathy/dysplasia (ARVC/D).
C.Idiopathic RVOT tachycardia from a free-wall site.
D.Idiopathic left ventricular (LV) outflow tract tachycardia.
Case Discussion
A 52-year-old male presented with palpitations and decreased exercise tolerance. His ECG revealed frequent left bundle, inferior-axis premature ventricular contractions (PVCs) as noted above. His cardiac workup included the following: (1) an echocardiogram that revealed an ejection fraction of 60% with a normal LV end-diastolic diameter; (2) a 24-hour Holter recording that revealed 30% ventricular ectopy; (3) magnetic resonance imaging (MRI) that revealed no evidence of delayed enhancement and mild global hypokinesis; and (4) a stress test that was negative for coronary artery disease, but did reveal an increase in PVCs with exercise. He was initially treated with beta-blockers, but experienced fatigue and the dose could not be titrated further. He was subsequently referred for electrophysiology (EP) study/ablation.
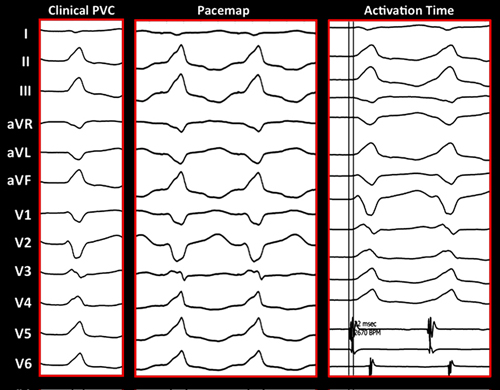
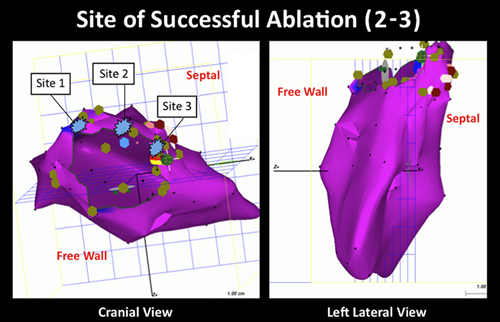
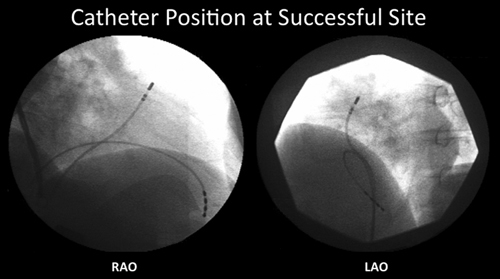
On arrival to the lab, the patient had infrequent, ventricular ectopy. The ECG morphology of the clinical ventricular premature depolarization was left bundle, inferior axis with a biphasic, QRS complex in lead I and a precordial transition by lead V4. The first step was to perform activation mapping in the RVOT, given the PVC morphology. Due to the infrequent PVCs, limited activation mapping was performed and localized the PVC to the anterior, septal aspect of the RVOT. The site of earliest activation was 30 to 35 ms pre-QRS. Pace mapping at this site was a good match to the clinical PVC (see Figure 33 A.1). Radiofrequency ablation (RFA) at this site terminated the PVC (Figures 33 A.2 and 33 A.3). A detailed voltage map of the right ventricle (RV) revealed normal voltage. Post RFA, burst pacing, and isoproterenol failed to illicit any further PVCs.
The patient underwent telemetry monitoring postprocedure and no PVCs were noted. He was discharged off of beta-blockers. The patient was seen in follow-up in the outpatient EP clinic. A 24-hour Holter revealed < 1% PVC, and he reported no further palpitations as well as an improvement in his exercise tolerance.
Discussion
Stay updated, free articles. Join our Telegram channel

Full access? Get Clinical Tree


