ELECTROPHYSIOLOGY OF EPICARDIAL, ENDOCARDIAL, AND M CELLS: IMPLICATIONS FOR ARRHYTHMIAS
Case presented by:
A.A smaller Ito and IK-ATP than epicardium or endocardium.
B.A smaller IKs and larger late INa and INa-Ca than epicardium or endocardium.
C.A smaller IK1 than epicardium or endocardium.
D.A larger IKr than epicardium or endocardium.
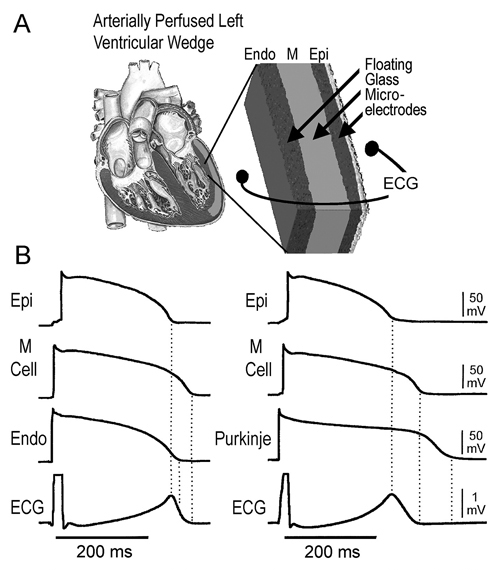
Figure 32.1. A: Schematic of left ventricular (LV) wedge preparation. Floating glass microelectrodes are inserted in the endocardial (Endo), M, and epicardial (Epi) regions together with a transmural ECG consisting of 2 Ag/AgCl half cells placed 1 cm from Endo and Epi surfaces. B: Cellular basis for the normal T wave. APs and a transmural ECG recorded from 2 arterially perfused LV wedges. Left: APs from Epi, M, and Endo sites simultaneously recorded together with a transmural ECG. Right: APs from Epi, M, and a subendocardial Purkinje fiber simultaneously recorded together with a transmural ECG. In both cases, repolarization of Epi is coincident with the peak of the T wave of the ECG, whereas repolarization of the M cells is coincident with the end of the T wave. Endo AP duration is intermediate. Although repolarization of the Purkinje fiber occurs after that of the M cell, it does not register on the ECG. Basic cycle length (BCL) = 2000 ms. (Reproduced from Yan et al1 with permission from Wolters Kluwer Health.)
A.Conduction velocity within the ventricular myocardium.
B.Repolarization of epicardium.
C.Spatial or transmural dispersion of repolarization (TDR) within ventricular myocardium.
D.Repolarization of endocardium.
Dispersion of Repolarization within the Ventricular Wall: Implications for the Genesis of the T wave in the ECG
Epi, Endo, and M cells differ mainly with respect to repolarization characteristics. Epi and M cells display a prominent spike and dome morphology, largely absent in Endo cells. Moreover, M cells display more prolonged action potential duration (APD) than Epi or Endo cells, especially at slow rates of stimulation. Dispersion of repolarization across the ventricular wall has been suggested to underlie the inscription of the normal electrocardiographic T wave (Figure 32.1) and, when amplified, to contribute prominently to the development of cardiac arrhythmias. The magnitude of TDR is attributable to intrinsic differences in the APD of the 3 principal cell types that comprise the ventricular myocardium as well as the extent to which these repolarization differences are damped by electrotonic forces. Figure 32.1 illustrates the cellular basis for the inscription of the normal T wave1 in the ECG. Shown are transmembrane potentials and a transmural ECG recorded from 2 arterially perfused canine LV wedges. In both, repolarization of Epi is coincident with the peak of the T wave of the ECG, whereas repolarization of the M cells is coincident with the end of the T wave. The Endo APD is intermediate. Although repolarization of the Purkinje fiber occurs after that of the M cell (see Figure 32.1B), it does not register on the ECG.
Thus, the degree of electrotonic coupling, together with intrinsic differences in APD between the distinct cell types, determines the extent to which TDR is expressed and its impact on arrhythmogenesis, as well as on the morphology of the T wave of the ECG. TDR is in large part attributable to the presence of M cells between the Endo and Epi layers of the heart. TDR represents the difference between the longest AP (longest M cell) and the shortest AP (generally Epi cell) of the wedge preparation and correlates with the Tpeak–Tend of the ECG (see Figure 32.1). The hallmark of the M cell, discovered in the early 1990s and named in memory of Gordon K. Moe, is its ability to prolong its AP more than that of Epi or Endo APs following a slowing of rate or exposure to agents that prolong APD.2 The longer APD of the M cell results from the presence of a relatively weak IKs current density and the presence of relatively stronger INa and INa-Ca
Stay updated, free articles. Join our Telegram channel

Full access? Get Clinical Tree


