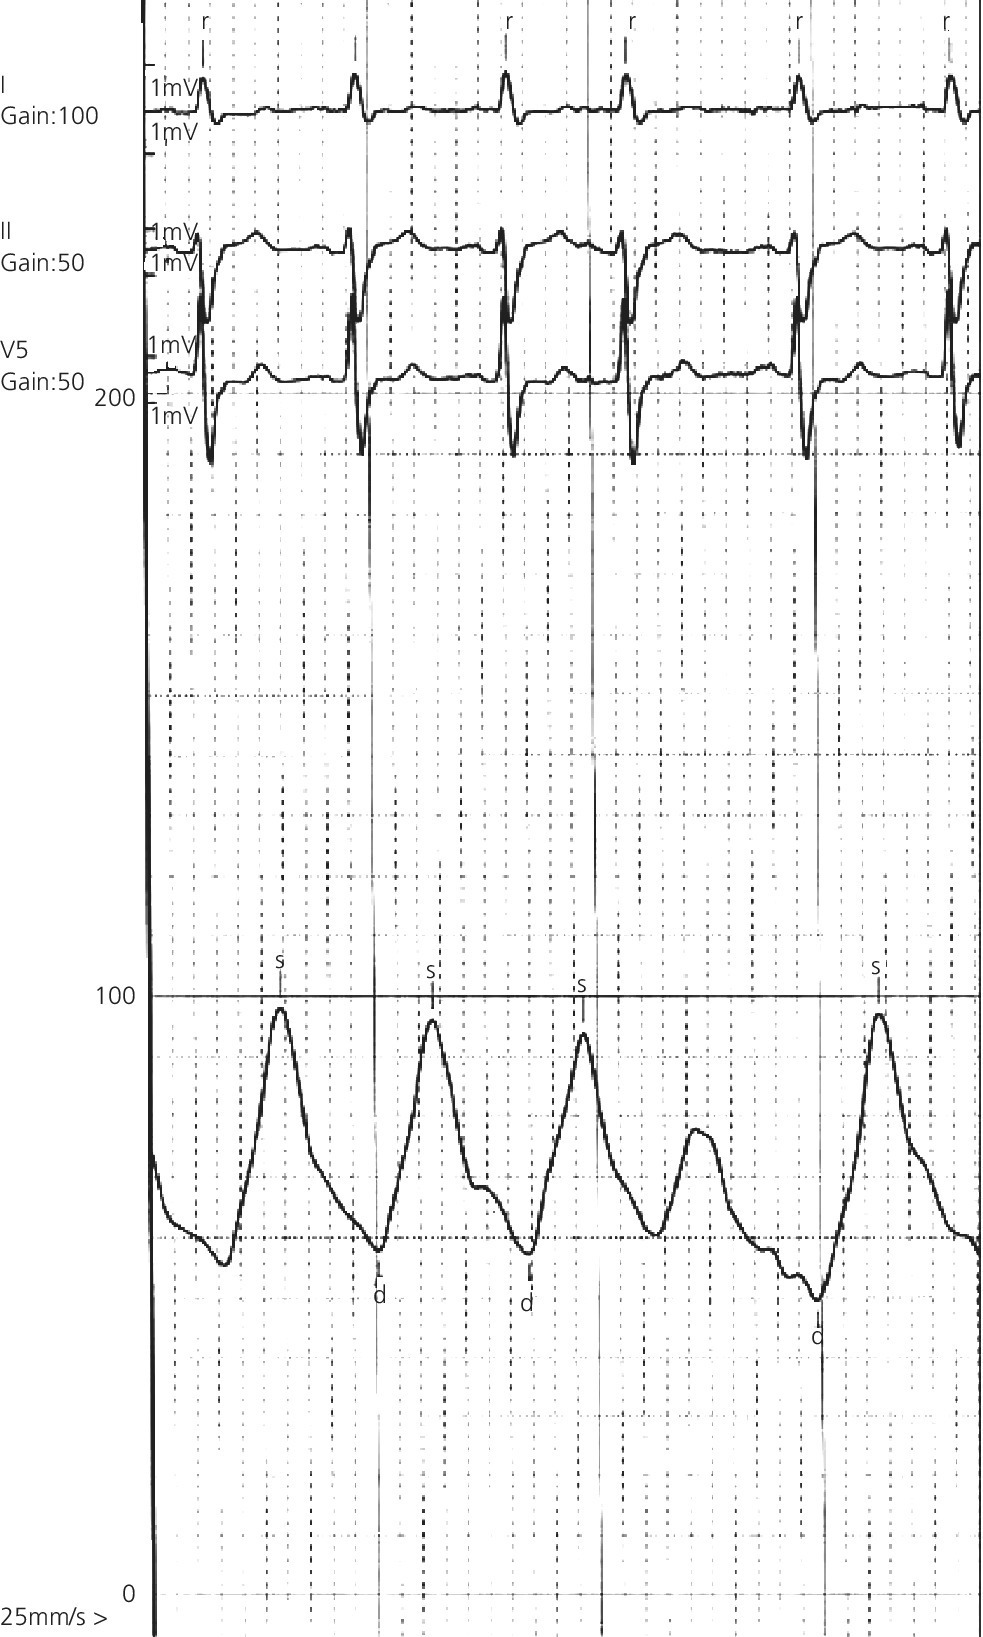
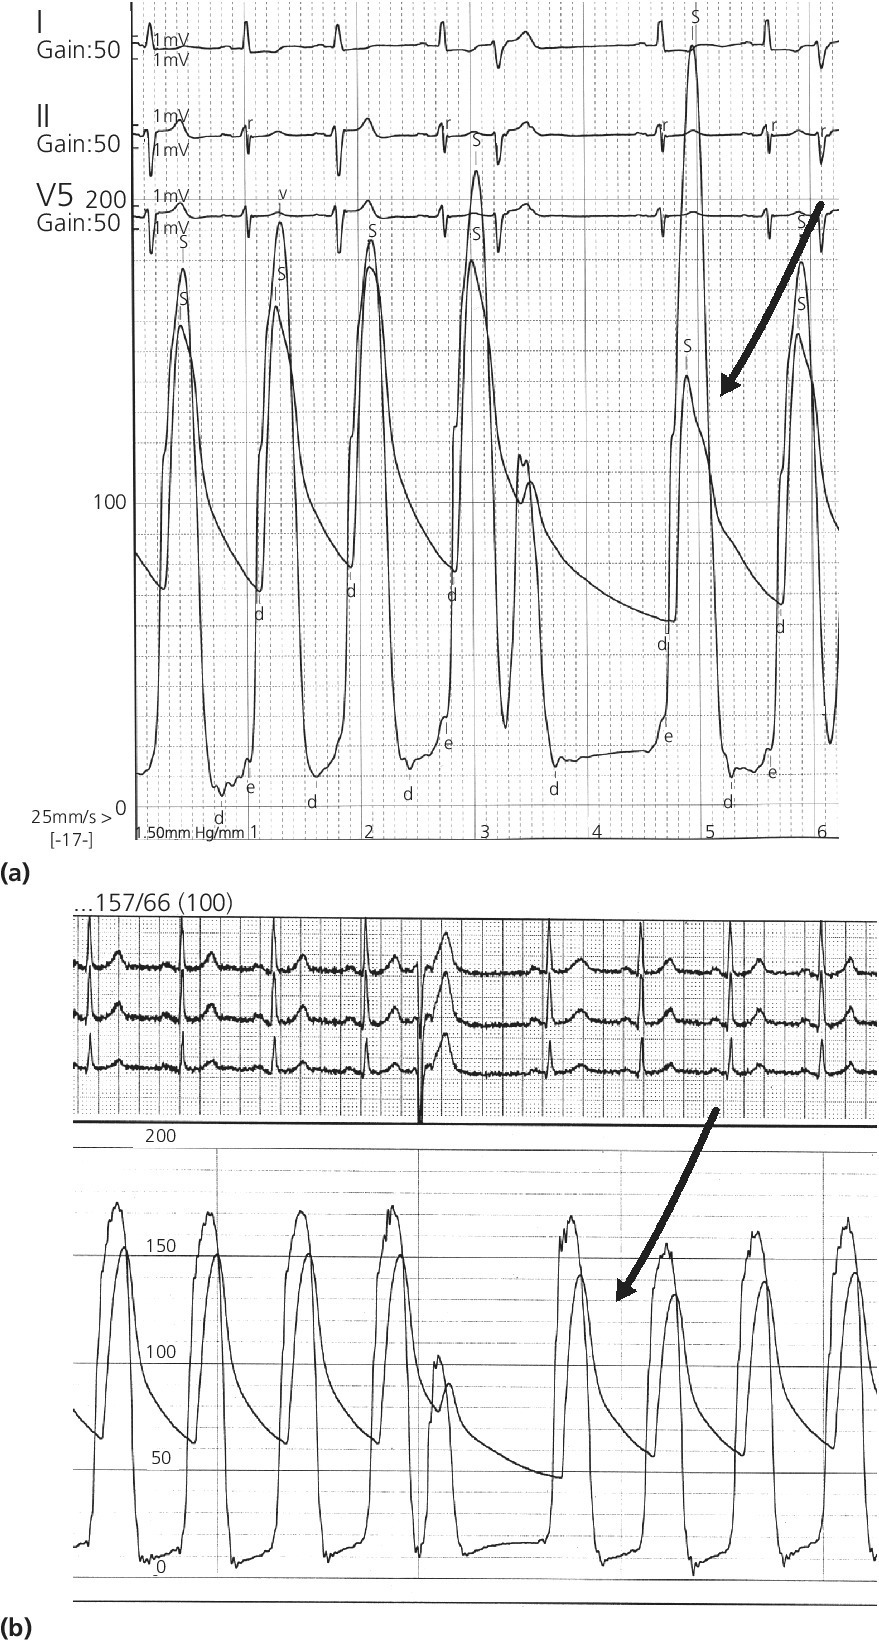
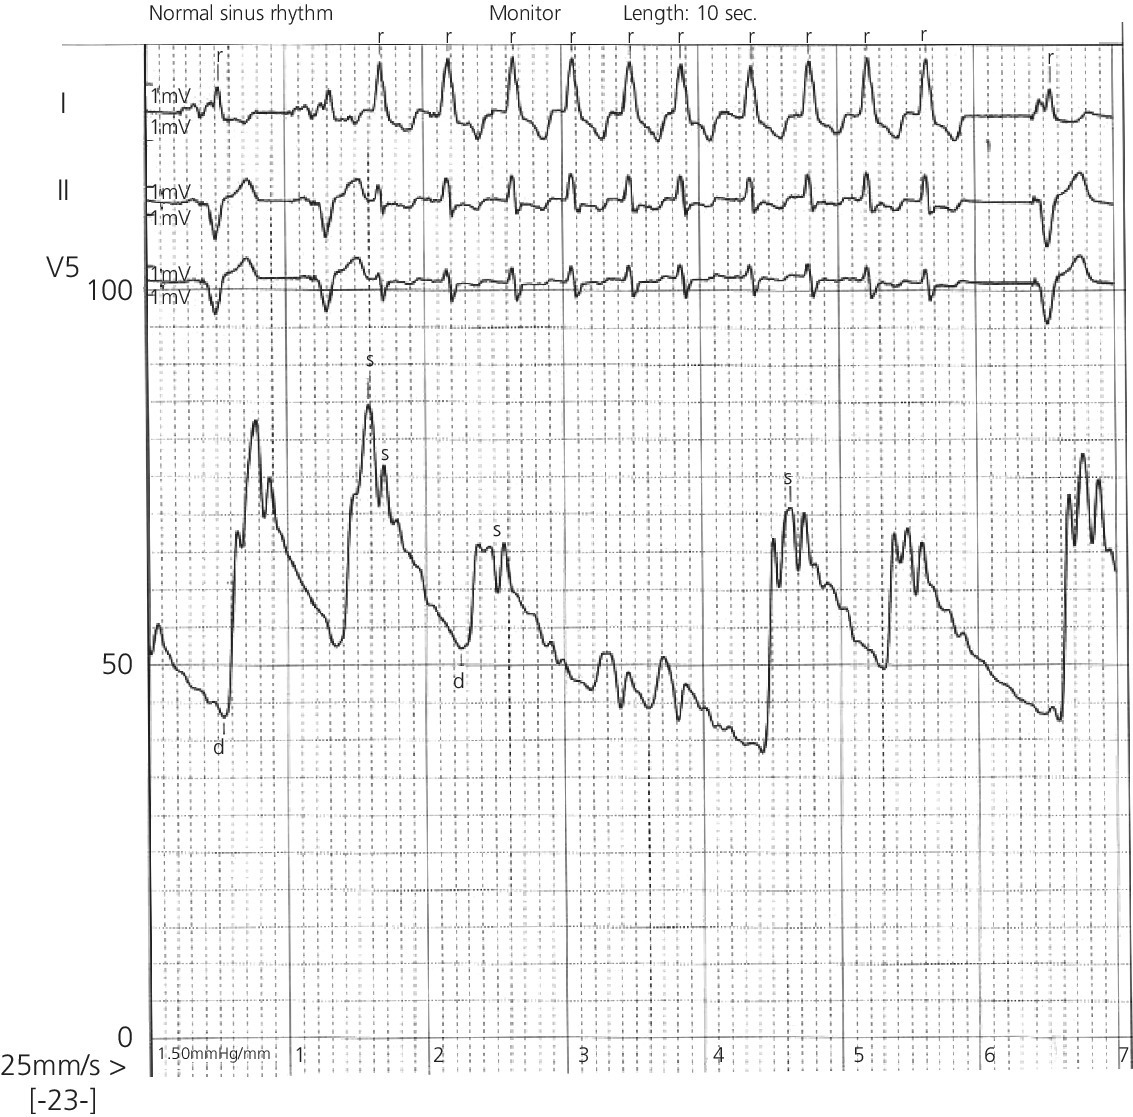
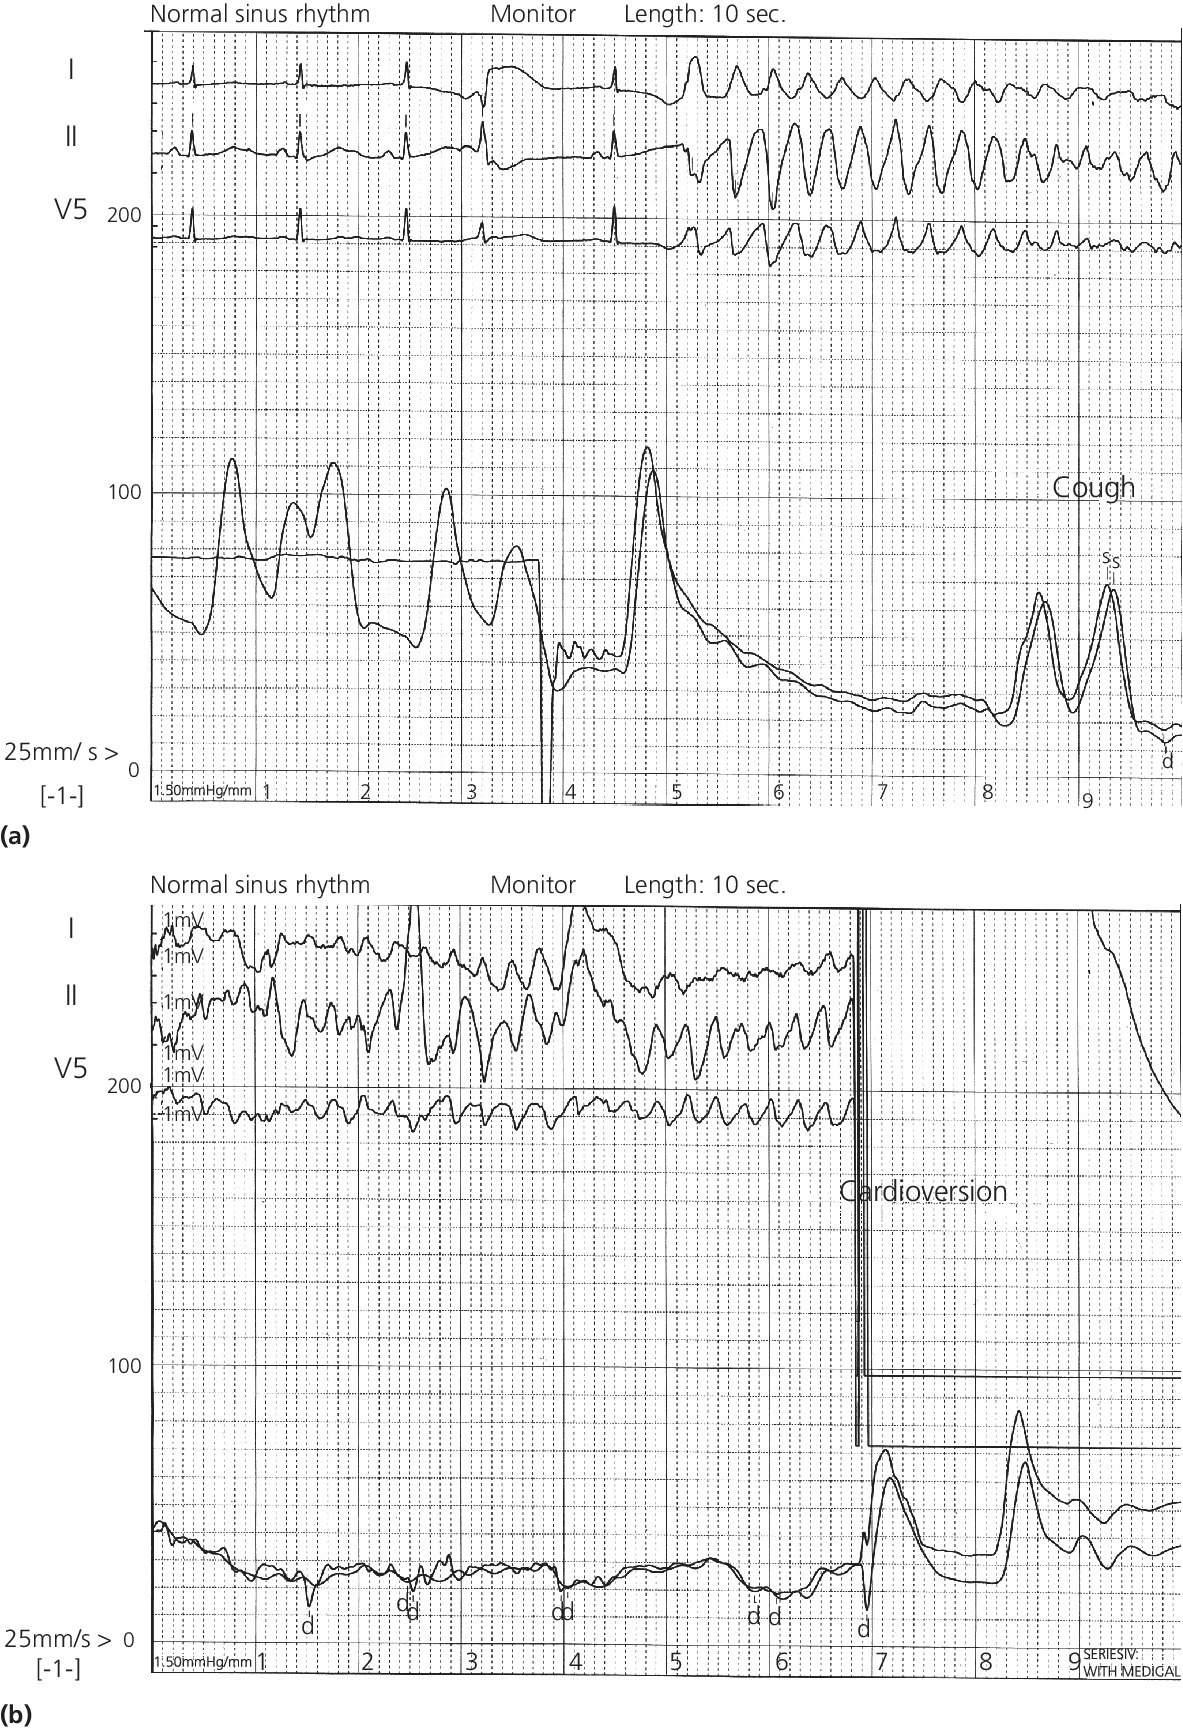
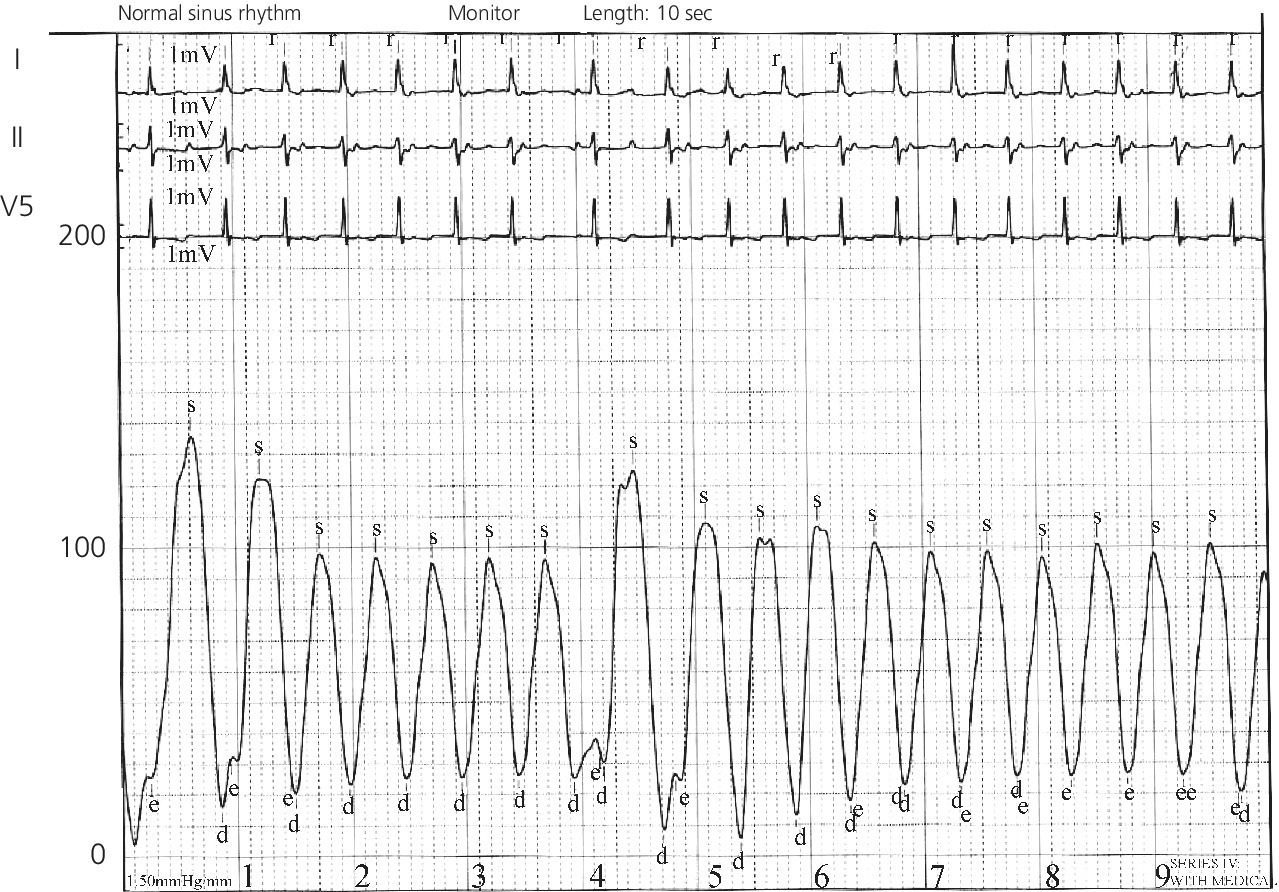
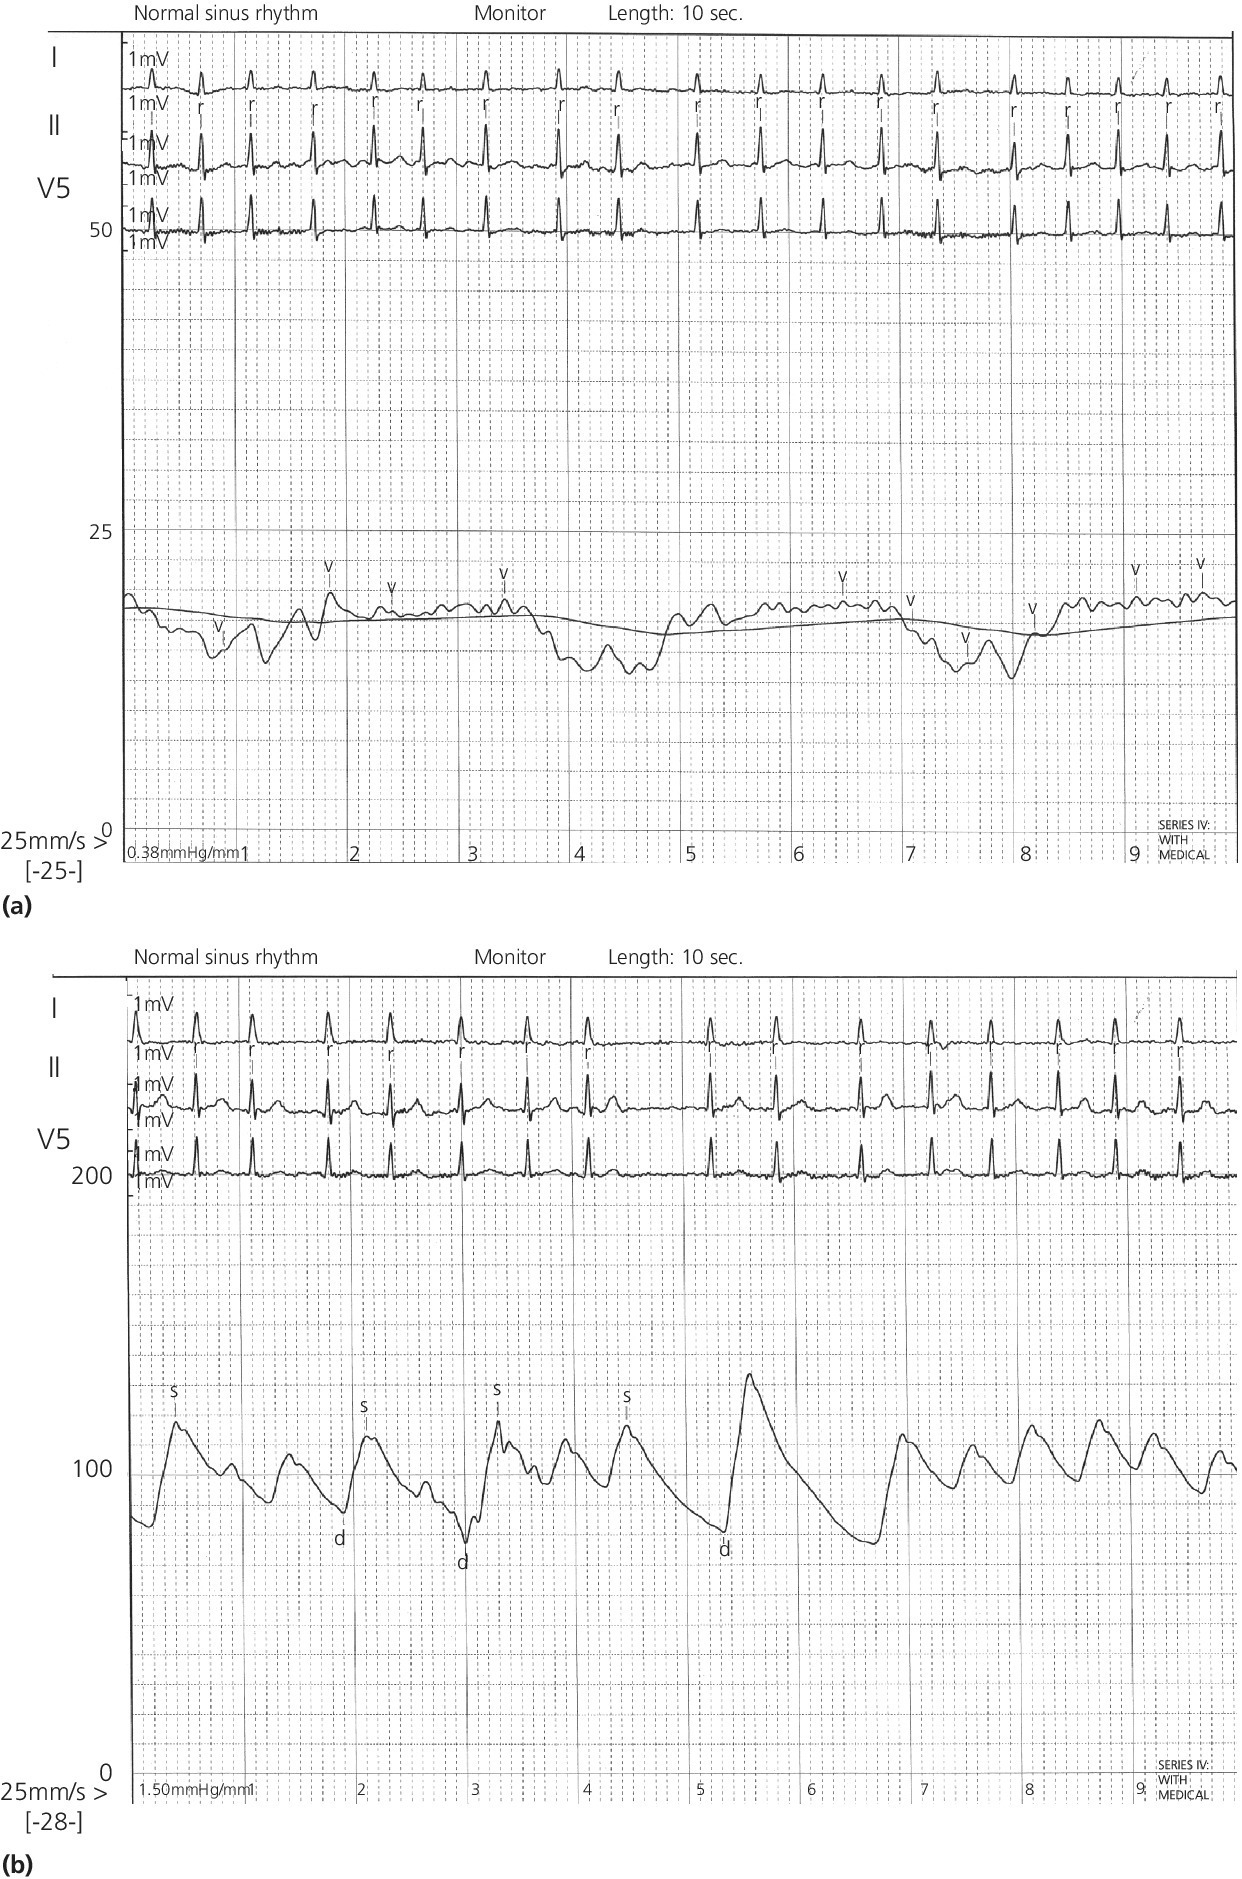
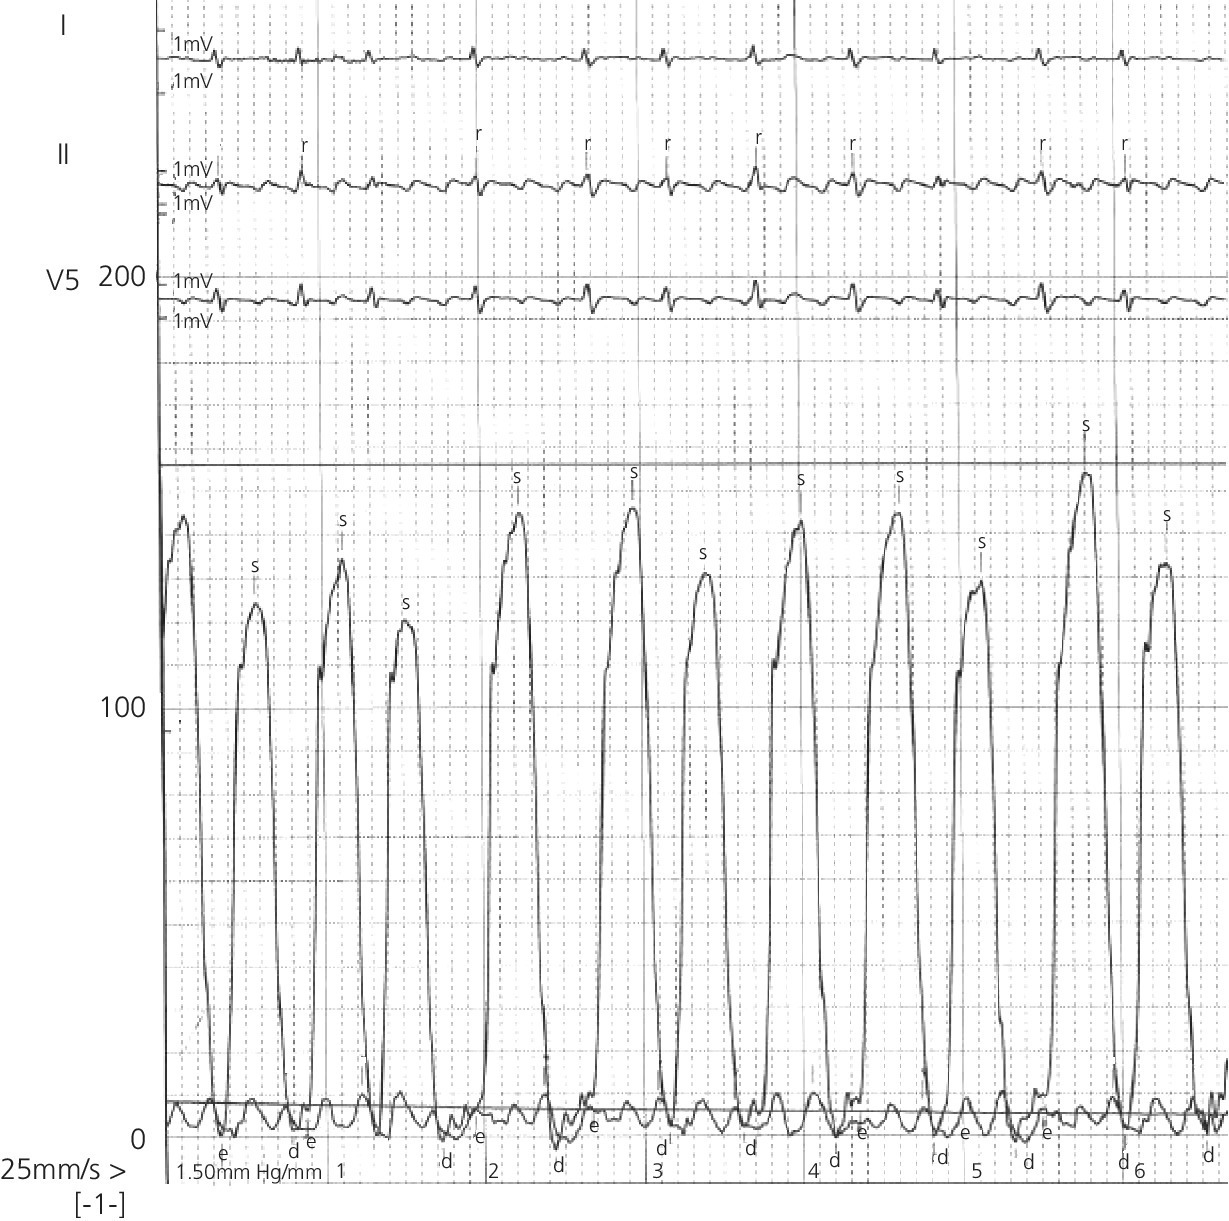
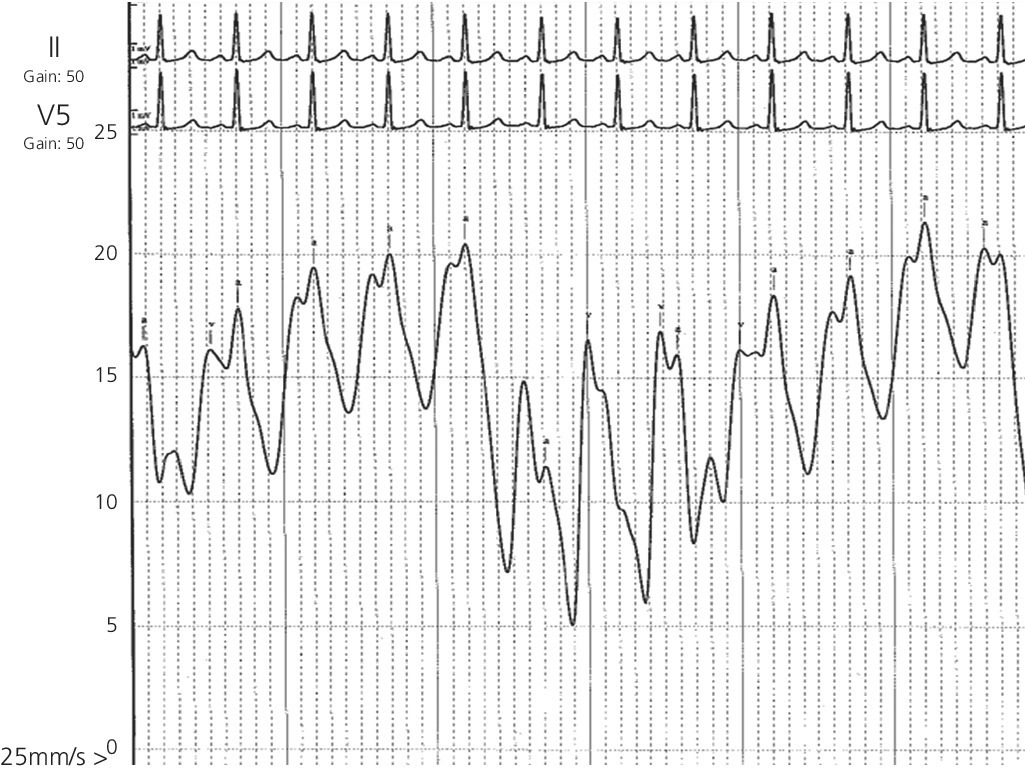
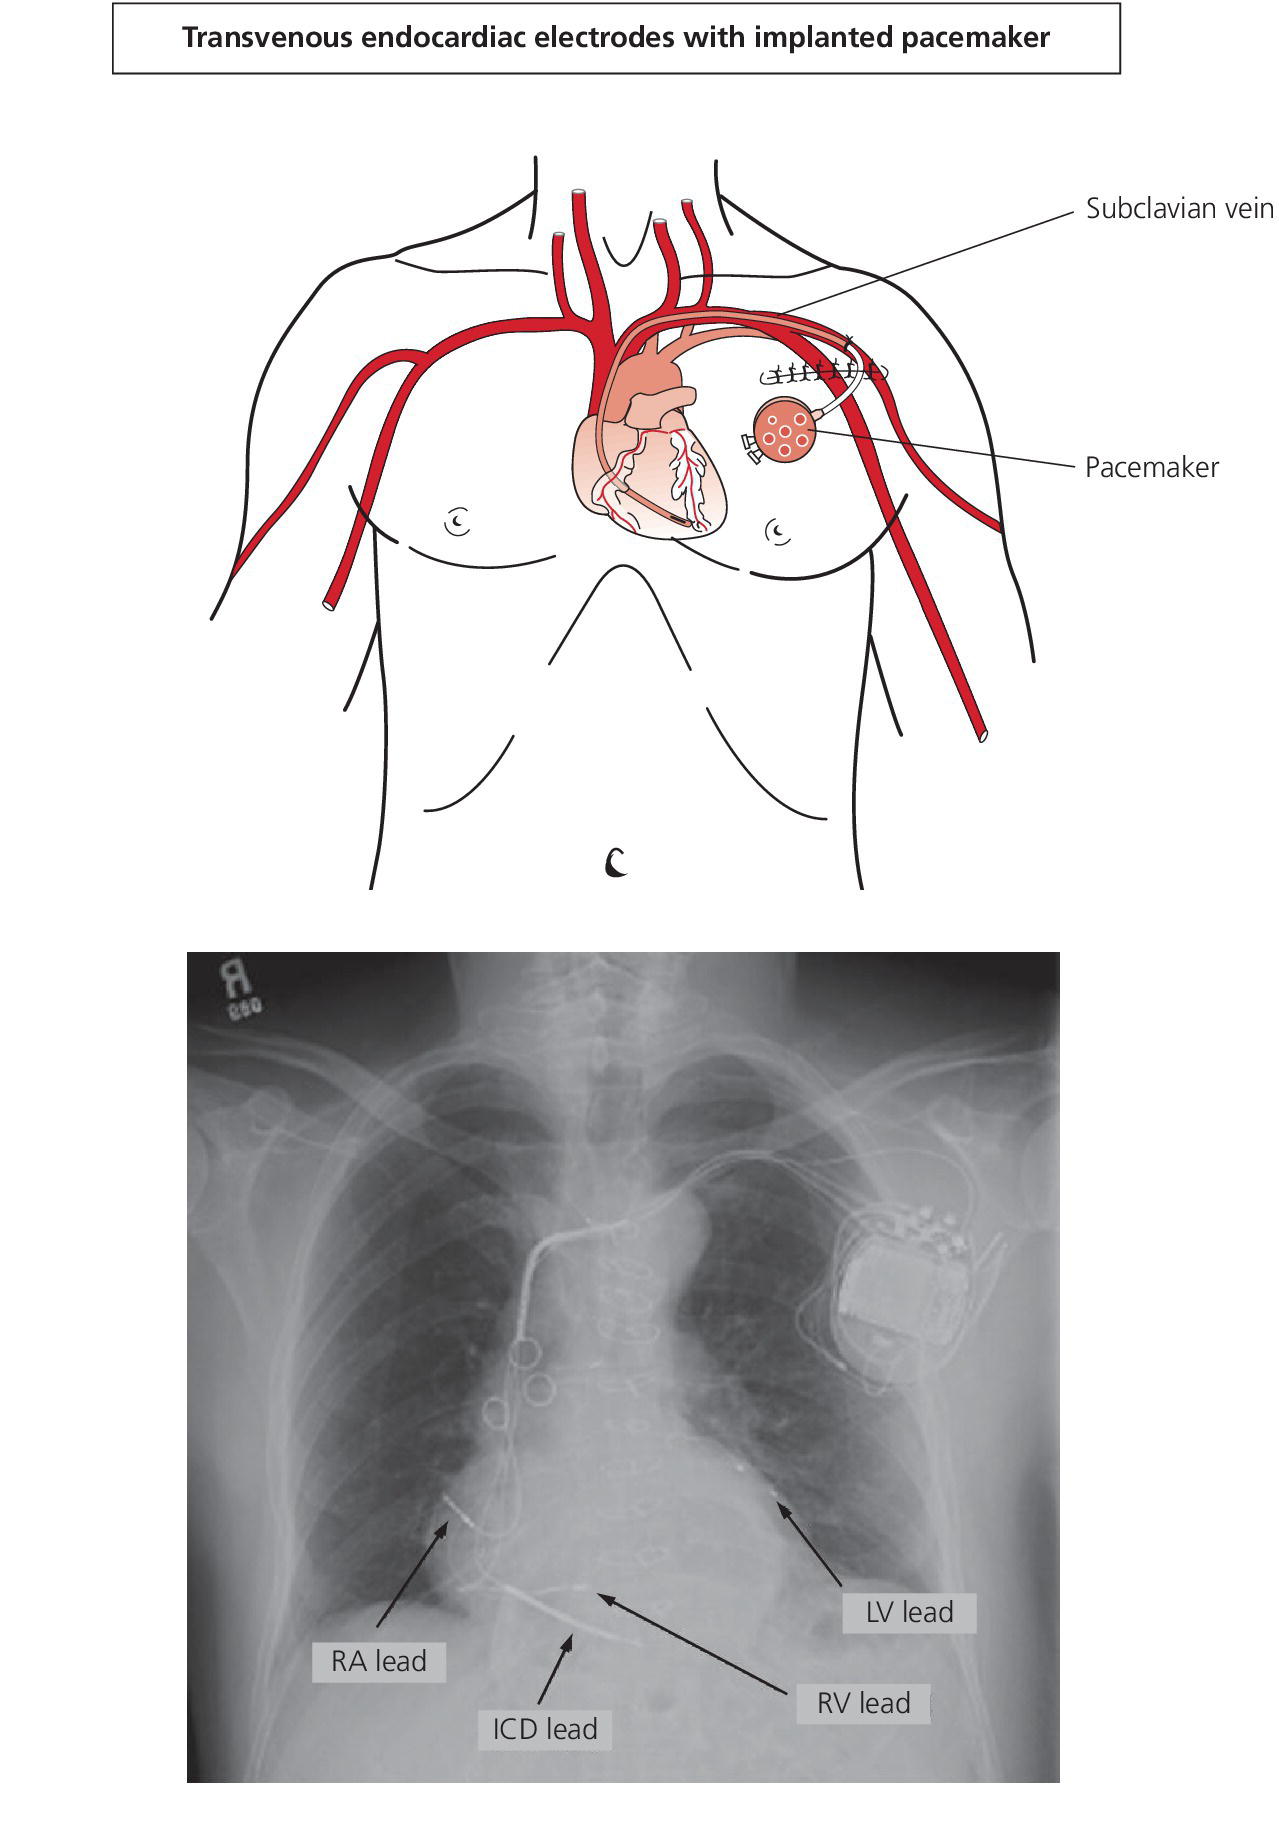
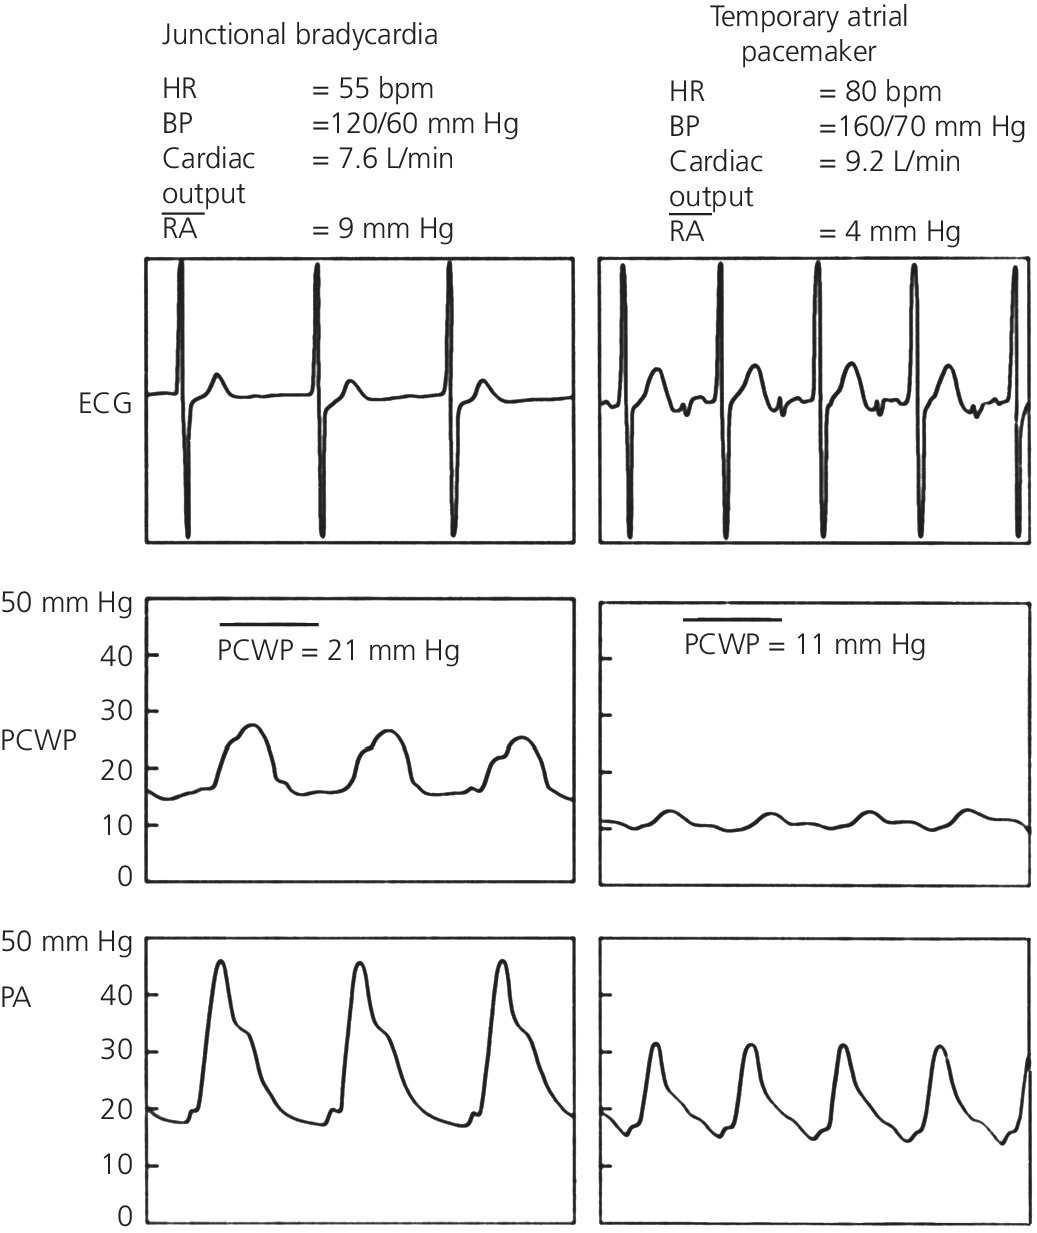
CHAPTER 27 Rodrigo Bolanos, Kimberly A. Selzman, Lukas Jantac and George A. Stouffer The cardiac rhythm is integral to the development of physiologic pressure waveforms. Disturbances in electrical conduction can change atrial and ventricular filling and contraction and, hence, hemodynamic parameters. This chapter will describe changes that take place as a result of some of the most common arrhythmias encountered in the coronary intensive care unit or cardiac catheterization laboratory. Although sinus tachycardia and sinus bradycardia usually represent normal cardiac physiology, they will also be discussed in this chapter because of their important effects on pressure tracings and hemodynamic parameters. Lastly we will discuss the hemodynamic effects of pacemakers. Perhaps the most frequently encountered cardiac arrhythmia is a premature beat, either a premature atrial contraction (PAC) or a premature ventricular contraction (PVC). Although a single ectopic beat is unlikely to have a clinically significant hemodynamic effect, the pressure tracings associated with it are interesting. As a result of the earlier than normal ventricular contraction and shortened diastolic filling time, the stroke volume and arterial pulse pressure are substantially reduced. The post‐ectopic beat tends to produce an increased stroke volume secondary to enhanced ventricular filling during the compensatory pause (Figure 27.1). An increase in arterial pulse pressure will also be evident. Figure 27.1 Aortic pressure tracing during PAC. A PVC can serve as an aid in diagnosing hypertrophic obstructive cardiomyopathy (HOCM). In HOCM, a characteristic post‐extrasystolic pressure change occurs in the aorta following a PVC. This finding was first described in 1961 and is termed the Brockenbrough–Braunwald–Morrow sign (see Chapter 15 for a further description of this sign). On the sinus beat immediately following a PVC, the aortic pulse pressure decreases (Figure 27.2). This finding is associated with HOCM, whereas other hemodynamic findings, including an increase in the left ventricular systolic pressure and an increase in the systolic gradient between the left ventricle and aorta, can also be seen with aortic valve stenosis. On palpation of the carotid pulse, a reduced impulse on the beat following an ectopic beat may be noted in patients with HOCM. Normally an increased impulse (i.e., increased pulse pressure) would be noted. Figure 27.2 Brockenbrough–Braunwald–Morrow sign. Simultaneous recordings of LV and aortic pressures in a patient with HOCM (a) and a patient with aortic stenosis (b). Note that pulse pressure falls in the post‐PVC beat in HOCM (arrow), but increases in the post‐PVC beat in aortic stenosis. Complete heart block causes dissociation of the electrical activity of the atria and ventricles. The resulting ventricular rate is dependent on the site of pacemaker activity (i.e., junctional or ventricular) that serves as an escape rhythm. Complete heart block is generally associated with a marked slowing in rate. Systolic blood pressure may be preserved, but the long periods between ventricular contractions are associated with lower diastolic blood pressure and lower mean arterial pressure (Figure 27.3). Figure 27.3 Aortic pressure tracings in a patient who developed complete heart block. Aortic pressures during a brief period (a) and sustained episode (b) of complete heart block are shown. Large A waves on atrial pressure tracings that result from atrial contraction when the mitral or tricuspid valves are closed are termed “cannon A” waves. Cannon A waves result when ventricular contraction takes place during or just prior to atrial contraction. This increases ventricular pressure to the point where the tricuspid or mitral valve does not open during atrial contraction, which results in increased atrial pressure. Any arrhythmia that causes atrioventricular dissociation (e.g., complete heart block, pacemaker syndrome, or ventricular tachycardia) can cause random cannon A waves (Figure 27.4). More rare are arrhythmias in which the atrium is activated via retrograde conduction (e.g., AV nodal reentry or some forms of ventricular tachycardia), which can cause regular cannon A waves. Figure 27.4 Right atrial pressure in a patient with complete heart block. Note the increase in A wave amplitude when the atrium contracts against a closed tricuspid valve (cannon A waves represented by arrows). Much like a PVC, ventricular tachycardia originates in the ventricles and represents an abnormal sequence of electrical as well as mechanical events. The P wave on an electrocardiogram (ECG) representing atrial activation may be visible during ventricular tachycardia. Atrial activation during this arrhythmia may take place as a result of normal antegrade activation from the sinus node or via retrograde conduction from the ventricles. Ventricular tachycardia resulting in complete atrioventricular dissociation will produce random cannon A waves. Less commonly, when atrial activation during ventricular tachycardia occurs via retrograde activation, cannon A waves will be observed in a regular fashion. The rapid rate and loss of atrial contribution to ventricular filling that are seen in ventricular tachycardia can lead to hemodynamic deterioration (Figure 27.5). As shown in Figure 27.6, the sudden onset of ventricular tachycardia in this patient resulted in the loss of systolic pressure generation and thus a steady decay in mean blood pressure. Figure 27.5 Aortic pressure in an elderly woman with a permanent pacemaker and a transient episode of ventricular tachycardia. Figure 27.6 Aortic and left anterior descending (LAD) coronary artery pressure in a patient who developed ventricular tachycardia following intracoronary adenosine administration. The patient was undergoing fractional flow reserve evaluation of a lesion in the LAD when ventricular tachycardia developed (a). The increase in aortic pressure with a cough can be seen. In panel (b), the return of pulsatile blood pressure can be seen following electrical cardioversion. During junctional rhythm, atria maybe activated via retrograde impulse originating in or around the atrioventricular node. The retrograde atrial activation is evident in leads I and II on the standard 12‐lead ECG, as the P waves, if seen at all, will be inverted. Atrial systole may occur during, before, or after ventricular systole in this setting. As seen with ventricular tachycardia, complete atrioventricular dissociation may also be present during a junctional rhythm. Because atria may be activated immediately following ventricular systole, cannon A waves can be observed on the right atrial (RA) hemodynamic recording. Although junctional rhythm is in general slow (40–60 bpm), accelerated junctional rhythm may compromise systolic pressure generation (Figure 27.7). Figure 27.7 Left ventricular pressure during an episode of junctional tachycardia. Because atrial fibrillation implies the lack of organized atrial activity, the A wave will be absent from the pressure tracings. Depending on the size of the atrium, V waves may also be lacking if the atrium is large enough to serve as a distensible, compliant reservoir (Figure 27.8a). Occasionally, atrial activity may produce enough pressure to open and close the mitral and tricuspid valves and give rise to a C wave on the RA pressure recording. The rhythm in atrial fibrillation is irregular, with a varying length of time spent in diastole. As a result, the stroke volume and hence arterial pulse pressure may vary greatly beat to beat. In general, the longer the diastolic period, the higher the pulse pressure (Figure 27.8b). Figure 27.8 Pressure tracings in a patient with atrial fibrillation. Right atrial (a) and aortic (b) pressure tracings during atrial fibrillation. Note the increase in aortic systolic and pulse pressure when the diastolic filling period is increased. In atrial flutter, atrial activity is more organized than in atrial fibrillation and atrial systole can occur (usually at a rate of approximately 300 bpm). The regular atrial activity is reflected on RA pressure tracings as flutter waves (Figure 27.9). Systolic pressure will vary with left ventricular filling. Almost always, atrial–ventricular block exists, whereby not every atrial impulse is conducted to the ventricles. Because atrial contraction can take place against a closed mitral or tricuspid valve, an exaggerated flutter wave similar to a cannon A wave may be seen. For a detailed description of the hemodynamic importance of atrial contraction, see Chapter 5. Figure 27.9 Left ventricular and right atrial pressure in a patient with atrial flutter. Sinus bradycardia or tachycardia may result in hemodynamic effects and pressure tracings that mimic other arrhythmias. During sinus tachycardia, for example, the cardiac cycle length is shortened, as evidenced by a decreased R–R interval (Figure 27.10). On the RA pressure waveform, one may not be able to distinguish separate A and V waves, because the A wave of one cycle comes progressively closer to the V wave of the preceding cycle as the heart rate increases. As a result, the tracing may resemble that of cardiac tamponade, because the Y descent will not be evident. As a result of the reduced diastolic filling time, stroke volume may be significantly reduced (although cardiac output may increase because of the increase in heart rate). Figure 27.10 Right atrial pressure in a patient with sinus tachycardia. Notice the short time between A waves and V waves and the lack of a Y descent. During sinus bradycardia, the R–R interval on an ECG is lengthened. As a result, a RA pressure tracing will reveal a longer diastolic period, evidenced by lengthening the interval between the V wave of one cycle and the A wave of the next cycle. On careful observation, one may be able to distinguish an additional positive deflection following the Y descent on the RA pressure waveform tracing. The etiology and significance of this waveform, termed the H wave, are unclear. Optimal cardiac performance is dependent on the proper timing of atrial and ventricular contraction. When the cardiac electrical conduction system becomes diseased, typically from ischemic heart disease, calcification, or a degenerative process, bradycardia or heart block may occur. These patients often require the placement of a temporary or permanent pacemaker. The first cardiac pacemaker was implanted in 1958 by Elmqvist and Senning via thoracotomy. Since that time, pacemakers have become smaller, more reliable, and more capable of mimicking natural conduction. Despite these improvements, there remain acute and chronic hemodynamic effects of pacemakers and understanding these changes in various patient populations is important in optimizing patient care and outcomes. The most common type of pacing is a dual‐chamber system in which both the RA and right ventricle (RV) are paced. Single‐chamber pacemakers pace only the RA or only the RV (Figure 27.11). With biventricular pacemakers, the left ventricle (LV) is also paced, usually via a posterior lateral branch of the coronary sinus (triple‐chamber pacing systems). The primary goal of pacemakers is to achieve “physiologic pacing.” The key components of physiologic pacing are optimization of atrioventricular (AV) synchrony, rate responsiveness, and interventricular synchrony. Figure 27.11 Schematic of where a permanent pacemaker lies in the chest and a chest x‐ray showing four cardiac leads in a patient with an ICD and biventricular pacemaker. AV synchrony involves the proper timing of atrial diastole and systole in relation to ventricular diastole and systole, so that ventricular preload is maximized, atrial pressures are optimal, and closure of AV valves occurs prior to ventricular systole. This is adjusted by varying the AV delay, which is programmable in all dual‐chamber and biventricular pacemakers. Rate responsiveness refers to the ability of a pacemaker to increase the rate appropriately to changing physiologic demands. This is typically achieved with an accelerometer or minute ventilation sensor built into the pacemaker. Interventricular synchrony addresses the coordination of contraction between RV and LV to optimize cardiac function. Atrial contraction and AV synchrony influence cardiac output and diastolic filling pressures (Figure 27.12). Dyssynchronous or asynchronous atrial contraction results in reduced end‐diastolic volume at a given end‐diastolic pressure, decreased LV end‐diastolic volume, reduced LV stroke volume, and reduced cardiac output. Two mechanisms have been implicated in the shift in the LV pressure volume curve that is observed during impaired atrial activity: (a) the loss of atrial contraction directly influences ventricular diastolic filling; and (b) failure of the atria to empty during ventricular diastole increases volume within the pericardium and thus filling pressures [1]. In a given patient, the absence of atrial contraction and/or loss of AV synchrony may result in altered hemodynamics, with important clinical implications. Figure 27.12 PCWP and PA pressure tracings during junctional bradycardia and atrial pacing. Source: Courtesy of WG Sanders, Jr. The loss of “atrial kick,” or ventricular diastolic filling from atrial contraction, may be particularly detrimental to patients with decreased ejection fractions or noncompliant ventricles. Atrial contraction may contribute up to 25–30% of diastolic filling in these individuals. This scenario may be observed in patients with bradycardia but preserved AV synchrony who are paced from the RV at a rate higher than the intrinsic rate (e.g., with a temporary pacing wire or a permanent single‐chamber pacemaker). The loss of atrial contraction may be evident as a nondistinct atrial pressure waveform and as lower RV and LV end‐diastolic pressures. If atrial contraction is present but occurs after ventricular contraction has begun, then the atria will contract against closed AV valves, often resulting in prominent A waves or cannon A waves on atrial pressure tracings. This scenario can occur when atrial activity does not precede ventricular activity (sinus node dysfunction), atrial activity is asynchronous with ventricular systole (complete heart block with AV dissociation), or there is conduction retrograde from the ventricles to the atria (VA conduction), resulting in contraction of the atria against closed AV valves. This lack of AV synchrony may lead to impaired ventricular filling and thus increase the mean right atrial pressure and pulmonary capillary wedge pressure (PCWP). Pacemaker syndrome is used to describe patients who respond adversely to the loss of AV synchrony during pacing. Symptoms of pacemaker syndrome range from pulsatile sensations in the neck to malaise, presyncope, or syncope in severe cases due to hypotension. This syndrome is most often seen in patients with a single lead pacing the right ventricular (RV) apex (VVI pacing mode) and intact sinus node function. The pacemaker will neither sense atrial activity nor time ventricular pacing based on atrial contractions. The development of dual‐chamber pacemaker systems that sense and pace both the atrium and ventricle has decreased but not eliminated pacemaker syndrome. These symptoms can occur in patients with dual‐chamber devices if the programmed parameters are inappropriate and allow asynchronous atrial and ventricular pacing. Similar to a single‐lead system, a dual‐chamber device with a nonfunctioning atrial lead will also lead to pacemaker syndrome symptoms. Patients exhibit a wide range of clinical sensitivity to the loss of AV synchrony. Some patients are asymptomatic, while others are completely intolerant. Likewise, the expected clinical benefit of reestablishing AV synchrony in patients through placement of a pacemaker is quite variable. Although multiple invasive and noninvasive studies have shown significant improvement in cardiac output with AV sequential pacing, the expected benefits have not been consistently borne out in clinical trials. Patient response is heterogeneous and it appears that patients with low or normal filling pressures benefit most from the “atrial kick” due to their position on the upslope of the Starling curve. Interestingly, patients with significantly increased filling volumes may be the least likely to have a correlation between “atrial kick” and increased cardiac output. These patients still appear to benefit from AV synchrony, but through other mechanisms, such as reestablishment of the optimal diastolic filling period and abolition of mitral regurgitation [2]. Numerous clinical trials have examined the benefits of “physiologic pacing”; that is, atrial‐based pacing systems that promote AV synchrony versus single‐lead systems (VVI). Generally accepted benefits of physiologic pacing include improved symptoms, a likely reduction in the risk of developing persistent atrial fibrillation, and possible trends toward fewer incidents of pacemaker syndrome and heart failure. At this time there is no uniform evidence across trials showing a mortality benefit or reduction in stroke with atrial‐based systems.
Hemodynamics of arrhythmias and pacemakers
Premature atrial and ventricular contractions
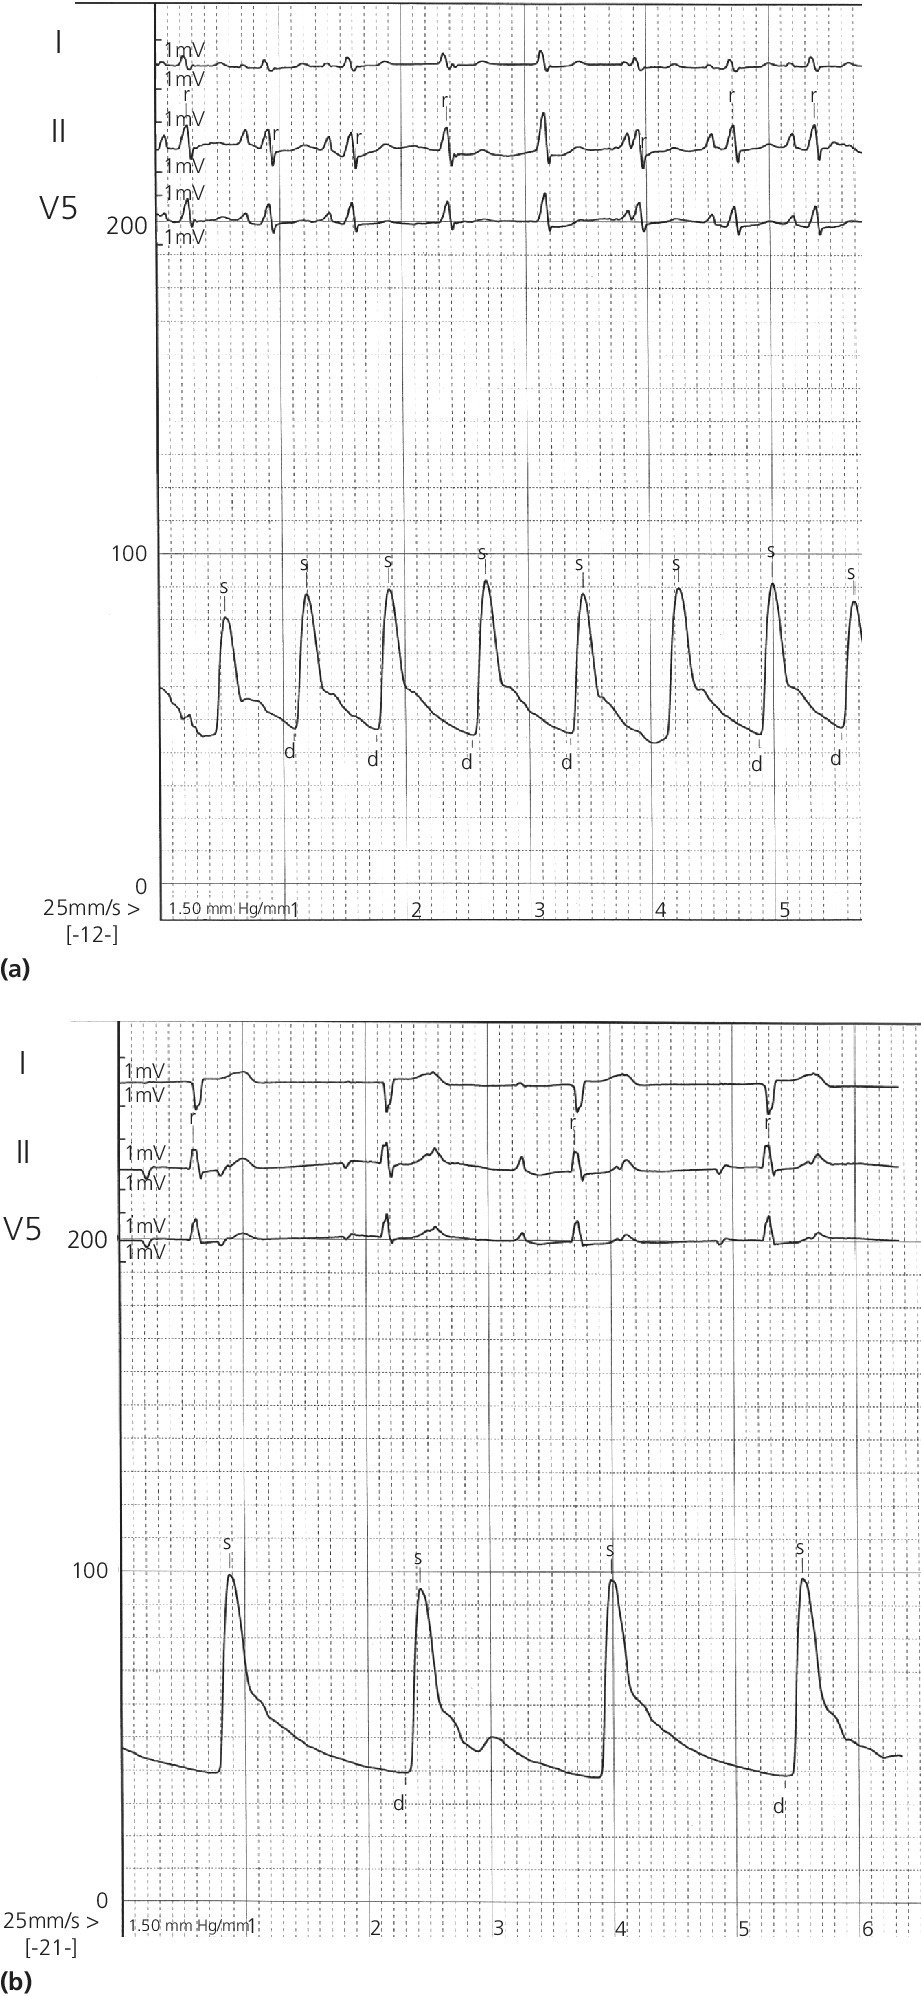
Heart block
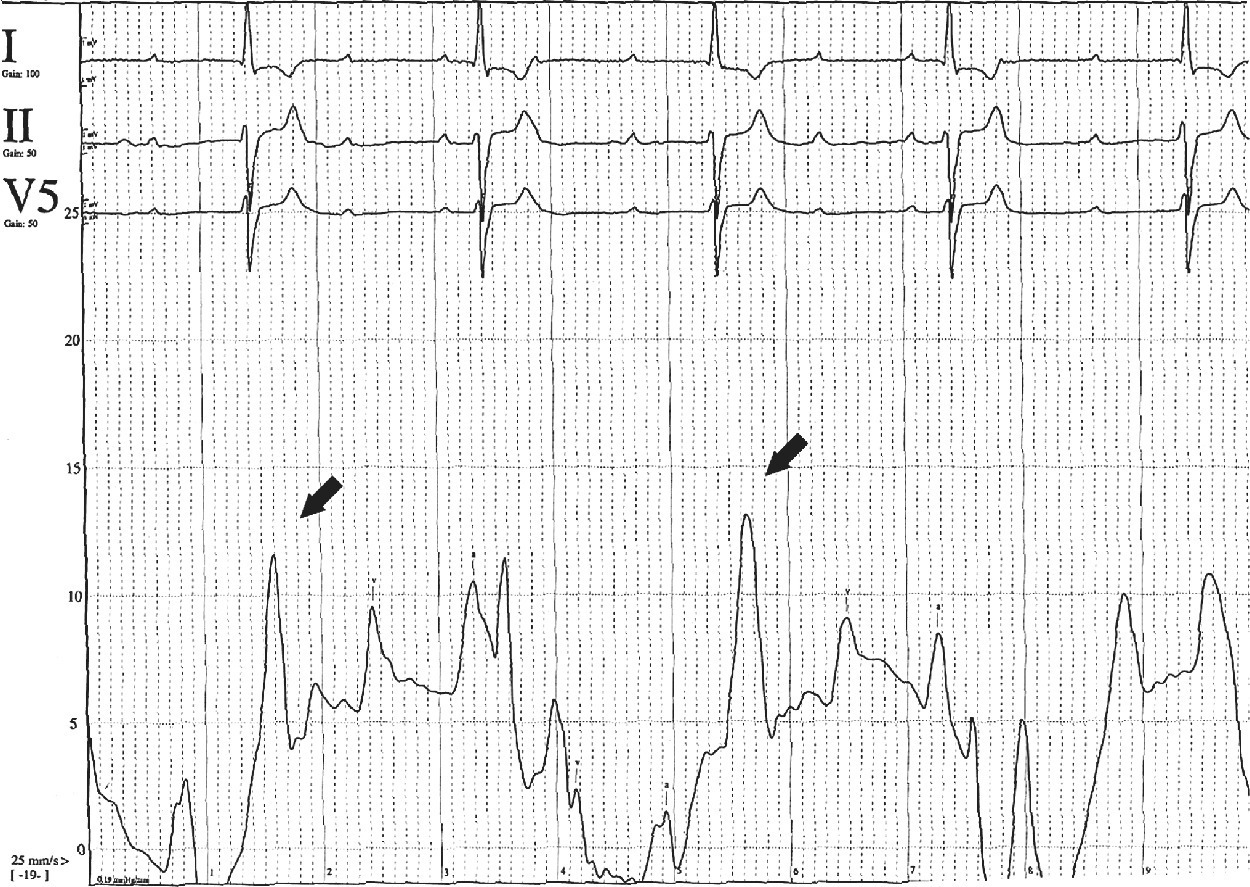
Cannon A waves
Ventricular tachycardia
Junctional rhythm
Atrial fibrillation and atrial flutter
Sinus bradycardia or tachycardia
Cardiac pacing
Physiology and pathophysiology of AV synchrony
Stay updated, free articles. Join our Telegram channel

Full access? Get Clinical Tree


