LEFT ATRIAL FLUTTERS AFTER AF ABLATION
Case presented by:
A 54-year-old man with prior failed antiarrhythmic drug therapy and ablation for long-standing persistent atrial fibrillation (AF) presents with recurrent palpitations.
Question No. 1: The ECG shown in Figure 21.1 suggests:
A.Typical atrial flutter (AFL).
B.Atypical left AFL.
C.Atrial fibrillation.
D.A and B are possible.
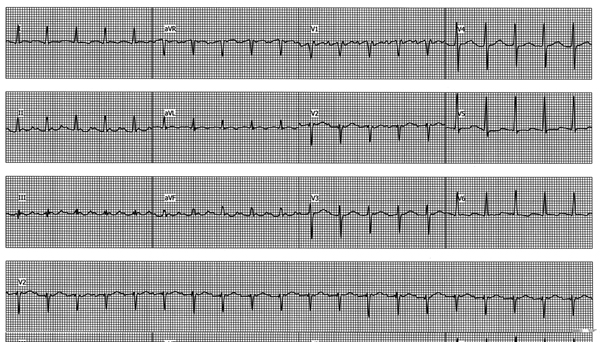
Figure 21.1. Rhythm strips recorded at presentation.
Intracardiac recordings of the tachycardia are shown in Figure 21.2.
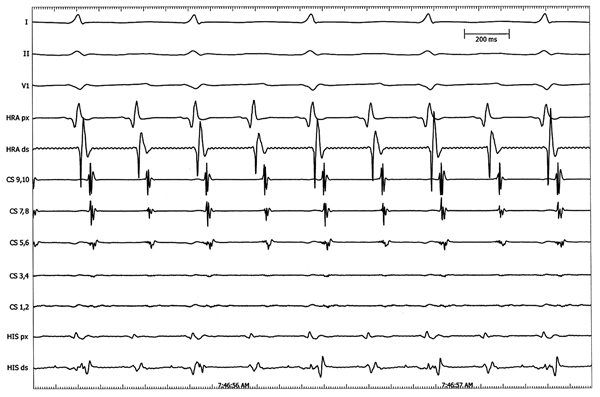
Figure 21.2. Intracardiac tracings of the tachycardia. Cycle length (CL) = 274 ms.
Question No. 2: The next best option would be:
A.Create a three-dimensional (3D) map of the tachycardia.
B.Entrain the flutter from right atrium (RA).
C.Entrain flutter from right and left atria.
D.Both A and C.
E.Perform cavotricuspid isthmus ablation.
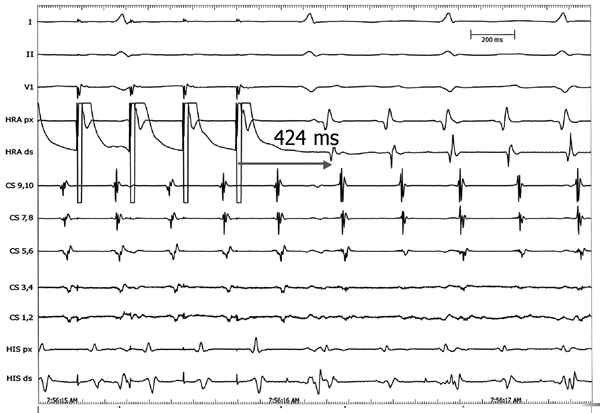
Figure 21.3. High right atrial pacing during tachycardia.
Question No. 3: High right atrium (HRA) pacing suggests:
A.Tachycardia is right sided.
B.Tachycardia is left sided.
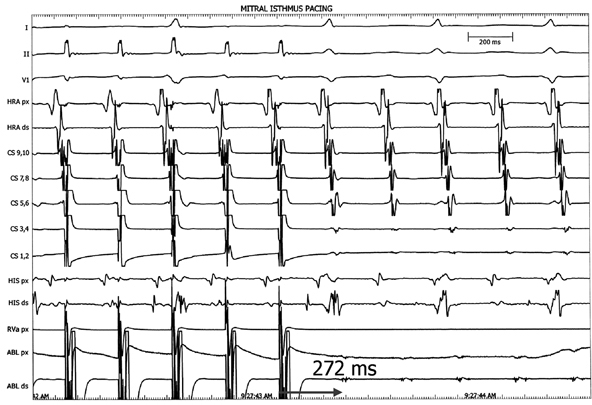
Figure 21.4. Mitral isthmus pacing.
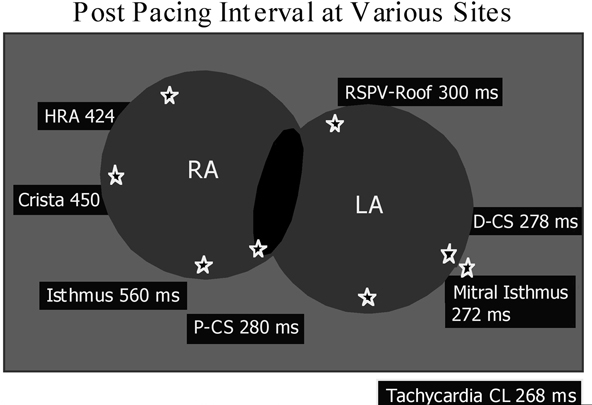
Figure 21.5. Pacing intervals at different locations.
Question No. 4: Based on Figures 21.4 and 21.5, ablation at which site is likely to be successful?
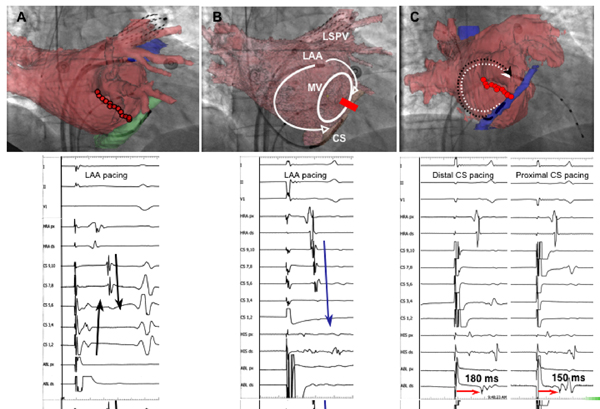
Figure 21.6. Pacing from left atrial appendage and coronary sinus (CS).
Question No. 5: Figure 21.6A, suggests that line of block across the mitral isthmus is:
A.Complete.
B.Incomplete, more ablation is needed in that area.
Discussion
The patient in the current case report presents following AF ablation. Patients with AFL following extensive ablation for AF usually have uncommon types of ECGs; hence it is usually difficult to differentiate right versus left AFL at times. Intracardiac tracings in Figure 21.2 suggest that high right atrial and His bundle atrial deflections are the earliest, which goes against typical cavotricuspid isthmus ablation. Pacing from the HRA further corroborates this, as the postpacing interval (PPI) is significantly longer than the CL of the tachycardia (Figure 21.3).
Figures 21.4 and 21.5 depict pacing from different locations, including the mitral isthmus region. Entrainment is best seen at the mitral isthmus region. The best PPI is seen during pacing at mitral isthmus region suggesting that it is perimitral AFL. Ablation at the mitral isthmus region (see Figure 21.6) terminated the tachycardia.
As depicted in Figure 21.6A, ablation is performed from the mitral annulus to the left inferior pulmonary vein (PV). Pacing was then performed from the left atrial appendage to assess conduction across the mitral isthmus region. In the Figure both proximal and distal CS leads are activated simultaneously, suggesting conduction across the mitral isthmus. However, close observation on the CT-fluoro registered image suggests that distal poles of the CS are distal to the line of block. In Figure 21.6B, the CS is pulled back and proximal CS is activated earlier, suggesting complete line of block across the mitral isthmus. This is further confirmed in Figure 21.6C, where the ablation catheter is placed at the mitral annulus distal to the CS and pacing performed from the proximal and distal CS poles. Time from the distal CS pole to the ablation catheter recording (due to longer time the impulse has to travel) is longer than that during pacing from the proximal CS.
Both atrial tachycardias (AT) and AFLs seen in the left atrium (LA) post-AF ablation have varying characteristics. Both macro- and microreentrant tachycardias are commonly seen, but at times focal tachycardias are not uncommon. 12-lead ECG for P-wave morphology, entrainment and activation mapping has been used to identify the mechanism and sites of these arrhythmias. Many of these tachycardias could originate from perimitral areas, could be roof-dependent, or could occur due to conduction through the previous ablation lines. A systematic approach is needed to identify the mechanism and successfully ablate these complex arrhythmias.
Approach to Atrial Arrhythmias from the LA Following AF Ablation
Surface ECG Identification of Ectopic Foci Triggering AF Surface ECG can be used to identify the location of the ectopic beats that initiate AF. Similar process can be used to try to identify the location of atrial arrhythmias post-ablation. Positive P waves in V1 in the absence of typical cavotricuspid isthmus-dependent flutter (CTI-AFL) typically suggest LA-AFL. Bochoeyer et al compared the 12-lead ECG between those with LA-AFL and those with counterclockwise (CCW) CTI-AFL (Table 21.1). In all patients with the LA septal circuit pattern, inferior leads had almost flat-line recordings. The maximal amplitude in any of the 3 inferior leads (II, III, and aVF) was significantly smaller for those with mitral annulus or posterior wall scar circuits compared with those with CCW CTI-AFL (1.6 ± 1 vs 2.68 ± 0.7 mV, p < 0.05).
Table 21.1. Surface Electrocardiographic Features: Comparison of Mean Voltage (in mV)
| RA CCW (n=38) | LA Septal Circuit (n=11) | LA Mitral Annulus (n=3) | LA Posterior Wall Macroreentry (n=8) | |
| Inferior leads* | 2.62 ± 0.7 | 0.08 ± 0.1† | 1.2 ± 0.35† | 1.6 ± 1† |
| Lead I | 0.005 ± 0.4 | 0 | –0.3 ± 0.57‡ | 0.9 ± 1† |
| V1 | 1.97 ± 0.35 | 2.3 ± 0.4§ | 1.6 ± 0.35§ | 1.6 ± 1.2§ |
*Mean ± SD of maximal amplitude in lead II, III, or aVF.
†p < 0.05 by t test compared with CCW.
‡Only one patient had negative flutter wave in lead I.
§p = NS compared with CCW.
CCW, counterclockwise; LA, left atrial; RA, right atrial.
(Adapted from Bochoeyer et al6 with permission from Wolters Kluwer Health.)
Definitions for Intracardiac Mapping
Stay updated, free articles. Join our Telegram channel

Full access? Get Clinical Tree


