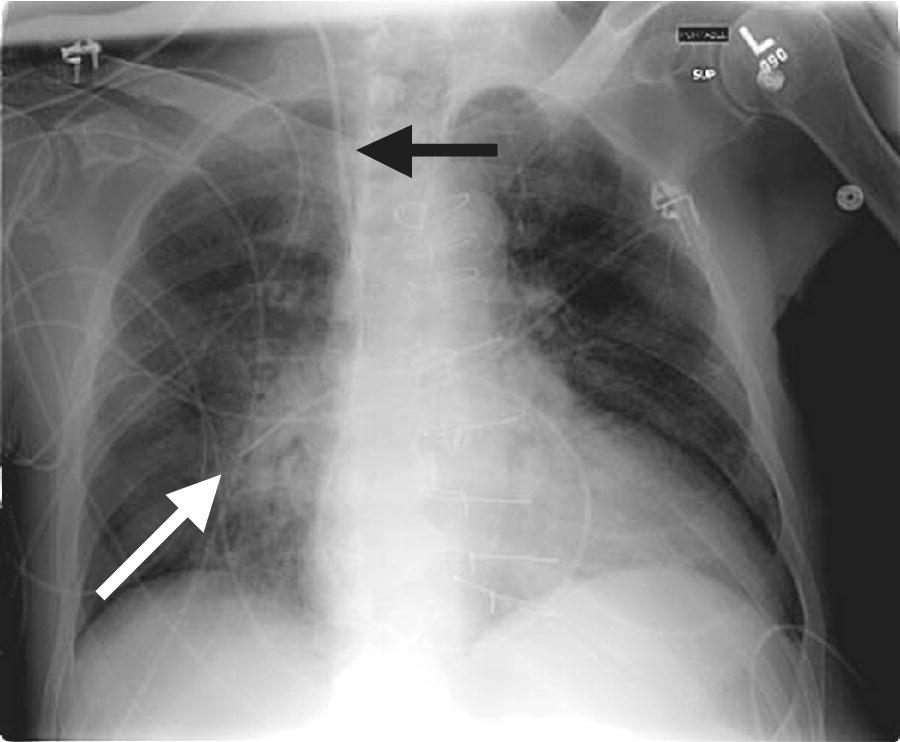
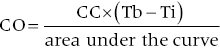
CHAPTER 2 Vickie Strang and George A. Stouffer The pulmonary artery (PA) catheter (also known as the Swan–Ganz catheter or right heart catheter) was developed in the 1960s by Dr. Harold Swan, Dr. William Ganz, and colleagues [1]. The typical PA catheter is 100–110 cm long and has either 3 or 4 lumens (one lumen is used to inflate the balloon and thus there is one less port than the number of lumens). There is a proximal port approximately 30 cm from the tip that generally lies in the right atrium (RA) and can be used to transduce pressure or as an infusion port. The distal port is at the tip of the catheter and is used to measure PA pressure and pulmonary capillary wedge pressure (PCWP). Near the tip is a balloon that can be inflated and a thermistor to measure temperature (Figure 2.1). Figure 2.1 Schematic of PA catheter. The PA catheter provides information about ventricular preload (e.g., RA pressure is a reflection of right ventricular [RV] preload and PCWP is a reflection of left ventricular [LV] preload), afterload (systemic vascular resistance and pulmonary vascular resistance), and cardiac output. The PA catheter can be helpful in various clinical scenarios, including valvular heart disease, congestive heart failure, cardiomyopathy, pericardial tamponade, shock, renal failure, pulmonary edema, pulmonary hypertension, or cardiac structural abnormalities. PA catheters are used primarily in three different settings: in the cardiac catheterization laboratory, in intensive care units (ICU), and in the operating room. Despite the tremendous theoretical benefits that could accrue from having the information obtainable from PA catheters, these catheters have never been shown to improve patient outcomes in either the operating room or intensive care unit (potential benefit has never been studied in the cardiac catheterization laboratory). In numerous studies examining various groups such as patients with heart failure, patients undergoing high‐risk noncardiac surgery, and patients with acute respiratory distress syndrome (ARDS), PA catheters have in general had no beneficial effects on survival with increased rates of complications (Table 2.1) [2,3,4]. These studies have been criticized for several reasons, including improper patient selection (e.g., including low‐risk patients who would not be expected to benefit), study design (e.g., expecting a monitoring tool to affect outcomes without specified treatment protocols), and not controlling for operator experience in either insertion of the catheter or interpretation of data. Currently, there is no clear consensus on whether PA catheters are beneficial or harmful, with articulate proponents on both sides. PA catheters remain in widespread use presumably because they provide benefit to individual patients, but the studies sound a note of caution against indiscriminate use of these catheters. Table 2.1 Sample of trials that have examined the effect of PA catheter use on mortality in critically ill patients. The effectiveness of a PA catheter depends on accurate assessment of the information provided. Waveform analysis is crucial for proper interpretation of data from a PA catheter and is discussed in detail in Chapters 3, 4, and 5. Cardiac output is discussed in Chapter 6. In this chapter, we will concentrate on the following topics: Let us begin by looking at one mechanical cardiac cycle. While the ventricles are in systole the atria are filling, as blood flows continually from the venous system, with the inferior and superior vena cava emptying into the RA and the pulmonary veins emptying into the left atrium (LA). Meanwhile, the tricuspid valve and the mitral valve remain closed as long as the pressure in the ventricles exceeds the pressure in the atria. Blood flow in the heart occurs due to pressure gradients. As ventricular pressure decreases during isovolumetric ventricular relaxation (Figure 2.2a), it reaches a point where atrial pressure is higher than ventricular pressure and the mitral and tricuspid valves open due to hydrostatic pressure. The ventricles now rapidly fill (rapid ventricular filling; Figure 2.2b). This rapid filling characterizes the first phase of diastole. During the second phase of diastole, the pressures in the atria and the ventricles are the same. During this time only a small amount of blood normally flows into the ventricles (slow ventricular filling). This is primarily blood returning to the atria from the great veins or pulmonic veins, which then passes into the ventricle. Near the end of diastole, the atria contract (atrial systole), which generates an increase in pressure in the atrium and enhances blood flow into the ventricles (Figure 2.2c). Figure 2.2 Schematic of blood flow in the heart. Phases represented include isovolumetric ventricular relaxation (a), rapid ventricular filling (b), atrial contraction (c), isovolumetric contraction (d), and ventricular ejection (e). Systole begins when electrical activation of the ventricles (QRS complex) leads to mechanical activation of the ventricles. Very shortly after onset of ventricular contraction, the pressure in the ventricle increases to the point where it exceeds atrial pressure and the mitral and tricuspid valves close (all four valves are now closed). As the ventricles contract (isovolumetric contraction; Figure 2.2d), right and left ventricular pressures increase until RV pressure exceeds PA pressure and LV pressure exceeds aortic pressure. At these points, the pulmonic and aortic valves open and ejection occurs (ventricular ejection; Figure 2.2e). At the end of systole, isovolumetric ventricular relaxation begins and ventricular pressures fall. A point to remember is that as heart rate increases, myocardial oxygen consumption increases while supply decreases. This is because time in diastole decreases and time in systole increases as heart rate increases, while most coronary artery filling occurs during diastole, but oxygen consumption of the heart is maximal during systole. About 70–90% of blood flow in the left coronary artery and one‐half of blood flow in the right coronary artery occur during diastole. During systole, intramural arteries and capillaries are compressed by the contracting heart muscle, which limits blood flow. A PA catheter can be inserted via any vein that has uninterrupted access to the RA. The most commonly used insertion sites include subclavian veins, internal jugular veins, and femoral veins. The site is generally chosen based on patient preference and operator experience. All things being equal, the right internal jugular vein provides the shortest and straightest path to the heart. The use of ultrasound has been shown to increase success rates for venous access and to decrease complications. Complications associated with venous access include bleeding, hematoma, arterial puncture, infection, pneumothorax, and hemothorax (Table 2.2). Advantages and disadvantages of various access sites are listed in Table 2.3. Table 2.2 Complications of PA catheters. Table 2.3 Advantages and disadvantages of venous access sites. A PA catheter can be positioned using either fluoroscopy or pressure monitoring. Fluoroscopy is preferred for femoral artery insertion and/or if there is significant hardware in the right heart (e.g., biventricular pacer). If continuous pressure monitoring is used, transduce the distal tip. Insert the PA catheter 20 cm and inflate the balloon with air. Central venous pressure (CVP) is initially obtained. As the catheter is being “floated” into the heart, it first enters the RA and then goes into the RV. Atrial waveforms consist of an A wave, a V wave, a C wave, and X and Y descents (Figure 2.3a). The A wave in the RA waveform coincides with atrial contraction and occurs simultaneously with the PR interval on the electrocardiogram (ECG), whereas the peak of the V wave in the RA waveform can be found near or at the end of the T wave. A further discussion of interpretation of atrial waveforms can be found in Chapter 5. Figure 2.3 Pressure tracings encountered during the insertion of a PA catheter. Entry of the catheter into the RV can be identified by the appearance of ventricular systole on the pressure tracing (Figure 2.3b). There will be a rapid upstroke reflective of ventricular contraction and a rapid decline reflective of ventricular relaxation. Diastole will be similar to the atrial tracing. A further discussion of interpretation of ventricular waveforms can be found in Chapter 3. Normal RV systolic pressure is approximately 25 mm Hg, with diastolic pressures ranging from 0–8 mm Hg. The only time you should see an RV tracing is when the PA catheter is being inserted or removed. An RV pressure tracing from the distal port of the catheter appearing on the monitor at any other time is an indication that the catheter is no longer correctly placed. With the tip of the catheter in the RV, the risk of ventricular tachycardia is markedly increased. Note that some continuous cardiac output catheters use a proximal port in the RV to monitor for correct positioning of the thermistor—the warning here is that if the pressure from the distal port of the catheter changes from PA to RV, that implies that the catheter tip is now residing in the RV. As the catheter is advanced, it will leave the RV and enter the PA (Figure 2.3c). Remember that RV and PA systolic pressures are the same (both should coincide with the T wave on the ECG). Thus passage into the PA will be evident from diastolic pressures. If an RV waveform is still present approximately 20 cm after the initial RV pattern appears, the catheter may be coiling in the RV. PCWP can be obtained by inflating the balloon on the catheter and advancing the catheter until it “wedges” (Figure 2.3d). When the balloon is “wedged,” blood flow is stopped in that portion of the PA. Pressure equalizes in a nonflowing segment and, since there are no valves between the pulmonary arteries and pulmonary veins or between the pulmonary veins and the LA, pressure at the tip of the balloon is reflective of LA pressure. The A and V waves of the PCWP tracing will be delayed relative to RA tracing and ECG, with the A wave starting in or at the end of the QRS complex, and the V wave starting later in the T–P interval. This is because LA pressure is reflected back to the PA catheter via the pulmonary veins and through a static column of blood. PCWP is an important measurement since it is an estimate of LV end diastolic pressure and thus LV preload. Tempe et al. [11] measured the distance to various chambers in 300 adult patients who had PA catheters placed via the right internal jugular vein. The right ventricle was reached at 25 ± 3 cm, the PA at 36 ± 4 cm, and the wedge position at 43 ± 6 cm. The length of catheter required was directly related to the height of the patient and was greater in patients with valvular heart disease. In general, indwelling PA catheters rest in the PA (Figure 2.4), continuously giving a readout of PA systolic and PA diastolic pressure. Mean RA pressure can be obtained if the CVP port is transduced (but will often appear damped because the lumen is small). Figure 2.4 Chest X‐ray showing placement of a PA catheter. The catheter was inserted via the right internal jugular vein. It passes through the superior vena cava (black arrow), RA, and RV. The tip rests in the right PA (white arrow). Always deflate the balloon before withdrawing the PA catheter. Remember the old saying: “Trash in equals trash out.” The integrity of the data obtained from a PA catheter is dependent on the accuracy of the system. A few simple rules to start out with: It is essential that the PA catheter be properly “zeroed” at the level of the RA, which in the supine patient is assumed to be in the fourth intercostal space at the midaxillary line. Proper “zeroing” removes the effect of gravity on pressures. To locate the level of the RA, two imaginary lines are drawn (Figure 2.5) and the place where they intersect is called the phlebostatic axis. To locate the phlebostatic axis, locate the fourth intercostal space on the edge of the sternum, draw an imaginary line along the fourth intercostal space laterally, along the chest wall, and draw a second line from the axilla downward, midway between the anterior and posterior chest wall (i.e., the midaxillary line). Figure 2.5 Phlebostatic axis. For every centimeter that the transducer is not correctly leveled, pressures will change by 0.75 mm Hg. If the transducer is too high, pressures will be falsely low. Alternatively, if the transducer is too low, pressures will be falsely high. Pressure is transmitted from the catheter to the transducer via tubing filled with fluid, usually saline. Small changes in pressure in the PA are transmitted through the tubing and cause deflection of the transducer membrane, which converts these changes into electrical signals. Anything that hampers transmission of these small pressure changes to the membrane will distort pressure measurements and cause pressure “damping.” Thus, it is important to use semirigid, noncompliant tubing, to minimize the length of tubing, and to make sure that there is no air in the pressure tubing. Other causes of pressure damping include long or compliant tubing, multiple stopcocks, transducer malfunction, loose connections, and partial occlusion of the port (e.g., with thrombus). It is important that the proper scale be used when interpreting the pressure tracings. For example, when measuring LV pressure a scale of 0–200 mm Hg is useful. However, if this scale is used when examining RA pressure tracings, much of the information is lost about the “A” and “V” waves and “X” and “Y” descents that would be apparent if a scale of 0–25 mm Hg was used. It is important that pressure tracings be interpreted in conjunction with an ECG recording. The most accurate method of obtaining hemodynamic data is to use a dual channel strip recorder, which will allow analysis of the waveform and ECG together. When interpreting atrial pressure waveforms, emphasis should be placed on mean pressures or pressures obtained at end‐expiration. In many intensive care units, all waveforms are read at end‐expiration because this is when intrapleural pressures are negligible, which means that the waveforms are an accurate reflection of cardiac pressures. In a spontaneously breathing patient, intrathoracic and thus intracardiac pressures will decline during inspiration and rise during expiration (Figure 2.6). The diaphragm pulls downward, creating a negative pleural pressure during inspiration, while the diaphragm relaxes and the elastic recoil of the lungs, chest wall, and abdominal structures compress the lung during expiration. Figure 2.6 Effect of respiratory variation on RA and PCW pressures. In patients who are mechanically ventilated, end‐expiration is still used to record pressures. The difference is that pressures increase with inspiration and decrease with expiration. If the patient is not breathing over the ventilator, then interpretation is straightforward. If the patient is ventilated and also breathing spontaneously, then waveform interpretation becomes more difficult, as inspiration can be associated with decreases in pressure (spontaneous respiration) and increases in pressure (ventilator). The spontaneous breath with pressure support will result in an initial decrease in pressure, which can be used to locate end‐expiration (just prior to the inspiratory effort marked by the dip in pressure). In patients receiving intermittent mandatory ventilation, identifying end‐expiration can be a challenge. There are newer ventilators that show graphic respiratory waveforms that provide a means for accurately identifying end‐expiration. In the intensive care unit, manual interpretation of waveforms using a printed copy is necessary to ensure that pressures are interpreted at end‐expiration, unless a monitor is available that displays the ECG, respiratory recording, and PA pressure waveforms on a single screen. A brief overview of cardiac output is presented here. For a more detailed discussion, see Chapter 6. There are two primary methods used to calculate cardiac output when utilizing a PA catheter: thermodilution and assumed Fick. The thermodilution method requires that a substance that is cooler than blood (usually saline) be injected through the CVP port of the PA catheter. This injection should be smooth and take less than 4 seconds. The temperature in the PA is measured and the change over time, as the cooler injectate passes through the PA, is used to calculate cardiac output. The computer in the cardiac output machine uses the following formula:
The nuts and bolts of right heart catheterization and PA catheter placement
The pulmonary artery catheter
Study population
N
Type of study
Mortality with PAC vs. without PAC
SUPPORT = [5]
Medical and surgical ICU patients
5735
Prospective cohort study
Increased mortality with PAC: odds ratio, 1.24; 95% confidence interval, 1.03–1.49
Sandham JD [6]
High‐risk surgical patients
1994
Randomized controlled trial
No difference in mortality
Richard C [7]
Septic shock and/or ARDS
676
Randomized controlled trial
No difference in mortality
ESCAPE [8]
Heart failure
433
Randomized controlled trial
No difference in mortality; in‐hospital adverse events were more common among patients in the PAC group
PAC‐Man [9]
Intensive care unit patients
1041
Randomized controlled trial
No difference in mortality
Fluid and Catheter Treatment Trial (FACTT) [10]
Acute lung injury
1000
Randomized controlled trial with explicit management protocol
No difference in mortality, ICU days or time on ventilator
Brief review of physiology relevant to right heart and pulmonary artery catheterization
Vascular access
Complications associated with vascular access
Complications associated with PA catheter insertion or removal
Complications associated with indwelling PA catheters
Problems causing inaccurate data interpretation
Hematoma
Arrhythmias
Damage to tricuspid or pulmonic valve
Improper calibration
Improper leveling of transducer
Bleeding
Damage to tricuspid or pulmonic valve
Infection
Air in tubing
Interpretation without using ECG
Arterial puncture
Infection
Thromboembolic
Effects of respiration not noted
Pneumothorax
Pulmonary infarction
Right bundle branch block
Pulmonary infarction
Inaccurate computation constant used to determine cardiac output
Hemothorax
Pulmonary artery rupture
Pulmonary artery rupture
Use of improper pressure scale
Site
Advantages
Disadvantages
Subclavian vein
Patient mobility; sterility
Risk of pneumothorax (especially in patients with COPD or on positive pressure ventilation); noncompressible site
Internal jugular vein
Compressible site; patient mobility; easily accessible
Inadvertent puncture of carotid; catheter can be dislodged from pulmonary capillary wedge position with neck movement; risk of pneumothorax
Femoral vein
Compressible site; easily accessible
Patient must remain in bed; infection risk
Brachial vein
Right heart catheterization can be done at the same time as left heart catheterization via radial artery
Brachial vein is smaller than subclavian, internal jugular, or femoral vein. Inadvertent cannulation of cephalic vein can make right heart catheterization difficult
Right heart catheterization and placement of a PA catheter
Ensuring that accurate data is obtained from a PA catheter
Cardiac output
Stay updated, free articles. Join our Telegram channel

Full access? Get Clinical Tree


