CELLULAR BASIS FOR CARDIAC ELECTROPHYSIOLOGY
Introduction
Cardiac muscle is an excitable tissue in which electrical activity reflects the organized gating of ion channels that activate and control cardiac impulse initiation, conduction, and contraction. Activation normally starts in the pacemaker cells in the sinoatrial node (SAN) and propagation of the electrical impulse through the atria, the atrioventricular conduction system and the ventricular myocardium coordinates excitation and contraction. Each myocyte is excitable and can excitate its neighboring cells. Cardiac cellular electrophysiology (EP) investigates the unique electrical properties of myocytes. Studying these electrical properties is important because: it provides knowledge that is the basis for clinical cardiac EP; and electric diseases of the heart (arrhythmias) are a major health problem, most of which incorporate alterations at the cellular level. Consequently, the objective of this chapter is to briefly review morphology of the action potential in different regions of the heart, the molecular structure and biophysical properties of multiple membrane ion channels and pumps in myocytes, the ionic basis of the resting and action potential, and the propagation of the action potential.
Morphology of the Action Potential in Different Regions of the Heart
During the cardiac cycle, individual cells generate action potentials that represent the change in transmembrane voltage over time. The action potential of one cell provides excitatory stimuli for its neighbors and initiates contraction by transmitting the extracellular signal to the cell interior. Thus, the cardiac action potential underlies the normal spread of electrical activity and resultant contraction of the heart muscle.
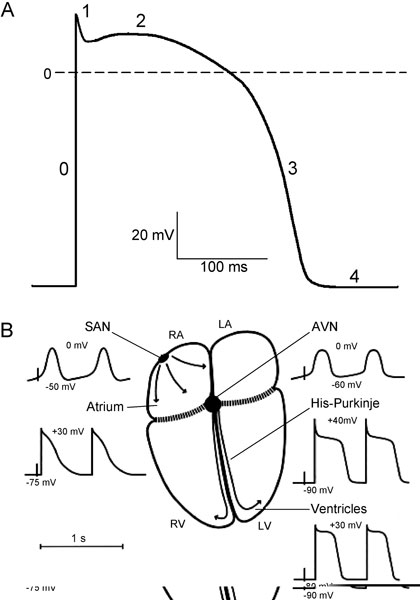
Figure 1.1. A: Schematic diagram of the cardiac action potential. The numbers refer to the action potential phases. B: Schematic diagram of action potential properties in different regions of the heart. RA and LA, right and left atrium; RV and LV, right and left ventricle; SAN, sinoatrial node; AVN, atrioventricular node. Maximum diastolic potential and overshoot potential are shown for each region. (Modified from Schram et al.49)
The action potential has 5 distinct phases (numbered 0–4) corresponding to clearly recognizable landmarks in its contour (Figure 1.1A). Phase 0 is the rapid depolarization (or action potential upstroke) that quickly brings the membrane potential from a negative value during diastole to a positive potential. Following phase 0 (at the end of the action potential upstroke), a brief partial repolarization (phase 1) sometimes occurs, which is interrupted when the cell reaches the plateau (phase 2). Phase 1 can result in the appearance of a notch between phases 0 and 2. During the plateau, repolarization progresses slowly, and the plateau phase is eventually ended by the final rapid repolarization (phase 3). Phase 4 is the period between termination of repolarization and the onset of the subsequent action potential. Membrane potential during phase 4 (diastole) can be a stable resting potential (atrial and ventricular myocytes) or a slow diastolic depolarization (nodal structures and His-Purkinje cells).
Large differences exist in the shapes of the action potentials among different regions of the heart. Differences are seen in diastolic potential, in upstroke and amplitude, in the shape of the plateau, and in the action potential duration throughout the heart (see Figure 1.1B). Based on a difference in origin of the inward current responsible for the action potential upstroke, cardiac cells can be subdivided in 2 groups: slow- and fast-response cells. The action potential upstroke of the slow-response cells is due to Ca2+ current and the depolarization of the fast-response cells is caused by Na+ current.
In pacemaker SAN cells, phase 4 is not constant, and spontaneous diastolic depolarization brings the membrane potential from the most negative value achieved at the end of the preceding repolarization (maximum diastolic potential) to the threshold of activation, eliciting a new response. The maximum diastolic depolarization is in the range between –50 and –65 mV and the threshold for activation is about –35 mV. Phase 0, carried by inward Ca2+ current, has a low upstroke velocity (1–10 V/s), therefore SAN cells are slow-response cells. The action potential duration is from 100 to 200 ms. The intrinsic frequency of discharge in SAN pacemaker cells is faster than that of any other pacemaker in the heart.
Atrial cells are not spontaneously active and have a stable resting potential of about –75 to –80 mV. Phase 0 depolarization, carried by Na+ current, has a maximum upstroke velocity (Vmax) of 100 to 200 V/s and an overshoot (the potential at the peak of the upstroke) of about 30 mV. After phase 1, a short plateau may occur, but often there is no clear separation between a plateau and final repolarization. The action potential duration is from 100 to 200 ms and is shorter in left atrium than in right atrium.
The primary function of the atrioventricular node (AVN) is to govern the ventricular response to supraventricular activation. Conduction through the AVN is slow and the cells have long refractory periods preventing dangerously rapid ventricular rates in response to supraventricular tachyarrhythmias. Action potential morphology in the AVN varies widely, depending on the nodal region. In the center of the AVN, action potential characteristics are similar to those of the SAN (see Figure 1.1B). The AVN cells have a low diastolic potential of –60 to –70 mV, and the potential is more negative close to His bundle. The AVN demonstrates a slow diastolic depolarization, but the rate of pacemaker activity is slower than in the SAN. The ionic currents contributing to AVN automaticity are similar to those in SAN. Spontaneous activity in AVN cells is suppressed by the higher SAN rate and by atrial electrotonic influences. However, the AVN can act as a subsidiary pacemaker: if the SAN fails, AVN cells can discharge spontaneously and excite the entire heart.
The His-Purkinje system forms the fast conducting system of the heart. The His bundle runs from the AVN through the connective tissue separating atria and ventricles. It then divides into left and right bundle branches, which continue into a network of Purkinje fibers electrically contacting the myocardium. Thus, the AVN-His-Purkinje system is the only electrical pathway connecting atria and ventricles. In contrast to nodal cells, Purkinje cells are highly polarized; their action potential upstroke velocities mediated by Na+ current are very fast (up to 800 V/s), resulting in a high propagation velocity (2–5 m/s). The action potential shows an overshoot of about 40 mV, which is followed by a fast repolarization (phase 1). A short notch can precede the plateau. The action potential duration is highly frequency-dependable and can vary from 200 to 500 ms. An important characteristic of His-Purkinje cells is their ability to generate spontaneous activity. The frequency of these spontaneous discharges is significantly slower than in nodal cells.
The resting membrane potential in ventricular myocytes ranges from –80 to –85 mV; the maximum upstroke velocity is 100 to 200 V/s, and there is an overshoot of about 30 mV. The plateau is relatively positive (10–20 mV) and phase 3 repolarization is rapid. Similar to atrial muscle, there is no phase-4 depolarization or automaticity. Regional (apex–base and transmural) ventricular heterogeneity of the action potential is well-established. Action potential duration is shorter in cells at the apex than at the base of the ventricle. Compared with endocardium, epicardial action potentials have a smaller overshoot, a more prominent phase 1 followed by a notch, and a shorter duration, whereas resting potential and Vmax are not different. The action potential propagates in ventricular myocardium at a velocity up to 0.5 m/s.
Summarizing the preceding paragraphs, they demonstrate that the magnitude and time course of action potentials vary significantly from one cardiac region to another. In this way electrical activity in each region of the heart is adapted to its specialized function. The regional differences in morphology of the action potential reflect differences in the expression and/or the properties of the ion channels. Therefore, to provide insight into ionic mechanisms governing regionally specialized cardiac electrical activity, the properties of the channels most important for normal electrical activity in the heart must be understood.
Ion Channels
The myocyte membrane is a phospholipid bilayer, a very thin nonconductive medium that separates 2 conductive media: the intra- and extracellular environments. Generation of the myocyte action potential results from the sequential activation and inactivation of different ion channels that conduct either inward (depolarizing) or outward (repolarizing) currents. Ion channels are protein structures that span the membrane; effectively, they are water-filled pores through which ions can move from one side of the membrane to the other according to their electrochemical gradients. The electrochemical gradient for each ion is established by the transmembrane potential, which is in the range of –60 to –95 mV (depending on the region of the heart), and the extracellular and intracellular concentrations of an ion. For the ions that determine the major depolarizing and repolarizing currents in myocytes, the extra- and intracellular concentrations are, respectively: sodium (Na+) 140 and 10 mmol/L (ratio 14:1), potassium (K+) 5 and 150 mmol/L (ratio 1:30), calcium (Ca2+) 2 and 10–4 mmol/L (ratio 2×10⁴:1). Although intracellular Ca2+ content is about 2 mmol/L, most of this is bound or sequestered in intracellular organelles—mitochondria and sarcoplasmic reticulum (SR).
Two major functional properties characterize ion channels: their selectivity and gating. Selectivity refers to the property of a channel to discriminate between ions of similar size and charge, permitting passage of one type to the exclusion of all others. Another important feature of ion channel function is gating—the process by which channels transition between open and closed states. Depending on their gating mechanism, all ion channels can be divided into 3 major groups: voltage-gated, ligand-gated, and gap junction channels. Voltage-gated channels have a sensor within their protein structure to monitor the electric field; opening or closing of the pore is influenced by transmembrane potential. Channel opening of ligand-gated ion channels is controlled by an appropriate ligand present in intracellular or extracellular spaces. Gap junction channels are responsible for electrochemical and metabolic intercellular coupling. They provide a low-resistance pathway between adjacent cells facilitating the spread of excitation.
Sodium channels
Voltage-gated Na+ channels carry the inward current (INa) that initiates the action potential and are responsible for propagation of excitation in atria, ventricles, and the His-Purkinje system. They are also present at low density in the SAN and AVN cells, but seem to play little or no physiological role in those tissues because the channels are inactivated at the low diastolic potential (about –60 mV). However, INa can contribute to the total inward current in neonatal SAN pacemaker cells.1 Sodium channels are protein complexes consisting of a large α subunit (which contains the ion-conducting pore and the voltage sensor to gate the channel) and one or two auxiliary β subunits2 (Figure 1.2A). The human cardiac α subunit (Nav1.5) is encoded by the gene SCN5A, which is located on chromosome 19.3 Interestingly, recent data demonstrate an interaction between KChIP2, a K+ channel interacting protein that is an accessory subunit for the Kv4 family of channels, and SCN5A. Specifically, KChIP2 appears to affect expression of Na+ channel α and β1 subunits.4
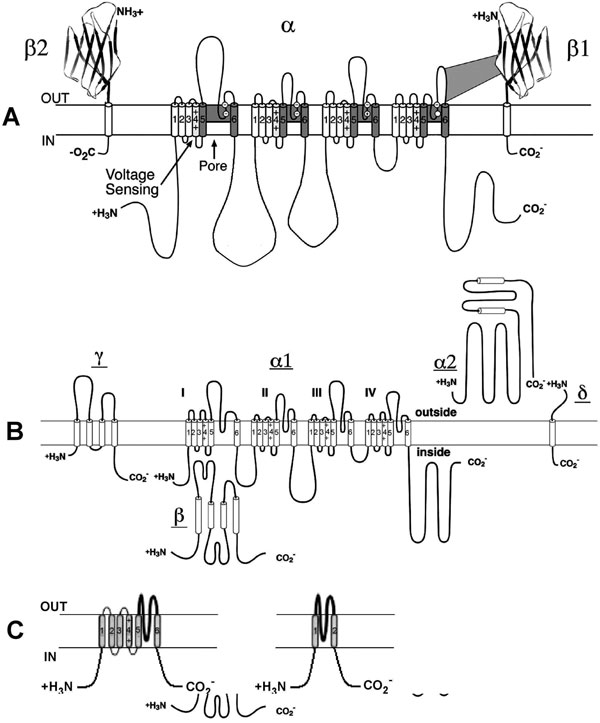
Figure 1.2. Molecular structure of Na+, Ca2+ and K+ channels. A: Voltage-gated Na+ channel folding model depicting the α, β1, and β2 subunits. The α subunit consists of 4 homologous domains each with 6 transmembrane segments. The ion-conducting pore is formed by transmembrane segments 5 and 6 (S5 and S6) of each homologous domain. The S4 segment contains positive charges every third amino acid that sense transmembrane potential. Modified from Catterall et al.50 B: Subunit structure of Ca2+ (Cav1) channels. The primary structure of the pore-forming α1 subunit is similar to α subunit of Na+ channel and composed of 4 homologous domains, each of which consists of 6 transmembrane segments. The α2δ and γ subunits contain transmembrane domains, whereas the β subunit is entirely intracellular. Modified from Catterall et al.51 C: The transmembrane folding of α subunits of voltage-gated (left) and 2 transmembrane-domain (right) K+ channels. The α subunit of voltage-gated K+ channels is homologous to the domains of the Na+ and Ca2+ channels and the channels are formed as tetramers. Inward-rectifying K+ channel proteins consist of 2 transmembrane segments with a pore loop in between.
Sodium channels have 3 functional states: closed, open, and inactivated. The channels are normally closed at the resting membrane potential (approximately –85 mV) and they open upon depolarization positive to threshold (from –70 to –60 mV) (Figure 1.3A), allowing Na+ ions to go down their electrochemical gradient and further depolarize the cell. The inward current (INa) increases with depolarization due to the voltage dependence of channel activation. This induces a regenerative increase in Na+ conductance and causes the membrane potential to depolarize at a rate of about 200 V/s in ventricular muscle (~500 V/s in Purkinje fibers). Maximum peak INa is seen at membrane depolarization to between –30 and –20 mV (see Figure 1.3B). On depolarization to more positive potentials, the amplitude of INa decreases due to the reduction in driving force (see Figure 1.3B). The sodium channel opening is immediately followed by inactivation that is also voltage-dependent and initiated by depolarization. Inactivation shortens INa and results in its termination (see Figure 1.3A). An inactivated channel can open again only after it has recovered from inactivation. This requires a return to negative membrane potentials and is fastest at the resting potential.
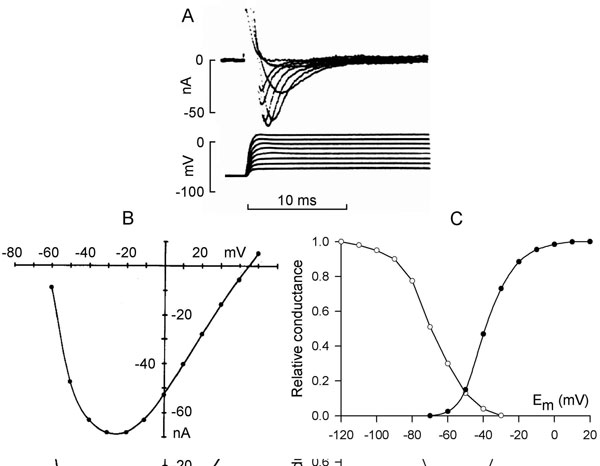
Figure 1.3. Sodium current. A: Time course of sodium current in rabbit Purkinje fibers elicited by depolarization to different membrane potentials. Modified from Colatsky.52 B: Current–voltage relationship of peak INa. C: Steady-state activation (solid symbols) and inactivation (open symbols) curves of sodium current in rat ventricular cells. Modified from Brown et al.9
Inactivation and reactivation of INa are relatively rapid processes (2–10 ms duration) and their voltage dependency explains the time course and the voltage dependence of sodium current. Steady-state activation and inactivation have been described by a Boltzman distribution (see Figure 1.3C), which showed that in a limited range of potentials, activation and inactivation curves overlap. This crossover produces a small, sustained sodium current, the so-called window current.5 Also a small fraction of sodium channels inactivates slowly, generating a small current over a broad range of potentials.6,7 The range of window current includes the voltages of the action potential plateau, and the window and slowly inactivating currents contribute a small amount of inward current that sustains the action potential plateau.
Single sodium channel conductance is about 20 to 25 pS,8 the whole-cell peak current at physiological extracellular Na+ concentration and temperature is on the order of 70 to 140 nA, and current densities at peak currents are 0.5 to 1 nA/πF.9
Calcium channels
Calcium influx through Ca2+ channels plays an important role in maintenance of the action potential plateau in atrial, ventricular, and His-Purkinje cells and also triggers SR Ca2+ release that facilitates contraction. Two main types of Ca2+ channels, T- and L-type, are expressed in myocytes. Both are voltage-activated. However, they have different electrophysiologic and pharmacological characteristics, and are differently expressed in the heart. The names T-type and L-type reflect the different kinetic behaviors of these channels (transient and long-lasting currents, respectively).10 The T-type calcium current (ICaT) is activated relatively rapidly and by weak depolarization. In contrast, the L-type current (ICaL) is activated relatively slowly and by strong depolarization. L-type channels are present in all regions of the heart, whereas T-type channels are nearly absent in atrial and ventricular cells and are expressed in Purkinje and SAN cells but with a lesser density than L-type.10 The L-type channels are characterized by a larger single channel conductance in comparison to T-type and are the dominant Ca2+ channels in the heart. Molecular structure of the L-type calcium channel is shown in Figure 1.2B. The Cav1.2 nomenclature (vs α1C) is more formally accepted now. The human Cav1.2 subunit that is sufficient to express channel activity is encoded by the CACLN1A1 gene on chromosome 12p13.3. It resembles the sodium channel with 4 homologous domains and a region between 5 and 6 segments of each domain. A highly charged S4 segment acts as a voltage sensor for activation. The β subunit and α2 subunit (which is linked to a small intramembrane δ subunit) are involved in modulating kinetics and in affecting expression. In addition, KChIP2, the accessory subunit for Kv4 family of channels, functionally modulates the cardiac Cav1.2.11
Compared to INa, relatively large depolarizations are needed to activate ICaL, and it has relatively slower activation properties. The threshold for ICaL activation is in the voltage range of –35 to –25 mV; half-maximum activation is attained at about –15 mV; activation develops over several ms and is maximum by 0 to 10 mV (Figure 1.4A and B).12 Inactivation and reactivation of ICaL are slow as well (30–300 ms). Steady-state activation and inactivation curves are shown in Figure 1.4C. The overlap of these 2 curves indicates a window current resulting in a small steady-state ICaL (≤1% of maximal) entering the cell.13 The single channel conductance at physiological Ca2+ concentrations is 5 to 7 pS14 and peak ICaL density is 10 to 30 pA/pF.15
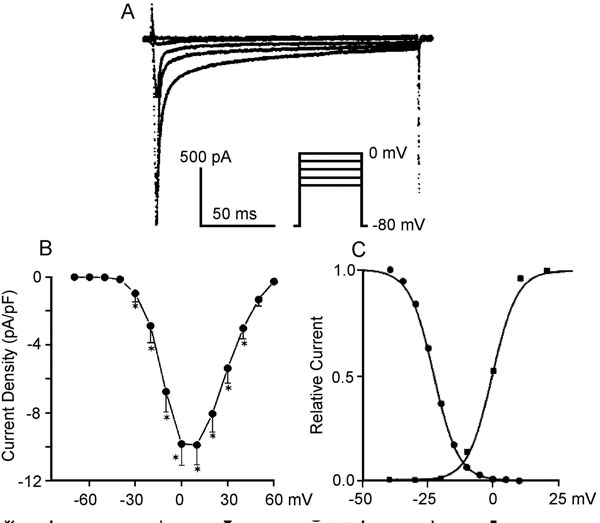
Figure 1.4. A: Time course of ICaL in human right ventricular myocytes at different membrane potentials. B: Current–voltage relations of ICaL expressed in terms of current density from holding potential of –80 mV. Modified from Li et al.53 C: Steady-state activation (squares) and inactivation (circles) curves for ICaL in canine Purkinje cells. Modified from Hirano et al.13
Inactivation of ICaL is not only voltage-dependent but intracellular Ca2+ concentration-dependent.16 When intracellular Ca2+ is buffered at its resting level or Ca2+ ions are replaced by Ba2+, the current through L-type channels decays very slowly. In contrast, if intracellular Ca2+ rises to micromolar levels, ICaL decays substantially. The mechanism of calcium-dependent ICaL inactivation is as follows: when the local Ca2+ concentration at the inner mouth of the channel (see Figure 1.2B) increases, Ca2+ binds to the high-affinity calcium binding sites on the C-terminal, which leads to a conformational change and subsequent closure of the channel.17 Calcium-dependent inactivation of ICaL provides a negative feedback to limit further Ca2+entry and prevent Ca2+ overload of the cell. The quantity and time course of Ca2+ entry through ICaL are important for the action potential and excitation-contraction coupling. Typically, Ca2+ channels are located in membrane sections close to the ryanodine receptors, the sarcoplasmic release channel for Ca2+. Ca2+ diffuses slowly, therefore the concentration seen by the channel may be much higher than the general cytoplasmic Ca2+.18
In addition to the 2 important roles of ICaL described above (determining the plateau of the action potential and coupling excitation and contraction), it is responsible for the upstroke of the action potential in SAN and AVN. These structures have relatively few Na+ channels, and these are inactivated at the relatively positive diastolic potentials. With regard to ICaT, it is prominent in embryonic and neonatal atrial and ventricular cells. ICaT declines with maturation but remains important in Purkinje and SAN cells. The channel has been proposed to play a role in pacemaking.
Potassium channels
The cardiac action potential is controlled by the complex interaction between inward (depolarizing) currents and outward (repolarizing) currents. Potassium channels are key contributors to repolarization. There is a large variety of K+ channels in cardiac cells. The major cardiac potassium channels can be divided into 2 major functional groups: voltage-gated (Ito, IKur, IK (IKr + IKs), and IK1) and ligand-activated (IK,Ach and IK,ATP). In addition, many K+ currents exhibit rectification. The current is ohmic (unrectified) when there is a linear relationship between the membrane potential and current (in other words, membrane resistance is constant over a range of membrane potentials). If a channel’s ability to conduct current varies with the membrane potential, the resultant dependence of membrane resistance on voltage is called rectification. When depolarization facilitates the channels opening outward, rectification occurs. In contrast, the channels exhibit inward rectification if they tend to close with depolarization. Potassium currents in the heart can exhibit both inward and outward rectification as described below.
Voltage-gated potassium channels. The molecular composition of voltage-gated K+ channels is highly homologous with that of Na+ and Ca2+ channels. The difference is that whereas the α subunit of Na+ and Ca2+ channels has 4 domains, each consisting of 6 transmembrane segments, the α subunit of K+ channels has only one domain with 6 segments (see Figure 1.2C, left panel). There is a typical, positively charged S4 (the voltage sensor) and a P region between S5 and S6, conferring K+ selectivity.19 Voltage-gated K+ channels are formed as tetramers. The channels are a major determinant of the voltage time course of the action potential repolarization.
Transient outward current (Ito). Most cardiac cells have a K+ channel, generating a transient outward current, Ito, that initiates repolarization after the INa-induced spike (phase 1 repolarization of the action potential). The major pore-forming channel proteins expressed in the mammalian heart having biophysical properties consistent with Ito are Kv1.4 (KCNA4) and Kv4.2/4.3 (KCND2/3). Kv4.2 and Kv4.3 interact with a small protein MiRP1 (Min-K-related peptide 1) encoded by KCNE2. The Kv4 family of channels has accessory subunits called Kv channel-interacting proteins (KChIPs).
Ito is rapidly activated and is also inactivated during depolarization steps (Figure 1.5A). Because recovery from inactivation is rather slow, Ito amplitude is smaller at fast rates, attenuating the shortening of the action potential at elevated frequencies. The current is differently expressed in the different parts of the heart. Ito density is higher in right ventricular myocardium versus left ventricular myocardium,20 and is higher in subepicardial and midmyocardial cells than in subendocardial myocytes. The differences in expression of Ito across the ventricular wall may result from different expression of the KChIP2 subunit rather than the Kv4.3 α subunit.21 Single channel conductance is in the order of 10 pS.
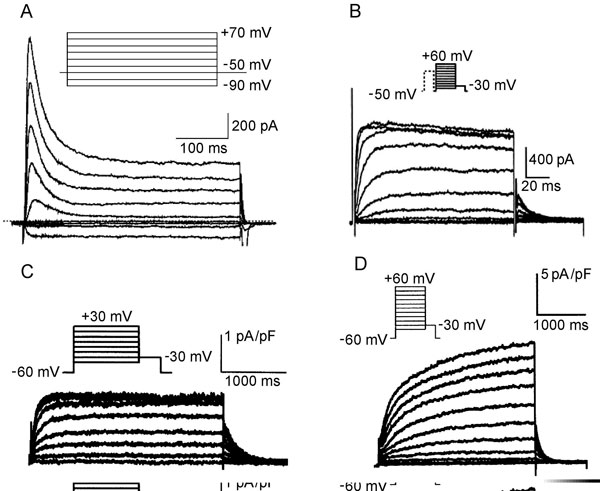
Figure 1.5 Representative K+ channels in cardiac cells. A: Ito in human atrial cells. Modified from Van Wagoner et al.54 B: IKur in canine atrial cells. Modified from Yue et al.24 C and D: IKr and IKs, respectively, in canine atrial myocytes. Modified from Li et al.55
The ultrarapid delayed rectifier current (IKur). IKur is one of the primary K+ currents involved in atrial repolarization. In the human atrium, this current corresponds to the Kv1.5 protein encoded by KCNA5 on 12p13.22 The current is very rapidly activated and shows no or very slow inactivation (see Figure 1.5B). It has been considered a noninactivating component of Ito (see Figure 1.5A). Recovery from inactivation is slow, therefore IKur is markedly reduced at high rates. The current–voltage relationships reveal outward rectification of the current.23 Single channel conductance at normal extracellular potassium concentration is 14 to 20 pS.24
The delayed rectifier K+ current (IK). The cardiac delayed rectifier K+ current initially was identified on the basis of its relatively slow onset in comparison to other K+ currents. IK initiates repolarization and is the primary determinant of late phase 2 and phase 3 repolarization. IK has 2 components; these are rapidly (IKr) and slowly (IKs) activated currents that can be distinguished based on the biophysical and pharmacological properties of the channel and its molecular structure. Which of these 2 currents plays a greater role in terminating the plateau depends on experimental conditions. Under voltage-clamp conditions with long depolarizing steps, the value of IKs may be several folds greater than IKr. However, during an action potential, due to differences in voltage dependence of activation and kinetics, the currents can be of comparable magnitude.
The rapid delayed K+ current (IKr). IKr contributes significantly to the repolarization of the action potential. In human cardiac myocytes, the HERG gene located on chromosome 7q35-36 determines IKr expression. Kinetics and current density result from co assembling of HERG with the β subunit minK-related peptide 1 (MiRP1), a small protein with only one membrane segment coded by KCNE2 on chromosome 21q22.12.25 The channel shows rapid activation upon depolarization (it is half-activated at –30 mV) but also very rapid inactivation (see Figure 1.5C). At depolarization to positive membrane potentials, inactivation proceeds at a faster rate than channel activation.26 As a result, IKr displays marked inward rectification.27 Consequently, the current has a relatively low conductance during action potential plateau, but during repolarization the channels reenter the open state. Because deactivation from the open state is slow, the large current occurs upon repolarization, terminating the action potential plateau. The single channel conductance under physiological conditions is about 2 pS.
The slowly activated delayed K+ current (IKs). Cardiac IKs is generated by co assembly of KvLQT1 (KCNQ1) and minK. The IKs current activates slowly over a broad range of depolarizing potentials (half-maximum activation is about +20 mV) and shows no inactivation (see Figure 1.5D). IKs demonstrates no rectification—the current–voltage relation approaches linearity.28 In contrast to IKr, IKs increases gradually during the plateau phase of the action potential but, similar to IKr, remains activated during the repolarization phase as the result of slow deactivation. At rapid heart rates, the shortened diastolic interval and slow inactivation result in subpopulations of both channels remaining in the activated state, thereby contributing to a faster rate of repolarization. Single channel conductance has been estimated at 3 to 5.4 pS and does not depend on extracelluar K+.
The inward rectifier K+ current (IK1). Kir2.1 protein encoded by the gene KCNJ2 on chromosome 17q23.1-q24.2 underlies cardiac IK1. The α subunit of the channel is distinct from Kv channels and consists of only 2 transmembrane segments with a pore loop sequence in between (this is analogous to the S5, S6, and P loop region of Kv channels) (see Figure 1.2C, right panel). The mechanism for voltage gating is not due to an S4 voltage sensor, since the channels do not have an S4 structure. There are 2 mechanisms for this process, block by intracellular Mg2+ and block by polyamines29 at a divalent binding site on the channel. Normally, these blocking particles are prevented from binding by the electrical field. Depolarization facilitates block and repolarization relieves it. Initially IK1 was considered as a time-independent current. Then, it was found that block and unblock by Mg2+ and polyamines was time-dependent. IK1 is large at negative membrane potentials and small in depolarized state. The current–voltage relation for IK1 has a region of negative slope (Figure 1.6A), and the strong rectification properties of IK1 keep the cell at a stable, negative resting potential. They also prevent these channels from counteracting the membrane depolarization induced by Na+ influx through voltage-gated sodium channels. IK1 also plays a major role in the late phase of repolarization of the action potential. IK1 density is highest in Purkinje fibers and ventricular myocardium, less in atria, and relatively scanty in nodal cells.30 Single channel conductance ranges from 20 to 45 pS.
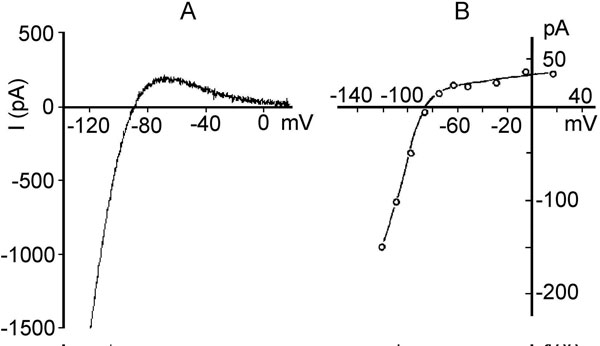
Figure 1.6. Two inward rectifier K+ currents. A:
Stay updated, free articles. Join our Telegram channel

Full access? Get Clinical Tree


