How to Interpret ECGs
 ECG Paper
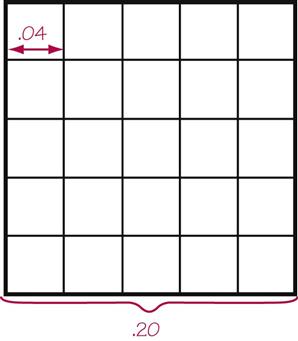
The electrocardiogram (ECG) complexes measure the electrical events; the paper measures the time. The ECG paper rolls out of the machine at a preset speed of 25 mm, or 1 inch, per second. The paper is marked off in a grid, with each line 1 mm apart. Every fifth line is darker and thicker so that very small boxes can be counted accurately.
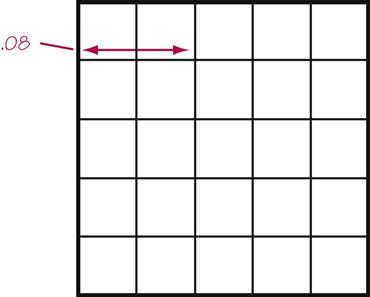
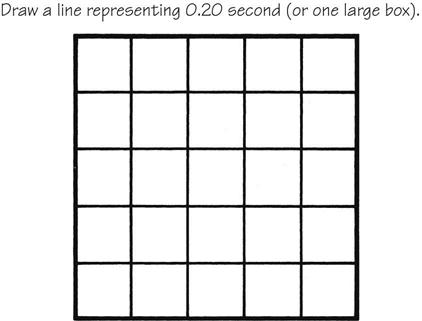
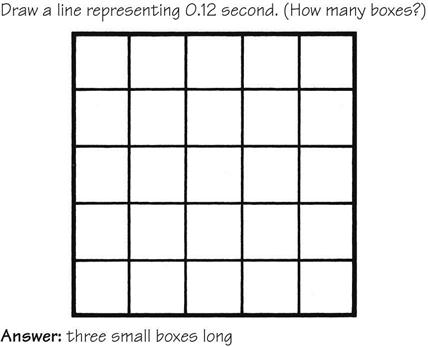
Each small box represents 0.04 second. Each large box is made up of 5 small boxes and represents 0.20 second.
An electrical event that takes 0.08 second would create a line 2 small boxes long.
 Normal ECG
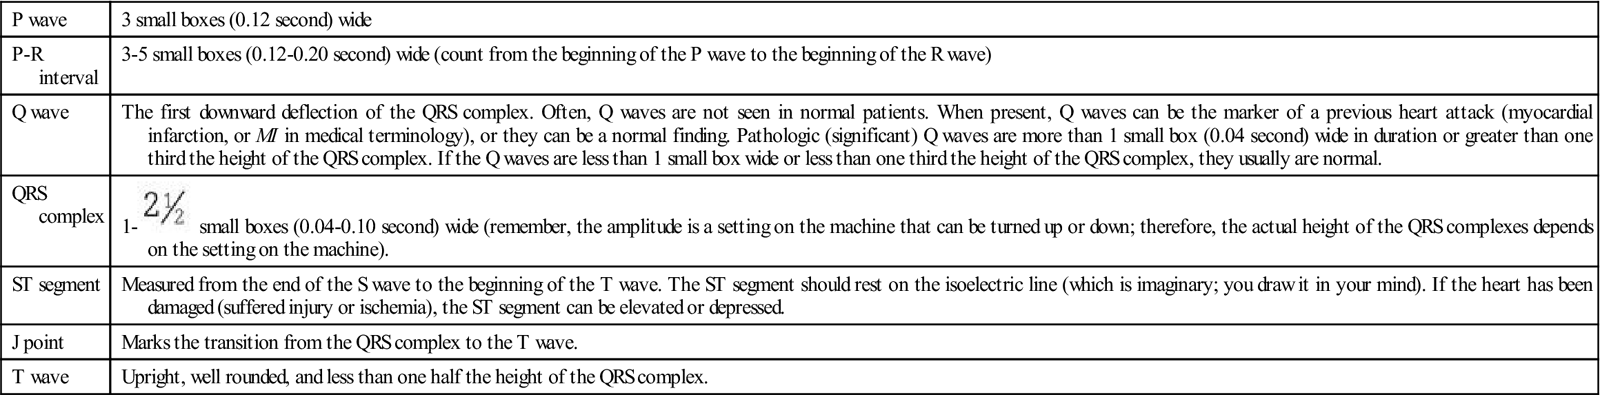
The criteria for a normal ECG are reproduced on the back of Cohn’s Pocket Guide to Adult ECG Interpretation. They are as follows (remember, 1 small box = 0.04 second; 1 large box = 0.20 second):
| P wave | 3 small boxes (0.12 second) wide |
| P-R interval | 3-5 small boxes (0.12-0.20 second) wide (count from the beginning of the P wave to the beginning of the R wave) |
| Q wave | The first downward deflection of the QRS complex. Often, Q waves are not seen in normal patients. When present, Q waves can be the marker of a previous heart attack (myocardial infarction, or MI in medical terminology), or they can be a normal finding. Pathologic (significant) Q waves are more than 1 small box (0.04 second) wide in duration or greater than one third the height of the QRS complex. If the Q waves are less than 1 small box wide or less than one third the height of the QRS complex, they usually are normal. |
| QRS complex | 1- small boxes (0.04-0.10 second) wide (remember, the amplitude is a setting on the machine that can be turned up or down; therefore, the actual height of the QRS complexes depends on the setting on the machine). small boxes (0.04-0.10 second) wide (remember, the amplitude is a setting on the machine that can be turned up or down; therefore, the actual height of the QRS complexes depends on the setting on the machine). |
| ST segment | Measured from the end of the S wave to the beginning of the T wave. The ST segment should rest on the isoelectric line (which is imaginary; you draw it in your mind). If the heart has been damaged (suffered injury or ischemia), the ST segment can be elevated or depressed. |
| J point | Marks the transition from the QRS complex to the T wave. |
| T wave | Upright, well rounded, and less than one half the height of the QRS complex. |
The ECG is a graphic representation of the electrical activity in the heart. By counting the boxes, we can establish the time the complex took to travel. By counting the number of complexes in 1 minute, we can establish a rate.
Here’s how it works.
Pretend your archenemy, Kneehigh Snodgrass, is tracking you and your car on radar to follow your whereabouts. Kneehigh Snodgrass must pay for each minute he is tracking you on radar. On the first day, you drive quickly to work. You create a short, narrow path as he watches you on the radar. The next day you are stuck in traffic. It takes you longer to travel, and you take a detour off the road and back on to go around an accident. That detour would be reflected as a longer route. The longer route would take more time; cost more money in radar charges; and create a wide, bizarre tracing on the radar. And so it is with an electrical impulse that takes a longer or unexpected route: it takes longer, and the complex is recorded as a wide and bizarre tracing.
On an ECG, if the complex is wider than normal, it means that the electrical impulse was slowed somewhere in the heart. If the complex is narrower than normal, it means that the impulses are passing more quickly through the heart. If the complex takes on a strange shape, it means the impulse was rerouted through the heart. The P wave, the P-R interval, (the presence of a Q wave), the QRS complex, and the T wave all demonstrate electrical conduction. Abnormalities in the height or depth of the J point and the ST segment speak more to an acute heart attacks (MI).
 Calculating the Heart Rate
To calculate the heart rate, counting 60 seconds of ECG strip would be unwieldy and cumbersome. Therefore, a number of methods that have been established for counting the rate. Rulers are also available to assist in this calculation.
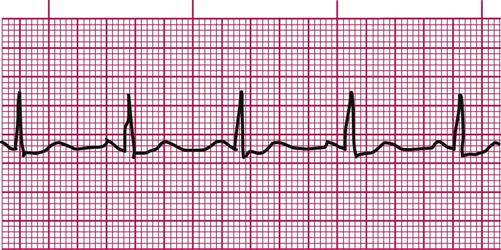
The easiest, most accurate method is called the 6-second strip method. Instead of counting the number of complexes in 60 seconds, we count the number of complexes in 6 seconds and multiply by 10 (or just add a zero).
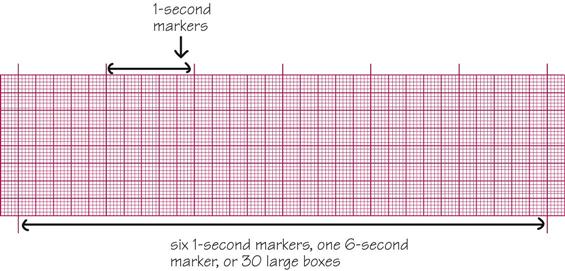
Depending on the design of the ECG strip you are using, 6 seconds of strip is equal to the following:
• Thirty large boxes (6 seconds) or
• Six 1-second markers (6 seconds) or
• Two 3-second markers (6 seconds) or

By far the quickest way to calculate the rate is to use the rate calculator on the pocket guide “ruler” included with this book. To practice with it, use any of the ECG strips in the back of the book* or the following example. Follow these steps:
1 Place the black arrow on top of any complex.
2 Count three (3) complexes away from the arrow.
3 The number the third complex falls on is the rate of the heartbeat.
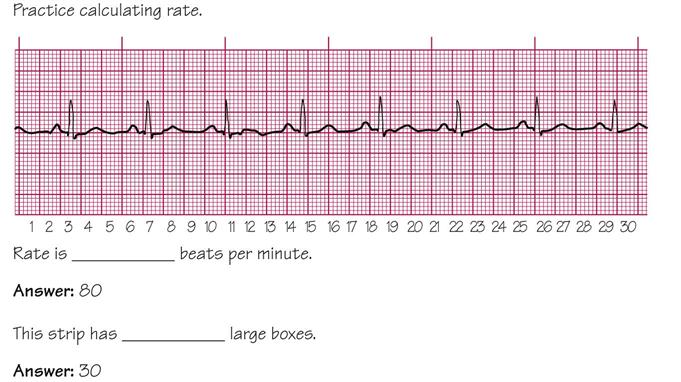
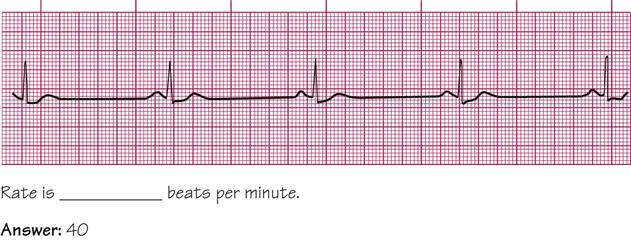
Now, use the following example ECG to calculate the heart rate with (1) the 6-second strip method and (2) the pocket guide device.
Using either the pocket guide device or the 6-second strip method, the rate you should have come up with is 80 beats per minute.
 Excuse me…
Why won’t the pocket guide ruler work on the other ECG illustrations in the main body of the book?
 Answer…
Because the ruler is calibrated to work on the actual ECGs used in the hospital or clinic setting, and those are a standard size. Most of the illustrations in the book have been shrunk down to fit neatly in the text; they are smaller than the ECGs used in real life.
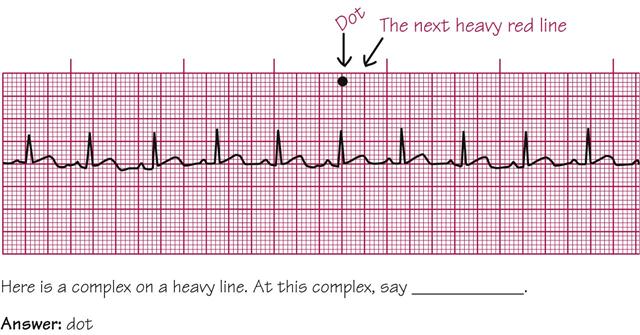
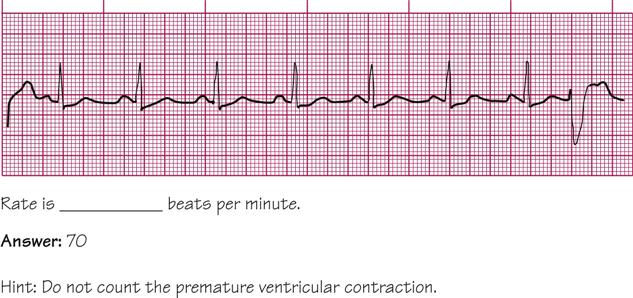
Here is a handy trick for counting fast rhythms. However, it works only for rhythms that are regular and over 50 beats per minute.* You will be able to see if a rhythm is regular by checking the R-R intervals. This rate calculation method involves looking at one R-R interval and determining the rate on that basis.
The way this system works is this: You find a QRS complex where the R wave falls right on a heavy line.
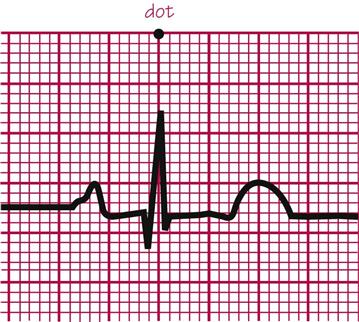
At this complex you say dot.
In skydiving* you say the word dot when your body is in the proper position outside of the plane and you are ready to let go and start your dive. You say this because there is a red dot painted on the outside, underside of the wing. If you can see the red dot, then your head is up and your back is arched. So you see the red dot, say dot, your body is in proper position, and you let go. We will say dot when we find an R wave on a heavy line. That will tell us we are in the right position.