Introduction to 12-Lead Interpretation
 A Gentle Introduction to 12-Lead ECG Interpretation
To be successful at interpreting 12-lead electrocardiograms (ECGs), you need to start with a basic knowledge of rate and rhythm. In an ideal world, you would work with rate and rhythm for a month or two and then return to this book to read this section. If you can do that, please do; otherwise, we’ll just carry on.

In deference to tradition, I am passing down a long-standing algorithm for interpretation:
If you are a prehospital or emergency department provider, proceed through these steps with alacrity (briskly), because getting to the infarction, injury, ischemia part of the interpretation will help you initiate life-saving treatment.
What Is a 12-lead ECG?
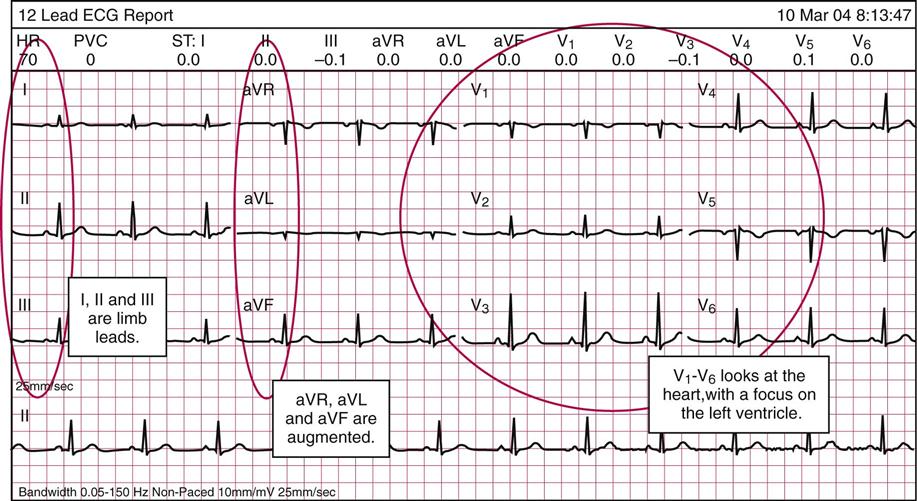
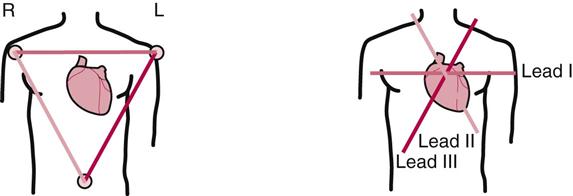
A 12-lead ECG is made up of 10 electrodes (really). Leads V1 through V6, as arranged in the following picture, are placed on the chest and one on each limb, respectively: right arm, left arm, right leg, and left leg. This type of ECG uses six true views of the heart muscle itself, three standard limb leads, and three “augmented” leads, which the machine calculates inside and prints on the paper. The three standard limb leads are I, II and III; the three augmented leads are aVR, aVL, and aVF (note the small “a” that precedes the name, for augmented); and the six precordial leads are V1, V2, V3, V4, V5, and V6. The leads are actually mathematical calculations based on the properties of a triangle.*
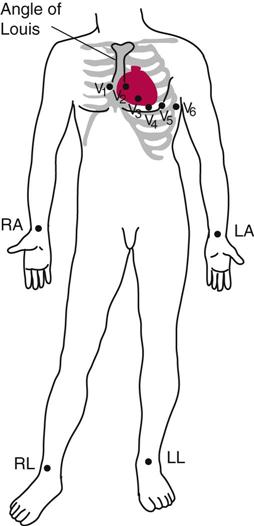
The heart has two types of “vectors”: (1) the limb leads and the augmented leads, which tell us about axis, and (2) the six precordial leads (V1-V6), each of which looks at the heart from a slightly different angle. The limb leads are placed on the limbs, the six precordial leads are placed over and around the heart, and the augmented leads are calculated inside the machine.
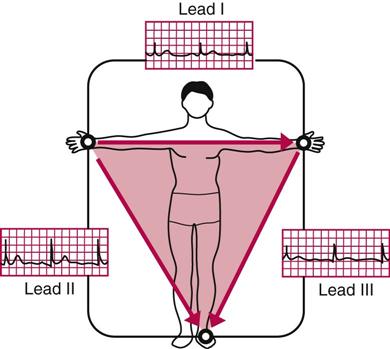
The limb leads and augmented leads are based on mathematical calculations from the leads on the right arm, left arm, and left leg.

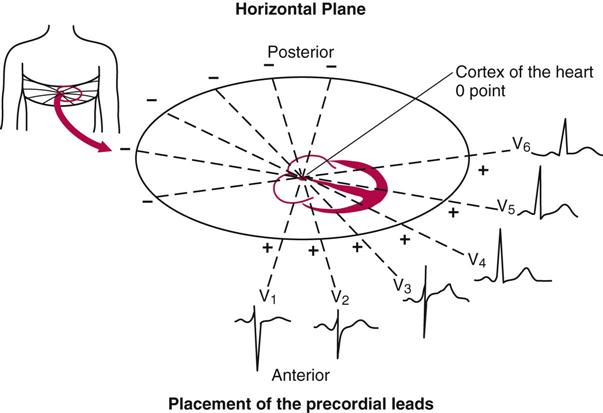
The V leads are placed around the heart and represent the horizontal plane.
What Does the ECG Record?
This description walks you through the 12-lead ECG on the next page. On the left side of the ECG, we have the augmented and limb leads; these are calculated inside the machine and can tell us about the vectors (more or less the angle of the electrical activity). There is a math calculation you can do in order to prove that the activity in a healthy heart has a normal axis. In a sentence: every “pull” is opposed by an equal and opposite “push.” When the tissue or conduction system is damaged, there is unequal “push” and “pull,” and the conduction axis becomes abnormal.
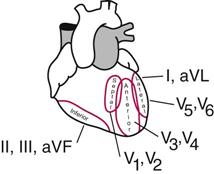
On the right side of the ECG, we have the precordial leads, V1-V6. They surround the heart on the left chest wall (the right side of the ECG reflects the left side of the patient and vice versa). These leads reflect different segments of the left ventricle and the structures associated with the left ventricle. Therefore, when you hear that a person had a lateral wall infarct, it means that there is damage to the side of the left ventricle; an anterior wall MI would be a myocardial infarction, or heart attack, of the front of the left ventricle. We can infer information about the back of the heart by using leads II, III, and aVF.
We are primarily concerned with the left ventricle, because it is the main pumping chamber and the body is most dependent on it. Now, on to interpretation.
Interpretation
We are taking the standard approach to interpretation of the 12-lead ECG:
So let’s start with a normal ECG and continue on with our systematic approach. Rate is first—but you already know how to calculate the rate.
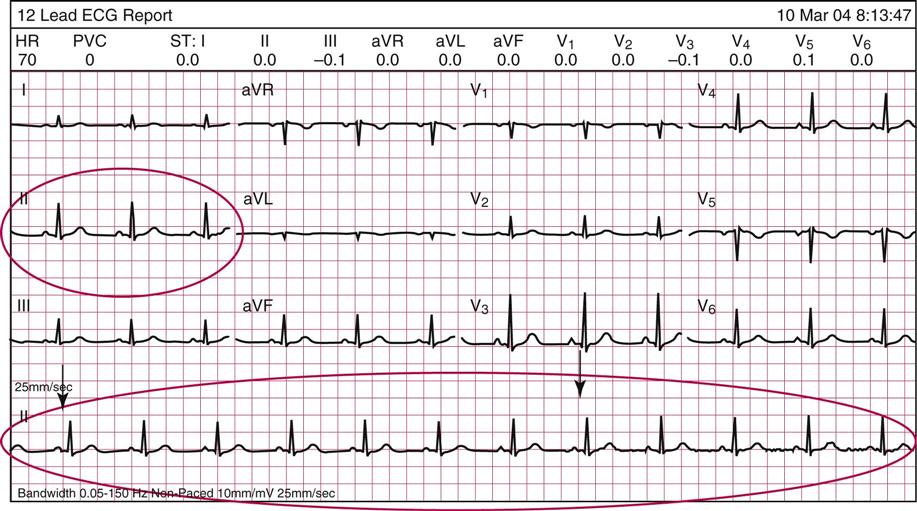
Lead II is our preferred lead for counting rate. In the 12-lead that follows this page, lead II is circled on the upper left and along the bottom. Count 30 large boxes (from black arrow to black arrow) for a 6-second strip.
How many beats per minute for this patient? ___________.
Answer: 70 (that next one is just shy of the cut-off line); the whole strip is 50 large boxes.
Rhythm
Interpret the rhythm strip at the bottom, usually lead II. Is there a P wave followed by a QRS complex and a T wave? Use the pocket guide to interpretation included with this text and follow the usual system. You have already mastered this, from the earlier chapters. You’ll find that this is normal sinus rhythm at a rate of 70 beats per minute. Whew, that’s two items down already.
Axis
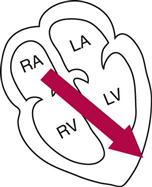
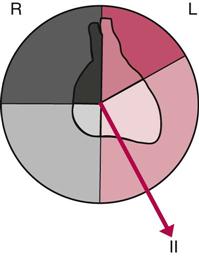
Axis refers to the flow of electrical activity through the heart. Electrical conduction depends on the activity of cells’ repolarization and depolarization. In a normal heartbeat, the electrical impulses and the flow of blood leave the heart via the left ventricle.
This represents a normal axis and normal conduction. If you are monitoring the patient in lead II, you can see that the positive-to-negative depolarization of the heart and the electrical current of the monitor are aligned, resulting in upright complexes on the ECG (and by “aligned” I mean the impulse is intersected at a 90-degree angle).
Damage to the cells of the heart can affect the way electrical activity is conducted. The damaged cells don’t conduct as well as healthy cells, and this can change the axis on which the current travels. By definition, axis is the sum total of all electrical currents generated by the ventricular myocardium during depolarization. In plainer English, if the electrical current is pulled to one side or the other (or to the top), it means three things: (1) it is considered abnormal; (2) it is represented on the ECG as abnormal electrical activity; and (3) it can affect the flow of blood.
Stay updated, free articles. Join our Telegram channel

Full access? Get Clinical Tree


