INTRODUCTION TO VENTILATION/PERFUSION MATCHING
Learning Objectives
The student will be able to explain why the ratio of alveolar ventilation to lung vascular perfusion increases apically in lungs of an upright subject.
The student will be able to distinguish between the anatomical and physiological concepts of dead space and shunt.
The student will be able to explain the circumstances that elicit the acute hypoxic pressor response and its effect on pulmonary arterial pressure.
The student will be able to apply multiple inert gas data to distinguish normal subjects versus diseased patients with increased shunt or dead space.
The student will be able to use relevant equations to estimate alveolar versus dead space ventilations, and calculate alveolar Po2 from patient data.
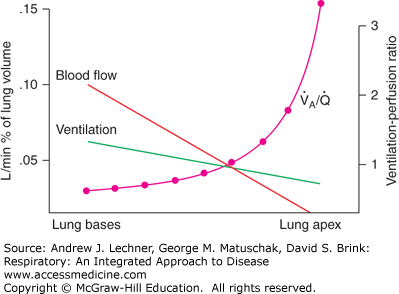
In the normal upright lung, both ventilation and perfusion favor dependent lung regions (Chaps. 6 and 7). These relationships will be explored here to develop a fuller understanding of their normal ranges and perturbations having clinical importance (Fig. 8.1). Since both V̇A and Q̇ change with lung height, their alveolar ventilation perfusion ratio V̇A/Q̇ increases exponentially from lung base to apex. In this situation, V̇A/Q̇ <1 at the level of the diaphragm due to the heavy blood flow through Zone 3 capillaries. With increasing height above the heart of the upright lung, the V̇A/Q̇ ratio rapidly passes through 1.0 toward higher values that could theoretically approach infinity (ie, the denominator = 0) if apical alveolar capillaries are actually in Zone 1 conditions.
Regardless of their cause, inequalities in V̇A/Q̇ have a direct bearing on the efficiency of ventilation and the adequacy of perfusion. In simplified form, the extreme range of possible situations is shown in Fig. 8.2. The structures shown represent individual alveoli and their capillaries, or entire lung lobes, with several basic principles the same. First, inspired gas is well mixed and normally provides a suitable Po2 even when diluted with alveolar air. Second, pulmonary arterial blood is also homogenous as it enters the lungs with respect to its mixed venous O2 content, CV̄o2. Under these conditions, the open airway and patent blood vessel serving the central gas exchange structure in this diagram offer no serious impediments to ventilation or perfusion, and thus its V̇A/Q̇ = 1.
FIGURE 8.2
Mechanisms that alter systemic Pao2 by well-matched or poorly matched ventilation and pulmonary arterial blood. Lung units with high V̇a/Q̇ (right) add relatively little O2 overall to blood because blood flow is low; such regions contribute to physiological dead space. Lung units with low V̇a/Q̇ (left) add little oxygen because they are under ventilated; such regions contribute to physiological shunt. From West, Respiratory Physiology; 2005.
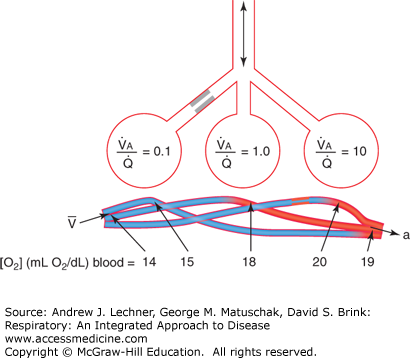
The lung unit to the left in Fig. 8.2 has normal, unimpeded blood perfusion, but its ventilation is low, due perhaps to mucus, edema, or other cause for a narrowed airway. The end result of this unit with low V̇A/Q̇ (1/10) is wasted cardiac output and a decrease in pulmonary venous blood O2 content, CPVo2. Such wasted blood flow is termed physiological shunt, with the end result no different than if this blood had passed through an anatomical shunt between the right ventricle and left atrium. The lung segment to the right in Fig. 8.2 shows adequate (even excessive) ventilation compared to its reduced perfusion. The consequence of a high V̇A/Q̇ (10/1) is enriched O2 content in pulmonary veins (or at least no reduction), although significant ventilation is wasted and contributes to physiological dead space. Such vascular occlusion might occur by an embolism, clot, or other obstructive effect within the blood vessel.
Later sections of this chapter and Chap. 9 present equations to calculate a patient’s physiological dead space and physiological shunt. It is important to emphasize that such physiological estimates are made on living subjects and include any anatomical defects that are only quantifiable by autopsy. Thus, a calculated physiological dead space includes the anatomical dead space of conducting zone airways (Chap. 4) plus the volume of all alveoli whose ventilation vastly exceeds their blood flow, that is V̇A/Q̇ >100 (Table 8.1). Likewise, a calculated physiological shunt as detailed in Chap. 9 includes actual extra-pulmonary anatomical defects like PDA or PFO (Chap. 7) that allow systemic blood to bypass the pulmonary circulation plus any pulmonary arterial blood flowing through alveoli with inadequate ventilation, that is, V̇A/Q̇ <0.01 (Table 8.1). By these definitions, healthy subjects are those whose physiological dead space and shunt do not exceed their anatomical dead space and shunt.
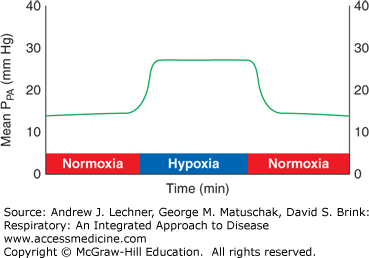
Beyond such large-scale adjustments between ventilation and perfusion, pulmonary arterioles constrict directly in response to reduced PAo2. This acute hypoxic pressor response (AHPR) is a reflex unique to the pulmonary circulation, evident even in isolated lungs (Fig. 8.3). AHPR adaptively diverts blood from hypoxic alveoli to improve local V̇A/Q̇ matching and minimize arterial hypoxemia for the entire lung.
FIGURE 8.3
Demonstration of the pulmonary acute hypoxic pressor response, AHPR. Isolated lungs are first ventilated with normoxic gas (21% O2/5% CO2/74% N2) while perfused with blood. When ventilation begins with hypoxic gas (10% O2/5% CO2/85% N2), mean pulmonary artery pressure PPA promptly increases, but returns to baseline when normoxic ventilation resumes.
The degree of flow diversion attributable to the AHPR diminishes when the entire lung is experiencing hypoxia. Hypoxic foci that are small or limited to particular lobes, as during pneumonia, receive little perfusion because the AHPR shunts their blood supply to less hypoxic alveoli. In such cases, PVR may be normal for the lungs as a whole, PPA need not increase to maintain Q̇, and so the risk of edema is low (Chap. 7). However, when alveolar hypoxia involves the entire lung, as at altitude, the AHPR affects all alveolar units and PVR increases substantially. In that situation, right heart output and lung blood flow can only be maintained by large increases in PPA. If persistent, the resulting pulmonary hypertension can lead to vascular remodeling, enlargement of the right ventricle, and cor pulmonale, topics that will be discussed in Chaps. 13 and 26.
QUANTIFYING ABNORMALITIES IN VENTILATION/PERFUSION MATCHING
Advances in gas analyses allowed development of the multiple inert gas technique to estimate V̇A/Q̇ distributions. In this research test, six tracer gases dissolved in saline (Table 8.2) are infused into the right ventricle at known rates. They have a range of molecular weights and thus differing diffusion rates as gases, and variable solubilities in blood and tissue as described by Henry’s law. These properties affect how quickly each gas leaves the blood and enters alveolar air to be collected as expired air, where concentrations are measured by mass spectrometry. Less soluble gases leave blood quickly, enter alveolar airspaces and are not reabsorbed. Once there, their rates of free diffusion determine the speed at which they are expired. These clearance data are compiled to estimate the proportion of ventilation and perfusion going to alveolar units having various V̇A/Q̇ ratios, plotted on a log scale from 0.01 to 100 (Fig. 8.4).
Stay updated, free articles. Join our Telegram channel

Full access? Get Clinical Tree


