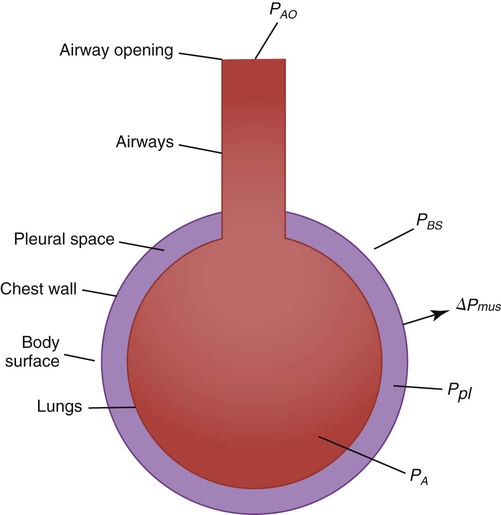
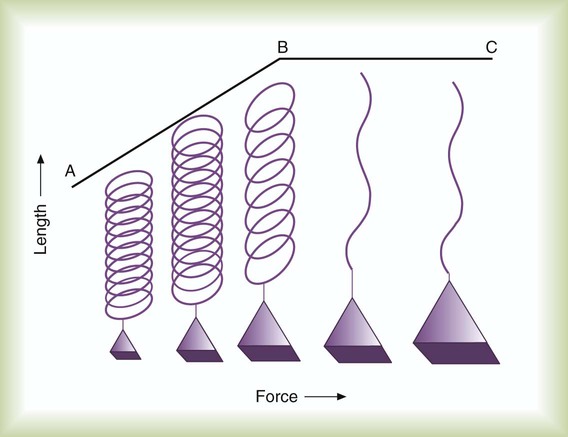
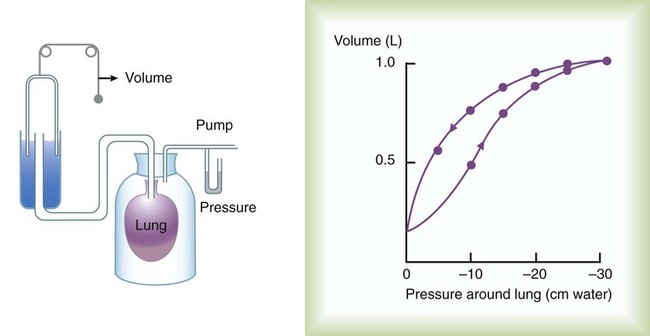
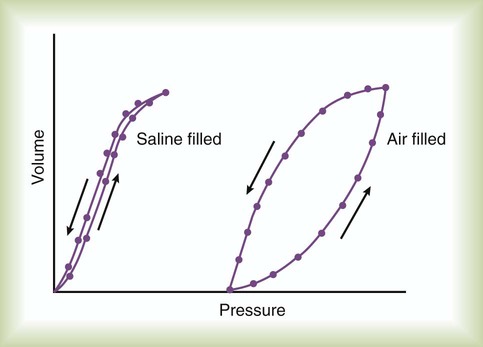
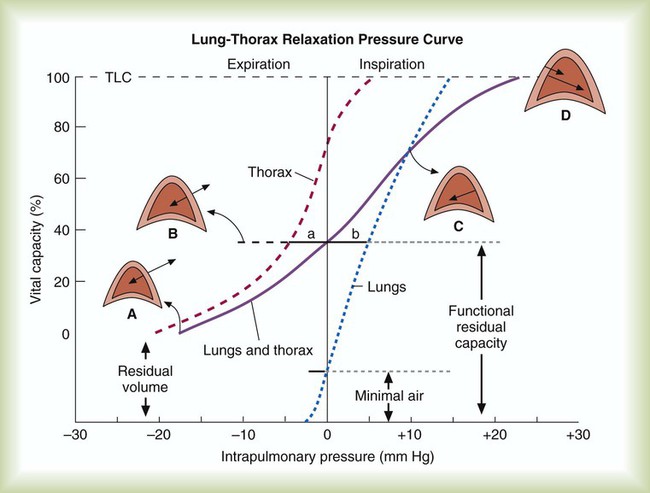
After reading this chapter you will be able to: Normal ventilation is a cyclic activity that has two phases: inspiration and expiration. During each cycle, a volume of gas moves in and out of the respiratory tract. This volume, measured during either inspiration or expiration, is called the tidal volume (VT). The normal VT refreshes the gas present in the lung removing CO2 and supplying O2 to meet metabolic needs. The VT must be able to meet changing metabolic demands, such as during exercise or sleep. The vital capacity and its subdivisions provide the necessary reserves for increasing ventilation (see Chapter 19). Pressure = Force generated by the respiratory muscles or a mechanical ventilator, or both, during inspiration Volume = Volume change (e.g., VT) Elastance = Distensibility of the lungs and thorax (Δpressure/Δvolume); elastance is the reciprocal of compliance (Δvolume/Δpressure) Resistance = Airflow and tissue resistance (Δpressure/Δflow) The equation of motion is a mathematical model describing the behavior of a graphic model of the lungs. The graphic model is shown in Figure 10-1.1 The model lumps all the resistive properties of the many airways into a single flow-conducting tube and lumps all the elastic properties of the alveoli and airways into a single elastic compartment. Surrounding the “lungs” is another elastic compartment representing the chest wall. This graphic representation of the respiratory system allows us to define points in space where pressures may be measured (or inferred) as defined in Table 10-1. Mathematical models relating pressure, volume, and flow corresponding to this graphic model are constructed using pressure differences between the points. The various components of the graphic model are defined as everything that exists between these points in space. The respiratory system is everything that exists between the pressure measured at the airway opening (PAO) and the pressure measured at the body surface (PBS). The associated pressure difference is transrespiratory pressure (PTR): TABLE 10-1 Measurable Pressures Used in Describing Respiratory System Mechanics Sometimes it is useful to define transthoracic pressure difference (PTT) as: Table 10-2 summarizes these equations. TABLE 10-2 Pressure Differences Used in Describing Respiratory System Mechanics Pleural pressure continues to decrease until the end of inspiration. Alveolar filling slows when alveolar pressure approaches equilibrium with the atmosphere, and inspiratory flow decreases to zero (Figure 10-2). At this point, called end-inspiration, alveolar pressure has returned to zero, and the intrapleural pressure—and hence transpulmonary pressure gradient—reaches the maximal value (for a normal breath) of approximately 10 cm H2O. Elastin and collagen fibers are found in the lung parenchyma. These tissues give the lung the property of elasticity. Elasticity is the physical tendency of an object to return to an initial state after deformation. When stretched, an elastic body tends to return to its original shape. The tension developed when an elastic structure is stretched is proportional to the degree of deformation produced (Hooke’s law). An example is a simple spring (Figure 10-3). When tension on a spring is increased, the spring lengthens. However, the ability of the spring to stretch is limited. When the point of maximal stretch is reached, further tension produces little or no increase in length. Additional tension may break the spring. In the respiratory system, inflation stretches tissue. The elastic properties of the lungs and chest wall oppose inflation. To increase lung volume, pressure must be applied. This property may be shown by subjecting an excised lung to changes in transpulmonary pressure and measuring the associated changes in volume (Figure 10-4). To simulate the pressures during breathing, the lung is placed in an airtight jar. The force to inflate the lung is provided by a pump that varies the pressure around the lung inside the jar, simulating Ppl. This action mimics the pleural pressure changes associated with thoracic expansion and contraction. The changes in transpulmonary pressure are made in discrete steps, allowing the lungs to come to rest in between so that all of the applied pressure opposes elastic forces and none of it opposes resistive forces (i.e., flow is zero when the measurements are made). The amount of stretch (inflation) is measured as volume by a spirometer. Changes in volume resulting from changes in transpulmonary pressure are plotted on a graph. During inspiration in this model, increasingly greater negative pleural pressures are required to stretch the lung to a larger volume. As the lung is stretched to its maximum (total lung capacity [TLC]), the inflation “curve” becomes flat. This flattening indicates increasing opposition to expansion (i.e., for the same change in transpulmonary pressure, there is less change in volume).2 As with a spring when tension is removed, deflation occurs passively as pressure in the jar is allowed to return toward atmospheric. Deflation of the lung does not follow the inflation curve exactly. During deflation, lung volume at any given pressure is slightly greater than it is during inflation. This difference between the inflation and deflation curves is called hysteresis.2 Hysteresis indicates that factors other than simple elastic tissue forces are present. The major factor, particularly in sick lungs, is the opening of collapsed alveoli during inspiration that tend to stay open during expiration until very low lung volumes are reached. Expressed in terms of compliance: Part of the hysteresis exhibited by the lung is a result of surface tension forces in the alveoli. If a lung is filled with fluid such as saline, the pressure-volume curves look much different than the pressure-volume curves of an air-filled lung (Figure 10-5). Less pressure is needed to inflate a fluid-filled lung to a given volume. This phenomenon indicates that a gas-fluid interface in the air-filled lung changes its inflation-deflation characteristics. The recoil of the lung is a combination of tissue elasticity and these surface tension forces in the alveoli. During inflation, additional pressure is needed to overcome surface tension forces. During deflation, surface tension forces are reduced, resulting in altered pressure-volume characteristics (i.e., the leftward shift seen in Figure 10-4). In the intact lung (i.e., within the chest), the volume history also affects the degree of hysteresis that occurs. Factors such as the initial volume, the tidal excursion, and whether the lungs have been previously inflated or deflated help determine the volume history and the shape of the pressure-volume curves of the lung. A phospholipid called pulmonary surfactant reduces surface tension in the lung. Alveolar type II cells probably produce pulmonary surfactant (see Chapter 8). In contrast to typical surface-active agents, pulmonary surfactant changes surface tension according to its area.3 The ability of pulmonary surfactant to reduce surface tension decreases as surface area (i.e., lung volume) increases. Conversely, when surface area decreases, the ability of pulmonary surfactant to reduce surface tension increases. This property of changing surface tension to match lung volume helps stabilize the alveoli. Any disorder that alters or destroys pulmonary surfactant can cause significant changes in the work of distending the lung. A graph of change in lung volume versus change in transpulmonary pressure (Figure 10-6, A) is the compliance curve of the lungs. Figure 10-6, B compares a normal lung compliance curve with curves that might be observed in patients who have emphysema (obstructive lung disease) or pulmonary fibrosis (restrictive lung disease). The curve from a patient with emphysema is steeper and displaced to the left. The shape and position of this curve represent large changes in volume for small pressure changes (increased compliance). Increased compliance results primarily from loss of elastic fibers, which occurs in emphysema. The lungs become more distensible so that the normal transpulmonary pressure results in a larger lung volume. The term hyperinflation is used to describe an abnormally increased lung volume. A distinctly opposite pattern is seen in pulmonary fibrosis. Interstitial fibrosis is characterized by an increase in connective tissue. The compliance curve of a patient with pulmonary fibrosis is flatter than the normal curve, shifted down and to the right. As a result, there is a smaller volume change for any given pressure change (decreased compliance). Consequently, the lungs become stiffer, usually with a reduced volume. Inflation and deflation of the lung occur with changes in the dimensions of the chest wall (see Chapter 8). The relationship between the lungs and the chest wall can be illustrated by plotting their relaxation pressure curves separately and combined (Figure 10-7). In the intact thorax, the lungs and chest wall recoil against each other. The point at which these opposing forces balance determines the resting volume of the lungs, or functional residual capacity. This is also the point at which alveolar pressure equals atmospheric pressure. The normal FRC is approximately 40% of the TLC. If the normal lung–chest wall relationship is disrupted, the lung tends to collapse to a volume less than the FRC, and the thorax expands to a volume larger than the FRC. Inhalation occurs when the balance between the lungs and chest wall shifts. Energy from the respiratory muscles (primarily the diaphragm) overcomes the contractile force of the lungs. At the beginning of the breath, the tendency of the chest wall to expand facilitates lung expansion. When lung volume nears 70% of the vital capacity, the chest wall reaches its natural resting level. To inspire to a lung volume greater than about 70% of TLC, the inspiratory muscles must overcome the recoil of both the lungs and the chest wall (see Figure 10-7). For exhalation, potential energy “stored” in the stretched lung (and chest wall at high volumes) during the preceding inspiration causes passive deflation. To exhale below the resting level (FRC), muscular effort is required to overcome the tendency of the chest wall to expand. The expiratory muscles (see Chapter 8) provide this energy. Raw in nonventilated patients is usually measured in a pulmonary function laboratory (see Chapter 19). Flow (
Ventilation
 Describe the physiologic functions provided by ventilation.
 Describe the pressure gradients responsible for gas flow, diffusion, and lung inflation.
 Identify the forces that oppose gas movement into and out of the lungs.
 Describe how surface tension contributes to lung recoil.
 Describe how lung, chest wall, and total compliance are related.
 State the factors that affect resistance to breathing.
 Describe how various lung diseases affect the work of breathing.
 State why ventilation is not evenly distributed throughout the lung.
 Describe how the time constants affect alveolar filling and emptying.
 Identify the factors that affect alveolar ventilation.
 State how to calculate alveolar ventilation, dead space, and the VD/VT ratio.
Mechanics of Ventilation
Pressure Differences During Breathing
Name
Symbol
Definition
Pressure at the airway opening
PAO
Pressure measured at the opening of the respiratory system airway (e.g., mouth and nose, tracheostomy opening, and distal end of endotracheal tube)
Pleural pressure
Ppl
Pressure measured in the pleural space, changes in which are often estimated by measuring pressure changes in the esophagus
Alveolar pressure
PA
Pressure in the alveolar (gas space) region of the lungs
Body surface pressure
PBS
Pressure measured at the body surface
Definition
Name
Symbol
PAO − PBS
Transrespiratory pressure difference
ΔPTR
PAO − PA
Transairway pressure difference
ΔPTAW
PAO − Ppl
Transpulmonary pressure difference
ΔPTP
PA − Ppl
Transalveolar pressure difference
ΔPTA
PA − PBS
Transthoracic pressure difference
ΔPTT
Ppl − PBS
Trans–chest wall pressure difference
ΔPTCW
Global muscle pressure difference
ΔPmus

Forces Opposing Inflation of the Lung
Elastic Opposition to Ventilation

Surface Tension Forces
Lung Compliance
Chest Wall Compliance
Airway Resistance
 ) is measured with a pneumotachometer. Alveolar pressures are determined in a body plethysmograph, an airtight box in which the patient sits. By momentarily occluding the patient’s airway and measuring the pressure at the mouth, alveolar pressure can be estimated (i.e., mouth pressure equals alveolar pressure under conditions of no flow). By relating flow and alveolar pressure to changes in plethysmograph pressure, airway resistance can be calculated.
 Problem
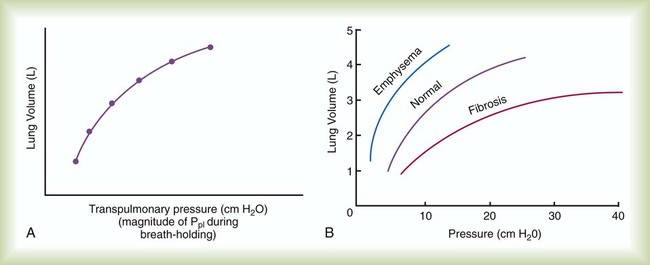
 Rule of Thumb
 is flow, PAO is pressure at the airway opening, and PA is alveolar pressure.
 Problem


