Chapter 12 ![]() Vascular Laboratory Testing
Vascular Laboratory Testing
Vascular laboratory technology offers many cost-effective applications in the practice of vascular medicine.1 Vascular testing includes both physiological testing and duplex ultrasonography. Physiological testing includes segmental pressure measurements, pulse volume recordings, continuous wave Doppler, and plethysmography. These tests employ sphygmomanometric cuffs, Doppler instruments, and plethysmographic recording devices. Duplex ultrasonography combines gray-scale and Doppler imaging with spectral and color Doppler and is used for the majority of vascular laboratory tests. An ultrasound machine should be equipped with vascular software and two transducers/probes, 5- to 12-MHz transducers for the neck and extremities, and 2.25- to 3.5-MHz transducers for the abdomen.
Limb Pressure Measurement and Pulse Volume Recordings
Segmental Doppler Pressure Interpretation
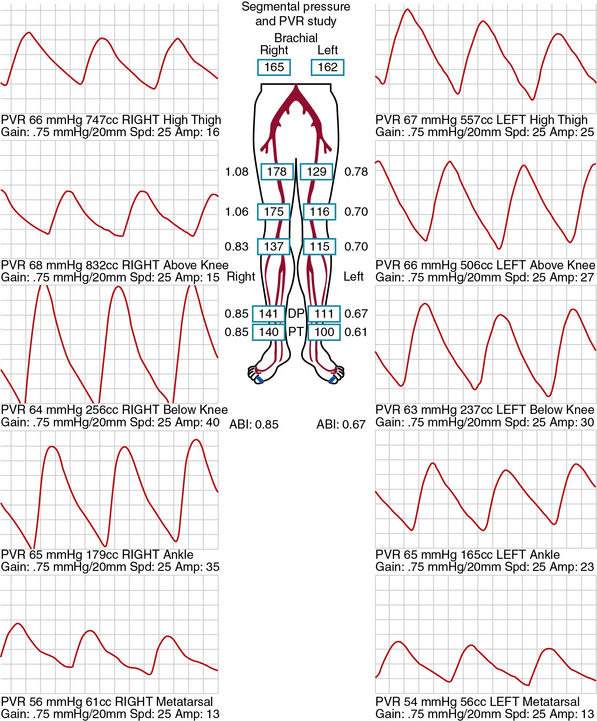
Segmental limb pressures are compared with the highest arm pressure. Ankle pressures are used to calculate the ankle-brachial indices (ABI) for each extremity. This is accomplished by dividing each of the ankle pressures by the higher of the brachial artery pressures.2 A normal ABI is between 1.0 and 1.4, whereas an ABI above 0.9 to 1.0 is borderline abnormal.3 Studies that evaluated the ABI in healthy subjects and patients with PAD confirmed by arteriography found that an ABI of 0.9 or lower was diagnostic of PAD with 79% to 95% specificity and 96% to 100% sensitivity.4 Pressures are compared between levels. A 20-mmHg or greater reduction in pressures from one level to the next is considered significant and indicates stenosis between those two levels. In healthy subjects, the high thigh pressure determined by cuff typically exceeds the brachial artery pressure by approximately 30 mmHg. A thigh/brachial index above 1 is interpreted as normal, and an index of 1 or less indicates stenosis proximal to the thigh (Fig. 12-1). When high thigh pressures are low compared with arm pressure, the site of obstruction could be in the aorta or ipsilateral iliac artery, common femoral artery (CFA), or proximal superficial femoral artery (SFA) (see Fig. 12-1). If only one high thigh pressure is less than the brachial pressure, an ipsilateral iliofemoral artery stenosis is inferred.
Pulse Volume Recording Interpretation
The same cuffs used to measure segmental pressures may be attached to a plethysmographic instrument and used to record the change in volume of a limb segment with each pulse, designated the pulse volume. Pulse volume waveform evaluation allows assessment of arterial flow in regions of calcified vessels because the test does not rely on cuff occlusion of the calcified artery.5 Each cuff is inflated in sequence to a predetermined reference pressure up to 65 mmHg. The change in volume in the limb segment causes a corresponding change in pressure in the cuff throughout the cardiac cycle. Interpretation of the pulse volume recording (PVR) requires calibration of the amount of air in the cuff.
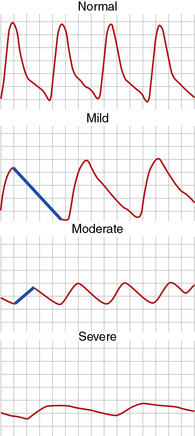
A pulse volume waveform is recorded for each limb segment. Pulse volume recording analysis is based on evaluation of waveform shape, signal, and amplitude (Fig. 12-2). The configuration of the normal pulse volume waveform resembles the arterial pressure waveform, and is composed of a sharp systolic upstroke followed by a downstroke that contains a prominent dicrotic notch. A hemodynamically significant stenosis manifests as a change in the PVR contour toward a tardus parvus waveform. Both the slope and amplitude decrease when there is more severe disease. Severity of PAD can be defined by the slope of the upstroke and amplitude of the pulse volume (see Fig. 12-2).
Pulse waveforms can also be obtained using photoplethysmography, recording reflected infrared light. In photoplethysmography, the signal is proportional to the quantity of red blood cells in the cutaneous circulation; it does not measure volume changes. Waveform shape is assessed in a similar fashion in pulse volume and photoplethysmography recordings. Low photoplethysmographic waveforms in the toes identify increased risk of amputation, in addition to the toe pressure.5
Exercise Testing for Peripheral Artery Disease
Exercise testing is an adjunctive physiological test to evaluate PAD. It is useful to assess functional capacity and determine the distance patients with claudication are able to walk. Moreover, it can be used to clarify whether leg symptoms are related to PAD. This is relevant in patients with symptoms that are atypical for claudication and in those who have a history of intermittent claudication, yet normal ABIs at rest.6 Relative contraindications to treadmill exercise testing for PAD include rest pain in the leg, shortness of breath with minimal exertion, or unstable angina. The test cannot be performed if the patient cannot walk on a treadmill.
Patients are instructed to fast for 12 hours prior to walking on the treadmill. The constant-load treadmill test is performed at a speed of 2 mph and an incline of 12%. Graded exercise protocols increase the grade and/or speed in 2- to 3-minute stages. The Gardner protocol is the most commonly used graded protocol to evaluate walking exercise capacity.7 It begins at a speed of 2 mph and an incline of 0%, and the grade progressively increases by 2% every 2 minutes, allowing for a wider range of responses to be measured. It is often used to determine clinical trial end points such as change in walking time in response to therapy. Other graded exercise protocols, such as the Bruce protocol, are not commonly used because the rapid rate of speed and incline limits assessment of exercise capacity in claudicants.
Transcutaneous Oximetry
By exploiting variations in color absorbance of oxygenated and deoxygenated hemoglobin (Hb), transcutaneous oximetry can determine the state of blood oxygenation. Oximeters use two light frequencies, red at 600 to 750 nm and infrared at 800 to 1050 nm, to differentiate oxygenated and deoxygenated Hb. Deoxygenated blood absorbs more red light, whereas oxygenated blood absorbs more infrared light. Oximeters typically employ both an emitter and receiver. Red and infrared light is emitted and passes through a relatively translucent structure such as the finger or earlobe. A photodetector determines the ratio of red and infrared light received to derive blood oxygenation. When measured continuously, oxygenation peaks with each heartbeat as fresh oxygenated blood arrives in the zone of measurement. Normal values for oxygen tension are from 50 to 75 mmHg. One probe is placed on the chest as a control to ensure that oxygen tension is from 50 to 75 mmHg. A second probe is placed on the limb in the area of interest. Measurements are obtained from the probe, which is sequentially positioned from proximal to distal segments of the limb. Normal limb TcO2 should approximate that of the chest. Transcutaneous oximetry is most often used to determine the level of amputation. A value above 20 mmHg can predict healing at the site with 80% accuracy.7 This measurement is not affected by arterial calcification.
Physical Principles of Ultrasonography
Artifact
Although a highly reliable imaging modality, ultrasound does suffer from occasional image artifact.8 Dense objects like vessel-wall calcium deposits permit few sound waves to penetrate, resulting in acoustic shadowing and diminishing imaging of deeper tissues. Tissue imaging enhancement may be noted on the far side of echo-free or liquid-filled zones. Tissue interfaces may generate multiple sound wave reflections, causing “additions” to the tissue termed reverberation artifact. Refraction of the sound pulse may cause improper placement of a structure of an image and shadowing at the edge of a large structure. Highly reflective surfaces may create mirror images because the reflecting tissue alters the timing of the returning sound wave. The mirror image should be equidistant from the reflecting surface or tissue.
Spectral Doppler Waveform Analysis
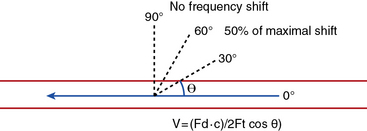
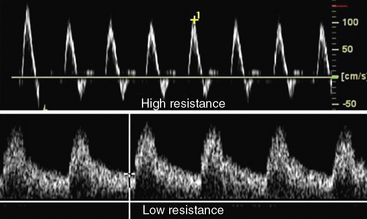
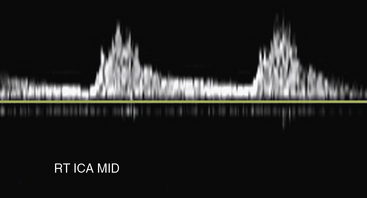
Velocity recordings are obtained with an angle of 60 degrees between the Doppler insonation beam and the flow. In ultrasound practice, the optimal angle of measurement between the beam and blood flow is 60 degrees. Although maximal shift is detected at 0 degrees, this angle cannot be reliably obtained in vascular imaging because the vessels are parallel to the surface of the body. Insonation angles below and above 60 degrees influence the measurement such that small reductions in the insonation angle may alter velocity by 10%, whereas small increases in insonation angle may change flow velocity by 25% (Fig. 12-3). Thus, the sample-volume cursor is placed parallel to the inner wall, and a Doppler9,10 angle from 30 to 60 degrees between the wall and the insonation beam (or flow jet) is used. A normal peripheral artery Doppler waveform consists of a narrow, sharply defined tracing. This indicates that all blood cells are moving at an equivalent speed at any time in the cardiac cycle.11 Waveforms are also characterized as high resistance due to limited flow during diastole (e.g., normal peripheral arterial Doppler velocity waveform), or low resistance with continuous flow during diastole, as when downstream resistance arterioles are widely dilated or there is contiguity with low-resistance circuits (e.g., normal internal carotid artery [ICA] velocity waveform) (Fig. 12-4). The normal high resistance waveform is typically triphasic. The first component is caused by initial high-velocity forward flow during ventricular systole. A range of normal peak systolic velocity (PSV) measurements have been defined12 for each arterial segment, described later in this chapter.
The second phase of the waveform consists of early diastolic flow reversal as left ventricular (LV) pressure falls below aortic pressure prior to aortic valve closure.13 The final or third component is a small amount of forward flow when there is elastic recoil of vessel walls. Flow is typically not uniform or laminar at bifurcations and sites of stenosis; at these sites flow becomes turbulent. For these locations, the spectral Doppler waveform reflects the fact that blood cells move with varying velocities. Instead of a narrow well-defined tracing (see Fig. 12-4), spectral broadening becomes evident (Fig. 12-5), with partial or complete filling-in of the area under the spectral waveform. This third, or late, diastolic component is usually absent in atherosclerotic vessels that have lost compliance or elasticity.
Color Doppler
Color Doppler is the phase or frequency shift information contained in the returning echoes and processed in real time to form a velocity map over the entire imaging field.14 Doppler frequency-shift data are available for every point imaged. This information is then superimposed on the gray-scale image to provide a composite real-time display of both anatomy and flow. When motion is detected, it is assigned a color, typically red or blue, determined by whether the frequency shift is toward or away from the probe. Color assignment is arbitrary and can be altered by the user, but most choose to assign the color red to arteries and blue to veins. With increasing Doppler frequency shifts, the hue and intensity of the color display change, with progressive desaturation of the color and a shift toward white at the highest detectable velocities.
The pulse repetition frequency (velocity) scale determines the degree of color saturation and filling of the vessel lumen. The pulse repetition frequency (radio frequency pulses per second from the probe) is adjusted so that in a normal vessel, laminar flow appears as a homogeneous color. The color appearance changes throughout the cardiac cycle. Increasing flow velocity and turbulence in the region of a stenosis results in production of a high-velocity jet and an abrupt change in color-flow pattern (Fig. 12-6). Color aliasing occurs at the site of stenosis when flow velocity exceeds the Nyquist limit (i.e., when Doppler frequency shift exceeds half the pulse repetition frequency). Aliasing causes the color display to appear as if there is an abrupt reversal in direction of flow (wraparound). This suggests a high-velocity flow jet, requiring confirmation by pulsed-wave Doppler analysis. Color persistence is a continuous flow signal that is the color of the forward direction only, in contrast to the alternating color in normal arteries. There is loss of early diastolic flow reversal. Color persistence corresponds to the monophasic spectral Doppler waveform and is indicative of severe stenosis. Post-stenotic regions display mosaic patterns indicating turbulent flow (see Fig. 12-6). A color bruit in the surrounding soft tissue also indicates flow disturbance. This color artifact is associated with turbulence and occurs with flow disturbances associated with high-velocity jets. The color bruit is particularly useful in locating postcatheterization arteriovenous fistulae (AVF).
Assessment of Arterial Stenosis
Characteristic duplex ultrasound features of a stenosis include elevated systolic velocity, elevated end-diastolic velocity (EDV), color aliasing, color bruit, spectral broadening of the Doppler waveform, post-stenotic flow, and post-stenotic turbulence. An auditory “thump” occurs in the presence of total arterial occlusion. Doppler velocity measurements are the main tools used to evaluate stenosis severity. When flow rate is constant, a decrease in vessel cross-sectional area is balanced by an increase in velocity.13 As blood flow turbulence increases, spectral broadening of the Doppler waveform becomes a clear indicator of turbulent flow seen in the post-stenotic region. The post-stenotic waveform is dampened with a delayed upstroke (see Fig. 12-3). If no post-stenotic turbulence can be identified, inappropriate angle alignment or a tortuous vessel should be suspected.
Power (or amplitude) Doppler is a complementary imaging technique that displays the total strength or amplitude of the returning Doppler signal.15 In comparison with conventional color-flow imaging, color-flow sensitivity is increased by a factor of 3 to 5 times with power Doppler. This enhanced dynamic range can depict very slow flow in the area of a subtotal occlusion that may not be detected by conventional color-flow Doppler. Contrast agents can also help differentiate between occlusion and high-grade stenosis in carotid and renal arteries, especially in cases where multiple renal arteries are present.16
Carotid Duplex Ultrasound
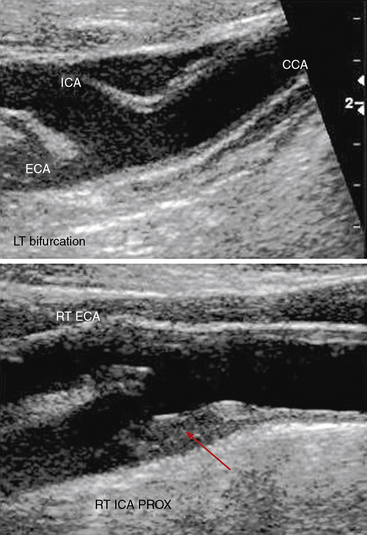
The standard carotid duplex examination includes assessment of the carotid arteries as well as the vertebral, subclavian, and brachiocephalic arteries. Indications for this test include a bruit, transient ischemic attack (TIA), amaurosis fugax, stroke, and surveillance after revascularization.17 The examination begins with a gray-scale survey of the extracranial carotid arteries in transverse and longitudinal views. The operator images the region from the clavicle to the angle of the jaw, in both anterolateral and posterolateral views.18 The common carotid artery (CCA) is typically medial to the internal jugular vein, and the bifurcation is often located near the cricoid cartilage. The ICA is usually posterolateral, with a diameter at its origin greater than that of the anteromedially located external carotid artery (ECA).
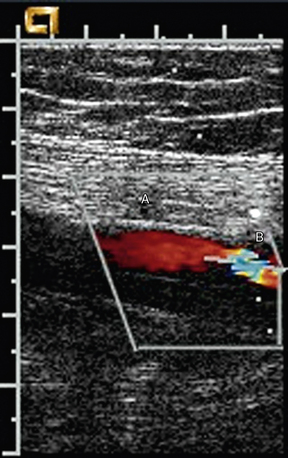
Carotid artery stenosis can be focal, and flow patterns can normalize within a short distance. Therefore, the pulse-wave sample volume should be methodically advanced along the length of the vessel; color Doppler may be used for guidance in delineating areas of abnormal flow requiring change in position of the sample volume (Fig. 12-7). Representative velocity measurements should be recorded from the proximal, mid- and distal CCA. The CCA spectral waveform is a combination of the ECA and ICA waveforms, with greater diastolic flow than the ECA but less than the ICA. Atherosclerosis, when present, is usually most evident at the ICA origin, whereas fibromuscular dysplasia may be more evident distally. Using spectral Doppler, the sample volume is advanced throughout the entire ICA. At a minimum, PSV and EDV from the proximal, mid-, and distal ICA segments should be recorded. The vertebral artery is then located posterior to the carotid artery. The vertebral artery and vein lie between the spinous processes. The vertebral artery is followed as far cephalad as possible, sampling the spectral Doppler in the accessible portions of the vertebral artery.
Distinguishing between the ICA and ECA is critical to the examination (Fig. 12-8). The ECA is usually smaller, more anteromedial, and has less diastolic flow than the ICA. The ECA will also have branches in the cervical region, whereas the ICA will not. Direct comparison of the waveforms from the two vessels is critical. A velocity waveform obtained from the proximal vessel or the site of maximal velocity should be obtained while intermittently tapping on the preauricular branch of the temporal artery. The intermittent tapping is reflected clearly in the diastolic portion of the ECA waveform, but not in the ICA waveform (Fig. 12-9).
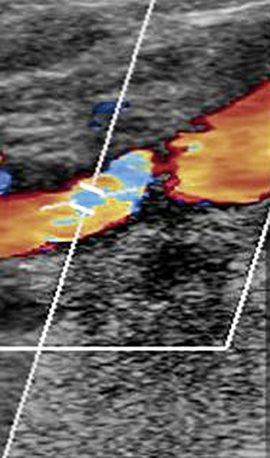
Figure 12-8 Color Doppler of internal carotid artery (ICA).
Color Doppler is added to gray-scale picture of right ICA seen in Figure 12-7. Color aliasing identifies an area of high velocity adjacent to the plaque. This guides placement of spectral Doppler sample volume, identified by parallel white lines.
Stay updated, free articles. Join our Telegram channel

Full access? Get Clinical Tree


