A bedside-available transcatheter aortic valve implantation (TAVI)–dedicated prognostic risk score is an unmet clinical need. We aimed to develop such a risk score predicting 1-year mortality post-TAVI and to compare it with the performance of the logistic EuroSCORE (LES) I and LES-II and the Society of Thoracic Surgeons’ (STS) score. Baseline variables of 511 consecutive patients who underwent TAVI that were independently associated with 1-year mortality post-TAVI were included in the “TAVI 2 -SCORe.” Discrimination and calibration abilities of the novel score were assessed and compared with surgical risk scores. One-year mortality was 17.0% (n = 80 of 471). Porcelain thoracic aorta (hazard ratio [HR] 2.56), anemia (HR 2.03), left ventricular dysfunction (HR 1.98), recent myocardial infarction (HR 3.78), male sex (HR 1.81), critical aortic valve stenosis (HR 2.46), old age (HR 1.68), and renal dysfunction (HR 1.76) formed the TAVI 2 -SCORe (all p <0.05). According to the number of points assigned (1 for each variable and 2 for infarction), patients were stratified into 5 risk categories: 0, 1 (HR 2.6), 2 (HR 3.6), 3 (HR 10.5), and ≥4 (HR 17.6). TAVI 2 -SCORe showed better discrimination ability (Harrells’ C statistic 0.715) compared with LES-I, LES-II, and STS score (0.609, 0.633, and 0.50, respectively). Cumulative 1-year survival rate was 54% versus 88% for patients with TAVI 2 -SCORE ≥3 versus <3 points, respectively (p <0.001). Contrary to surgical risk scores, there was no significant difference between observed and expected 1-year mortality for all TAVI 2 -SCORe risk strata (all p >0.05, Hosmer-Lemeshow statistic 0.304), suggesting superior calibration performance. In conclusion, the TAVI 2 -SCORe is an accurate, simple, and bedside-available score predicting 1-year mortality post-TAVI, outperforming conventional surgical risk scores for this end point.
Current guidelines recommend transcatheter aortic valve implantation (TAVI) to improve symptoms and/or survival in symptomatic patients with severe aortic valve stenosis and high or prohibitive risk for surgical aortic valve replacement. Candidate selection for TAVI is based on the Heart Team decision. Current surgical risk scores, including the logistic EuroSCORE I (LES-I), the logistic EuroSCORE II (LES-II), or the Society of Thoracic Surgeons’ (STS) score predict 30-day survival after conventional surgery and are used to identify high or prohibitive surgical risk patients. These risk scores, however, are not designed nor validated to assess mortality risk for TAVI. In particular, few studies that have evaluated the value of conventional surgical risk scores to predict 1-year mortality after TAVI concluded that the Heart Team evaluation remains the cornerstone in decision making in the absence of a TAVI-dedicated risk score that might have superior discrimination or calibration properties than conventional surgical risk scores. Accordingly, a risk score to predict outcome after TAVI and, thereby, optimize the selection of patients remains an unmet clinical need. The aim of the present study was to test and compare the performance of LES-I, LES-II, and STS score to a newly developed TAVI-dedicated clinical risk score to predict 1-year mortality post-TAVI. We hypothesized that a TAVI-dedicated risk score based on baseline preprocedural patient characteristics might be superior to conventional surgical risk scores in predicting survival.
Methods
Patients with symptomatic severe aortic stenosis (valve area <1.0 cm 2 ; and/or <0.6 cm 2 /m 2 ; and/or mean gradient ≥40 mm Hg) who underwent TAVI at the Leiden University Medical Center (Leiden, The Netherlands) and Centro Cardiologico Monzino IRCCS (Milan, Italy) between November 2007 and November 2012 were included. All patients were considered to be at high or prohibitive surgical risk, according to the Heart Team decision.
Baseline patient demographic data, cardiovascular risk factors, symptoms, medication, laboratory variables, and 2-dimensional transthoracic echocardiographic data were retrospectively analyzed.
Baseline transthoracic 2-dimensional echocardiography was performed using commercially available ultrasound systems (Vivid 7 and E9; GE Medical Systems, Horten, Norway; and iE33; Philips Medical Systems, Andover, Massachusetts). Standard gray-scale and Doppler electrocardiography-triggered cine-loop images were acquired and transferred to a workstation for off-line analysis (EchoPAC, version 110.0.0 or 112.0.0, Horten, Norway). Left ventricular (LV) assessment was performed as recommended, including LV linear dimensions measured at the parasternal long-axis view and LV mass calculated using the Devereux’s formula and indexed to body surface area. LV volumes and ejection fraction were measured according to the Simpson’s method. Similarly, left atrial volume was determined. All volumes were indexed to the body surface area. Early mitral inflow velocity ( E ) was measured on pulse-wave Doppler recordings with the sample volume located at the tips of the mitral leaflets, and the early septal mitral annular velocity ( E′ ) was assessed on apical 4-chamber tissue Doppler acquisitions. Subsequently the E / E′ ratio was calculated. Mitral, aortic, and tricuspid valve regurgitation were evaluated using spectral and color Doppler images and semiquantitatively graded as trivial, mild, moderate, and severe, as recommended. Aortic valve area was assessed using the continuity equation and indexed to the body surface area. On continuous wave Doppler acquisitions in the apical 5-chamber view, the mean transaortic valve gradient was measured. Maximal tricuspid regurgitant jet velocity combined with inferior caval vein respiratory variation was used to calculate systolic pulmonary arterial pressure.
Baseline patient data were used to calculate individual values of conventional surgical risk scores that assess the probability of 30-day mortality after cardiac surgery: LES-I, LES-II, and STS score. Parameters were entered according to the Web site definitions. Additional baseline factors, potentially relating to increased risk of mortality after TAVI, were also collected. These included laboratory findings such as hemoglobin, C-reactive protein (CRP), serum albumin, aspartate transaminase, alanine aminotransferase, and total bilirubin. Poor mobility and neurologic dysfunction were defined in accordance with Web site definitions applied in the LES-II. Frailty was present when evidence existed of a syndrome of decreased reserve and resistance to stressors, resulting from multiple declines across multiple physiological systems, leading to vulnerability to adverse outcomes. Cognitive dysfunction or dementia was noted if mentioned in the medical history. Porcelain aorta and hostile chest were defined in accordance with recent consensus definitions of the Valve Academic Research Consortium. Urgent procedural need comprised patients requiring intervention on current admission for medical reasons.
The vast majority of TAVI procedures (n = 499, 98%) were performed using a balloon-expandable Edwards-SAPIEN prosthesis (Edwards Lifesciences, Irvine, California) of 23, 26, or 29 mm. A minority of patients (n = 12, 2%) received a self-expandable CoreValve prosthesis (Medtronic, Minneapolis, Minnesota), using similar sizes. Prosthesis sizing was based on aortic annulus measurements using 3-dimensional imaging techniques (multidetector row computed tomography [preferably] or transesophageal echocardiography). The transfemoral route was used in 268 patients (52%), whereas a transapical route was chosen in 243 subjects (48%) because of unsuitable anatomy or intervention/surgery of the arterial vascular tree or in case of porcelain aorta. All procedures were performed during general anesthesia under fluoroscopic and transesophageal echocardiographic guidance.
All-cause mortality 1 year after TAVI was the primary study end point. Survival and causes of death were assessed for all patients by consulting the patient’s medical files and the official Dutch National Survival Registry.
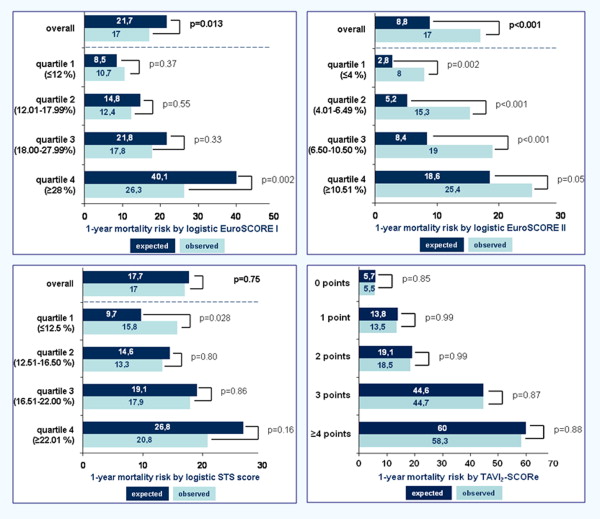
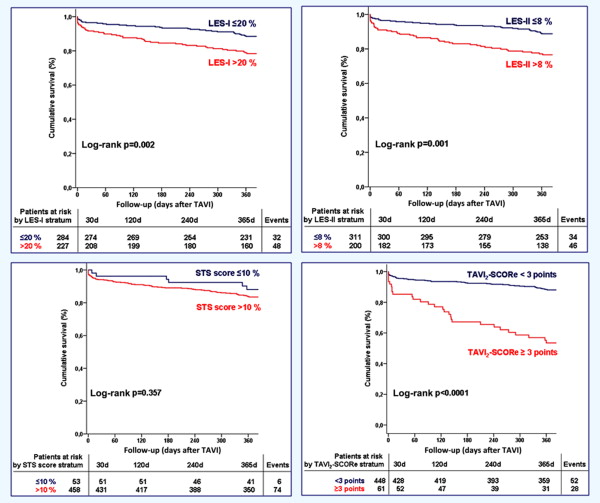
Continuous variables, reported as mean ± SD, if normally distributed and as median with interquartile range if non-normally distributed, were compared with the Student t test and Mann-Whitney U test, respectively. Categorical data are given as percentages and compared by chi-square test or Fisher’s exact test as appropriate. First, performance of conventional surgical risk score models to predict 1-year mortality was evaluated. Discrimination (ability to correctly identify high vs low mortality risk) was evaluated by Harrell’s C statistic. The cumulative survival rate was assessed with the Kaplan-Meier method dichotomizing the patients into high versus low mortality risk, using >20% versus ≤20% for LES-I, >8% versus ≤8% for LES-II, and >10% versus ≤10% for STS score, respectively. Calibration (ability to match patients’ expected vs observed mortality) was determined by binomial testing of expected versus observed overall mortality and according to risk score quartiles. In addition Hosmer-Lemeshow goodness-of-fit statistic was calculated for all surgical risk scores. A value <0.05 indicates significant difference in expected versus observed mortality.
Second, a new TAVI-dedicated 1-year mortality risk prediction model was developed, restricted to demographic, clinical, biochemical, and echocardiographic patient factors present at baseline. Exploratory categorizing of baseline parameters into nominal variables by different cutoff levels was performed and tested at univariate Cox regression analysis. Categorical baseline parameters available in approximately all study patients and achieving univariate significance level of p <0.05 were entered in a multivariate Cox regression model, using a backward elimination approach. Multivariate analysis identified risk factors independently related to 1-year mortality after TAVI. These risk factors were assigned 1 or 2 points, proportional to their respective hazard ratios, to create a simple scoring system, the “TAVI 2 -SCORe” (porcelain Thoracic aorta, Anemia, left Ventricular dysfunction, recent myocardial Infarction, male Sex category, Critical aortic valve stenosis, Old age, and Renal dysfunction). According to the number of points assigned, patients were divided into different risk categories.
Third, the performance of the newly developed TAVI 2 -SCORe model was evaluated using identical discrimination and calibration statistics as described earlier. In addition, internal validation of the model’s discriminatory power was performed by bootstrap validation of Harrell’s C statistic on 100 samples drawn from the patient cohort. The mean difference in performance between each bootstrap sample and its corresponding performance in the original patient sample (optimism) was used to correct the initial Harrell’s C statistic of the original patient cohort for the TAVI 2 -SCORe model.
Fourth, the performance of the new TAVI 2 -SCORe to predict 1-year mortality after TAVI versus that of the conventional surgical risk scores was evaluated based on available results of discrimination and calibration for the respective scores.
SPSS, version 20.0 (SPSS Inc., Chicago, Illinois), was used for statistical analysis. A p value <0.05 was considered statistically significant for all tests that were 2 sided.
Results
A total of 511 patients (median age 82 [77 to 86] years, 38% men) were included, of which 207 (41%) were treated in Leiden and 304 (59%) in Milan. A total of 36 patients were excluded because of incomplete data to calculate respective conventional surgical risk scores. Baseline characteristics are listed in Table 1 . All patients were at high or prohibitive surgical risk as indicated by mean LES-I, LES-II, and STS score. No patients were lost to follow-up for evaluation of the study end point. Within 30 days, 29 (5.7%) died, mainly from cardiovascular causes (n = 25, 86%), as listed in Table 2 . Periprocedural death occurred in 12 patients. In addition, 51 patients died between 30 days and 1 year, resulting in overall 1-year mortality of 17.0% (n = 80 of 471). Mortality between 30 days and 1 year was attributed to cardiovascular cause in 47% (n = 24) of patients. One-year mortality rates were similar between both centers (p = 0.88). Patients were further dichotomized based on 1-year mortality status, as listed in Table 1 . Patients who died within 1 year after TAVI showed significantly higher LES-I and LES-II than patients who survived and tended to have higher STS score.
| Variable | Overall n=511 | At One Year | p value | |
|---|---|---|---|---|
| Alive (n=391) | Dead (n=80) | |||
| Age ( years) | 82 (77-86) | 82 (77-86) | 83 (78-87) | 0.28 |
| Men | 194 (38%) | 135 (35%) | 40 (50%) | 0.009 |
| Body surface area (m 2 ) | 1.77±0.21 | 1.76±0.20 | 1.77±0.23 | 0.68 |
| Body mass index (kg/m 2 ) | 26±4 | 26±4 | 25±4 | 0.16 |
| Sinus rhythm | 393 (77%) | 303 (78%) | 58 (73%) | 0.34 |
| Hypertension | 423 (83%) | 319 (82%) | 66 (83%) | 0.85 |
| Diabetes mellitus II | 141 (28%) | 106 (27%) | 23 (29%) | 0.76 |
| Smoker | 175 (35%) | 134 (34%) | 23 (30%) | 0.34 |
| Hypercholesterolemia | 309 (61%) | 225 (58%) | 50 (63%) | 0.41 |
| Medications | ||||
| B-blocker | 267 (52%) | 201 (51%) | 42 (53%) | 0.86 |
| Diuretics | 375 (73%) | 285 (73%) | 64 (80%) | 0.19 |
| Spironolactone | 102 (20%) | 76 (19%) | 21 (26%) | 0.17 |
| Angiotenisn converting enzyme inhibitor and/or angiotensin II receptor blocker | 302 (59%) | 240 (61%) | 44 (55%) | 050 |
| Statin | 247 (48%) | 180 (46%) | 41 (51%) | 0.40 |
| Insulin | 77 (15%) | 55 (14%) | 14 (18%) | 0.43 |
| Inotrope(s) | 22 (4%) | 17 (4%) | 4 (5%) | 0.77 |
| New York Heart Association class | 0.009 | |||
| I | 17 (3%) | 14 (4%) | 1 (1%) | |
| II | 132 (26%) | 106 (27%) | 12 (15%) | |
| III | 252 (50%) | 196 (50%) | 40 (5%) | |
| IV | 109 (21%) | 75 (19%) | 27 (34%) | |
| Syncope | 105 (21%) | 83 (21%) | 16 (20%) | 0.81 |
| Angina pectoris | 180 (35%) | 140 (36%) | 26 (33%) | 0.57 |
| Logistic Euroscore I | 18.3 (12.1-27.7) | 17.8 (12.1-26.1) | 22.6 (14.3-34.5) | 0.002 |
| Logistic Euroscore II | 6.4 (4.0-10.6) | 6.1 (3.9-10.1) | 9.1 (5.5-14.1) | <0.001 |
| STS score | 16.6 (12.5-22.1) | 16.4 (12.5-21.9) | 17.8 (12.9-23.5) | 0.14 |
| Dialysis | 4 (0.8%) | 4 (1%) | 0 (0%) | 1.00 |
| Chronic obstructive pulmonary disease | 148 (29%) | 107 (27%) | 31 (39%) | 0.042 |
| Peripheral artery disease | 242 (47%) | 179 (46%) | 44 (55%) | 0.13 |
| Porcelain aorta | 58 (11%) | 36 (9%) | 17 (21%) | 0.002 |
| Prior stroke/transient ischemic attack | 74 (14%) | 58 (15%) | 9 (11%) | 0.40 |
| Recent myocardial infarction (<90 days) | 12 (2%) | 6 (2%) | 5 (6%) | 0.025 |
| Prior cardiac surgery | 127 (25%) | 92 (24%) | 22 (28%) | 0.45 |
| Prior percutaneous coronary intervention | 121 (24%) | 90 (23%) | 20 (25%) | 0.84 |
| Poor mobility | 140 (28%) | 110 (28%) | 24 (30%) | 0.75 |
| Neurologic dysfunction | 42 (8%) | 35 (9%) | 7 (9%) | 0.95 |
| Frailty | 98 (21%) | 74 (20%) | 20 (26%) | 0.22 |
| Cognitive dysfunction/dementia | 55 (11%) | 43 (11%) | 12 (15%) | 0.31 |
| Ascites | 4 (1%) | 2 (1%) | 2 (3%) | 0.14 |
| Cirrosis | 15 (3%) | 11 (3%) | 4 (5%) | 0.30 |
| Hostile chest | 93 (18%) | 70 (18%) | 14 (18%) | 0.92 |
| Creatinine clearance (ml/kg/min) | 49 (36-61) | 49 (36-61) | 44 (31-58) | 0.07 |
| Hemoglobin (g/dl) | 12.1±1.6 | 12.1±1.6 | 11.7±1.6 | 0.047 |
| C reactive protein (mg/dl) | 4.0 (2-10) | 3.4 (1.8-8.8) | 7.0 (2.7-15.1) | 0.010 |
| Albumin (g/dl) | 3.8±0.5 | 3.8±0.5 | 3.6±0.6 | 0.030 |
| Total bilirubin (μmol/l) | 0.81 (0.63-1.20) | 0.80 (0.61-1.10) | 0.98 (0.67-1.40) | 0.009 |
| Aspartate transaminase (U/l) | 23 (18-29) | 22 (18-28) | 25 (20-34) | 0.009 |
| Alanin aminotransferase (U/l) | 17 (13-23) | 17 (13-22) | 19 (14-26) | 0.06 |
| Left ventricular end-diastolic diameter (mm) | 48±8 | 48±8 | 48±8 | 0.78 |
| Left ventricular end-systolic diameter (mm) | 31±9 | 31±9 | 32±10 | 0.53 |
| Left ventricular mass index (g/m 2 ) | 145±40 | 146 ± 40 | 150±41 | 0.37 |
| Left ventricular end-diastolic volume index (ml/m 2 ) | 52 (42-68) | 53 (42-68) | 50 (41-70) | 0.45 |
| Left ventricular end-systolic volume index (ml/m 2 ) | 21 (15-34) | 21 (15-34) | 24 (15-37) | 0.37 |
| Left ventricular ejection fraction (%) | 58 (46-66) | 58 (48-66) | 54 (39-61) | 0.008 |
| Left atrial volume index (ml/m 2 ) | 54±23 | 55±24 | 52±16 | 0.32 |
| E/e′ | 26 (18-37) | 26 (17-37) | 32 (20-40) | 0.18 |
| Systolic pulmonary arterial pressure (mmHg) | 39 (30-46) | 39 (31-46) | 42 (32-49) | 0.009 |
| Aortic regurgitation ≥ grade 3 | 25 (5%) | 19 (5%) | 1 (4%) | 1.00 |
| Mitral regurgitation ≥ grade 3 | 33 (7%) | 26 (7%) | 5 (7%) | 1.00 |
| Tricuspid regurgitation ≥ grade 3 | 32 (6%) | 22 (6%) | 7 (9%) | 0.29 |
| Aortic valve mean gradient (mmHg) | 47±17 | 48±16 | 47±20 | 0.43 |
| Aortic valve area indexed (cm 2 /m 2 ) | 0.38±0.10 | 0.38±0.10 | 0.38±0.09 | 0.87 |
| Urgent procedural need | 45 (9%) | 28 (7%) | 14 (18%) | 0.003 |
| Variable | first 30 days (n=29) | 30 days – one year (n=51) | overall (n=80) |
|---|---|---|---|
| Cardiovascular | 25 (86%) | 24 (47%) | 49 (61%) |
| Cardiogenic shock/heart failure | 11 (38%) | 10 (20%) | 21 (26%) |
| Vascular access problems | 7 (24%) | 0 | 7 (14%) |
| iliac dissection | 3 (10%) | 0 | 3 (4%) |
| aortic dissection | 4 (14%) | 0 | 4 (5%) |
| Sudden death | 2 (7%) | 3 (6%) | 5 (6%) |
| Stroke | 0 | 5 (10%) | 5 (6%) |
| Myocardial infarction | 0 | 1 (2%) | 1 (1%) |
| Aortic annulus rupture | 1 (3%) | 0 | 1 (1%) |
| Left main coronary occlusion | 1 (3%) | 0 | 1 (1%) |
| Interventricular septum rupture | 1 (3%) | 0 | 1 (1%) |
| Acute bowel ischemia | 1 (3%) | 1 (2%) | 2 (3%) |
| Intestinal bleeding | 1 (3%) | 2 (4%) | 2 (3%) |
| Pulmonary embolism | 0 | 2 (4%) | 2 (3%) |
| Non cardiovascular | 4 (14%) | 27 (53%) | 31 (39%) |
| Infection | 1 (3%) | 6 (12%) | 7 (9%) |
| Traffic accident | 1 (3%) | 1 (2%) | 2 (3%) |
| Unknown | 2 (3%) | 11 (22%) | 13 (16%) |
| Renal failure | 0 | 2 (4%) | 2 (3%) |
| Respiratory failure | 0 | 2 (4%) | 2 (3%) |
| Liver failure | 0 | 2 (4%) | 2 (3%) |
| Femur fracture | 0 | 1 (2%) | 1 (1%) |
| Oncologic | 0 | 2 (4%) | 2 (3%) |
The Harrell’s C statistic for LES-I, LES-II, and STS score to predict 1-year mortality after TAVI was 0.609 (p = 0.002), 0.633 (p <0.001), and 0.500 (p = 0.14), respectively. Kaplan-Meier survival analysis showed significantly worse cumulative 1-year survival in patients with LES-I >20% compared with ≤20% (79% vs 89%, p = 0.002) and LES-II >8% versus ≤8% (77% vs 89%, p = 0.001) but not when stratified by STS score >10% versus ≤10% (84% vs 89%, p = 0.36; Figure 1 ). These results suggest that LES-II has overall reasonable ability to discriminate between patients at high versus low risk for 1-year mortality after TAVI and better compared with LES-I and STS score.
Overall, the STS score showed good calibration with no significant difference between the number of predicted and observed deaths during 1-year follow-up ( Figure 2 ). The STS score, however, significantly overestimated 1-year mortality for the lowest risk category (first STS score quartile). In contrast, the LES-I and LES-II showed significant differences in predicting 1-year mortality compared with the observed deaths. In particular, LES-I overestimated mainly high-risk patients (fourth quartile) and LES-II significantly overestimated survival within all risk categories (all 4 quartiles). Hosmer-Lemeshow statistics (8 degrees of freedom) confirmed the superior calibration ability of the STS score (0.844) compared with the LES-I (0.457) versus LES-II (0.185).